skip navigation
Blog

Stay up to date on timely topics and market events. Subscribe to our Blog now.

ECONOMY
30 October 2024

Consumer Goods, CAPEX and Government Lift 3Q GDP Growth

By Michael J. Bazdarich, PhD

Stay up to date on timely topics and market events. Subscribe to our Blog now.

Real GDP grew at a 2.8% annualized rate in 3Q24, about the same as the 3.0% rate reported for 2Q. Nominal GDP grew at a 4.7% annualized rate, so that the price index for GDP registered 1.8% annualized inflation in 3Q. This index includes prices for all goods, services and structures produced within US borders.

Prices for the consumer spending portion of GDP (Personal Consumption Expenditures or PCE) rose at a 1.5% annualized rate in 3Q. The Federal Reserve (Fed) has been targeting “core PCE” inflation, that is, consumer inflation excluding food and energy prices, and that measure rose at a 2.2% annualized rate. In response to Fed Chair Powell’s comments that reported housing costs have technical issues, we have been tracking a core inflation measure that excludes housing costs as well as food and energy. That measure rose at a 1.6% rate in 3Q, well below the Fed’s 2% inflation target.

Exhibit 1: Quarterly Growth in Nominal GDP and Consumption
Explore Quarterly Growth in Nominal GDP and Consumption
Source: Bureau of Economic Analysis. As of 30 Sep 24. Select the image to expand the view.

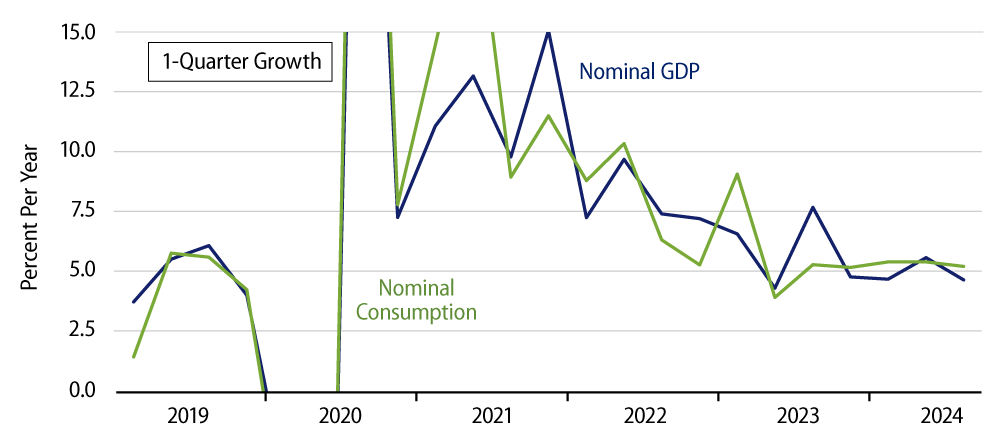
We track growth in nominal GDP as the ultimate driver of inflation and as the ultimate gauge of the effectiveness of Fed policy. Nominal GDP measures the pace of total spending in the economy, and if spending growth is not sufficiently rapid, real growth and inflation cannot coexist. As you can see in the Exhibit 1, nominal spending growth did indeed soar just after the Covid shutdown, and it has been decelerating ever since.

This is a telling indication that Fed policy has worked to constrain inflation on an ongoing basis in recent years. Notice that over most of the last two years, nominal spending growth has maintained the same rate seen prior to the pandemic. We think this indicates that inflation will indeed sustain at rates comparable to those seen prior to the pandemic. The 3Q rate of growth in nominal GDP was right in line with this.

As for the sources of 3Q real growth, Exhibit 2 breaks down GDP growth according to goods, services and construction. (“Goods” includes manufacturing, mining and related industries.) We think this provides a good perspective on where growth is occurring—and where it is not. For goods production, we also break out farms and motor vehicles, the latter because of its often disparate performance relative to the rest of the economy. Sectors showing especially rapid growth in 2Q or 3Q are shaded in green, while those that are especially weak are shaded in red.

Exhibit 2: GDP Growth by Component
Explore GDP Growth by Component
PCE Inflation Data—Source: Bureau of Economic Analysis. As of 31 Dec 22. Inflation within GDP Data—Bureau of Economic Analysis, Western Asset. As of 31 Dec 23. Annualized PCE Data—Bureau of Economic Analysis, Western Asset. As of 31 Dec 23. Note: All figures are in 2017 dollars. Select the image to expand the view.

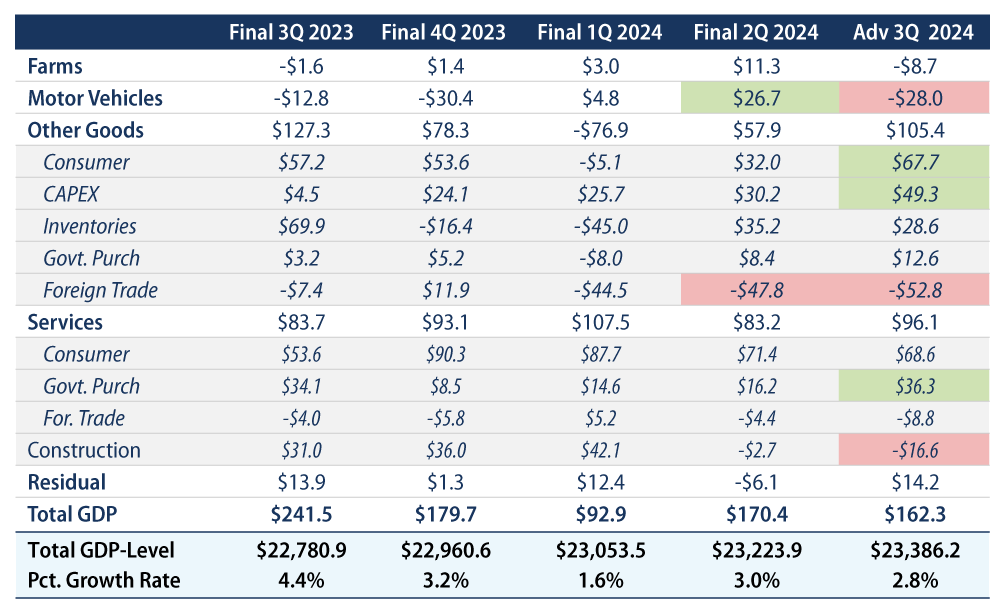
Indeed, motor vehicle production was reported as declining sharply in 3Q. This followed a similarly sized increase in 2Q. What is happening there is that the timing of the model-year shutdown for vehicle production is changing, and government seasonal adjustment factors have not yet adapted to this shift, hence the offsetting swings in 2Q and 3Q.

Elsewhere, consumer spending on goods rose nicely in 3Q, after softness earlier in the year. This is right in line with our previous analyses of retail sales growth. Business investment in equipment (CAPEX) was also particularly strong in 3Q. However, much of this investment was in imported equipment, which was one source of the big negative contribution to growth from foreign trade in goods.

3Q growth also got a sizable boost from government purchases of services. More than half of that increase was in defense spending and would appear to reflect assistance to Ukraine and Israel. State and local payrolls also saw a modest increase.

Meanwhile, construction contributed negatively to 3Q growth, reflecting declines in both residential and nonresidential construction spending.

Notice that much of the GDP growth occurred in goods production. We find this odd given that manufacturing accounts for the bulk of domestic goods production and factory output has seen essentially no growth over the last year. Still, that is what the GDP data proclaim.

All in all, a decent real GDP gain and the restrained growth in nominal spending augurs well for continued restraint in inflation.

© Western Asset Management Company, LLC 2025. The information contained in these materials ("the materials") is intended for the exclusive use of the designated recipient ("the recipient"). This information is proprietary and confidential and may contain commercially sensitive information, and may not be copied, reproduced or republished, in whole or in part, without the prior written consent of Western Asset Management Company ("Western Asset").
Past performance does not predict future returns. These materials should not be deemed to be a prediction or projection of future performance. These materials are intended for investment professionals including professional clients, eligible counterparties, and qualified investors only.
These materials have been produced for illustrative and informational purposes only. These materials contain Western Asset's opinions and beliefs as of the date designated on the materials; these views are subject to change and may not reflect real-time market developments and investment views.
Third party data may be used throughout the materials, and this data is believed to be accurate to the best of Western Asset's knowledge at the time of publication, but cannot be guaranteed. These materials may also contain strategy or product awards or rankings from independent third parties or industry publications which are based on unbiased quantitative and/or qualitative information determined independently by each third party or publication. In some cases, Western Asset may subscribe to these third party's standard industry services or publications. These standard subscriptions and services are available to all asset managers and do not influence rankings or awards in any way.
Investment strategies or products discussed herein may involve a high degree of risk, including the loss of some or all capital. Investments in any products or strategies described in these materials may be volatile, and investors should have the financial ability and willingness to accept such risks.
Unless otherwise noted, investment performance contained in these materials is reflective of a strategy composite. All other strategy data and information included in these materials reflects a representative portfolio which is an account in the composite that Western Asset believes most closely reflects the current portfolio management style of the strategy. Performance is not a consideration in the selection of the representative portfolio. The characteristics of the representative portfolio shown may differ from other accounts in the composite. Information regarding the representative portfolio and the other accounts in the composite are available upon request. Statements in these materials should not be considered investment advice. References, either general or specific, to securities and/or issuers in the materials are for illustrative purposes only and are not intended to be, and should not be interpreted as, recommendation to purchase or sell such securities. Employees and/or clients of Western Asset may have a position in the securities or issuers mentioned.
These materials are not intended to provide, and should not be relied on for, accounting, legal, tax, investment or other advice. The recipient should consult its own counsel, accountant, investment, tax, and any other advisers for this advice, including economic risks and merits, related to making an investment with Western Asset. The recipient is responsible for observing the applicable laws and regulations of their country of residence.
Founded in 1971, Western Asset Management Company is a global fixed-income investment manager with offices in Pasadena, New York, London, Singapore, Tokyo, Melbourne, São Paulo, Hong Kong, and Zürich. Western Asset is a wholly owned subsidiary of Franklin Resources, Inc. but operates autonomously. Western Asset is comprised of six legal entities across the globe, each with distinct regional registrations: Western Asset Management Company, LLC, a registered Investment Adviser with the Securities and Exchange Commission; Western Asset Management Company Ltda. is regulated by Comissão de Valores Mobiliários; Western Asset Management Company Pty Ltd ABN 41 117 767 923 is the holder of the Australian Financial Services License 303160; Western Asset Management Company Pte. Ltd. Co. Reg. No. 200007692R is a holder of a Capital Markets Services License for fund management and regulated by the Monetary Authority of Singapore; Western Asset Management Company Ltd, a registered Financial Instruments Business Operator and regulated by the Financial Services Agency of Japan; and Western Asset Management Company Limited is authorised and regulated by the Financial Conduct Authority ("FCA") (FRN 145930). This communication is intended for distribution to Professional Clients only if deemed to be a financial promotion in the UK as defined by the FCA. This communication may also be intended for certain EEA countries where Western Asset has been granted permission to do so. For the current list of the approved EEA countries please contact Western Asset at +44 (0)20 7422 3000.