skip navigation
Blog

Stay up to date on timely topics and market events. Subscribe to our Blog now.

CREDIT
18 January 2024

A Look Back at Credit—Through Transitions in Rate Cycles

By James J. So, CFA

Stay up to date on timely topics and market events. Subscribe to our Blog now.

Reviewing past monetary policy transitions—from the end of a Federal Reserve (Fed) interest-tightening cycle to an easing cycle—shows that historically, US investment-grade credit has performed well in total return terms after the end of such tightening cycles (Exhibit 1). Much of this move is driven by underlying Treasury yields reacting either to the impetus for the pause in tightening or to the anticipated easing cycle.

Exhibit 1: Bloomberg US Corporate Index Cumulative Total Returns—12 Months Before and 24 Months After a Fed Pause
Bloomberg US Corporate Index Cumulative Total Returns—12 Months Before and 24 Months After a Fed Pause
Source: Bloomberg, Western Asset. As 31 Dec 23. Select the image to expand the view.

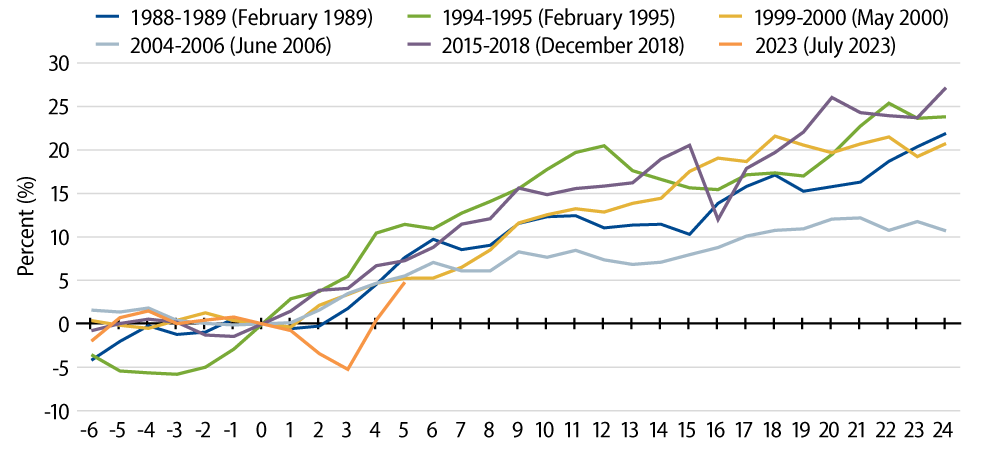
Relative to equivalent-duration government bonds, investment-grade credit has also generally outperformed government bonds for a period of time after the last rate hike (Exhibit 2). While the circumstances for each interest-rate cycle are different, and one must remain vigilant about the “long and variable lags” of monetary policy along with the potential for a shift in corporate management behavior, the additional carry that credit offers has often helped to generate additional returns for some time.

Exhibit 2: US Corporate Index Cumulative Excess Returns Around FOMC Pause
US Corporate Index Cumulative Excess Returns Around FOMC Pause
Source: Bloomberg, Western Asset. As 31 Dec 23. Select the image to expand the view.

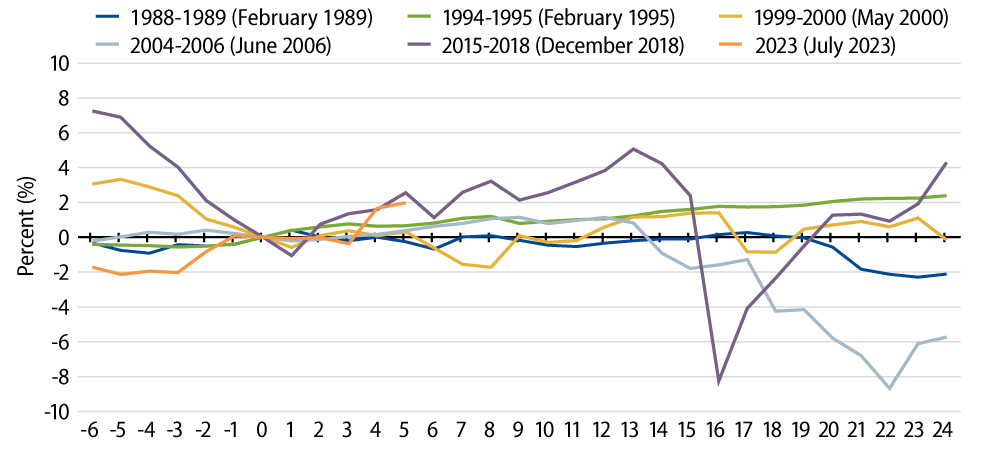
Exhibit 2 illustrates the last five rate cycles and shows that in the 12 months after a Fed pause, credit outperformed in four of the five transitions, with the 1989 pause being the exception. When looking out 24 months after a Fed pause, once the long and variable lags have had more time to bite, credit outperformed in two of the five most recent cycles, pushed in one, while underperforming in the 1989 and 2006 experiences. Those last two periods do share a similar theme in that the financial sector underwent a rebalancing of excesses—regarding both the savings and loans crisis of the late ’80s/early ’90s, then during the global financial crisis when volatility peaked in 2008.

Where Are We Today?

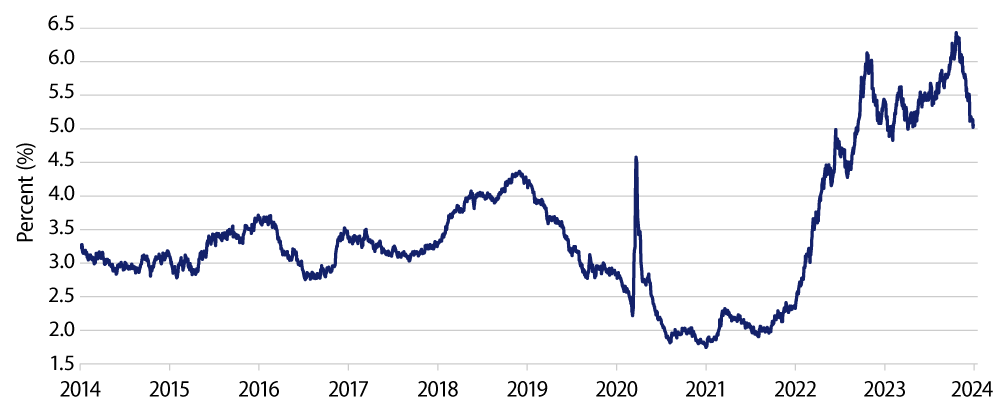
With rates currently around 5%, all-in investment-grade yields are still elevated. Index yields are off recent highs, but they are still a healthy bit above the pre-Covid range of 3%-4%.

Exhibit 3: Investment-Grade Yields—Bloomberg US Corporate Index YTW
Investment-Grade Yields—Bloomberg US Corporate Index YTW
Source: Bloomberg. As of 31 Dec 23. Yield-to-worst (YTW) is the lowest potential yield that can be received on a bond without the issuer actually defaulting. Select the image to expand the view.

Disinflation, Monetary Policy and the Backdrop Today

Going forward, we believe that inflation in the US has peaked and will continue to head lower. As John Bellows articulated in a recent blog post, “The dramatic decline in realized inflation reflects a wide range of improvements.” The Fed has recognized these improvements and has left its policy rate unchanged since July 2023. At its most recent December 2023 meeting, the Federal Open Market Committee (FOMC) stated via the Summary of Economic Projections (SEP) that it has lowered the 2024-2026 expectations for both inflation and policy rates. The current SEP dot plot suggests three rate cuts in 2024, while the markets have raced ahead and priced in even more.

The rest of the backdrop for credit is also balanced from a total return perspective. In addition to still elevated yields, we view the following factors as largely constructive:

  • Economic Growth—Our base case is for decelerating growth, not a hard landing; investment-grade companies’ balance sheets remain robust enough to weather a slowing economy.
  • Valuations—Overall spreads are near the tighter end of our expected range but this reflects still-solid corporate fundamentals. Should the economy be weaker than anticipated, falling Treasury yields may offset spread-widening. Spreads are currently pricing in a soft landing and, should that unfold, the experience of the mid-’90s may be the closest parallel.
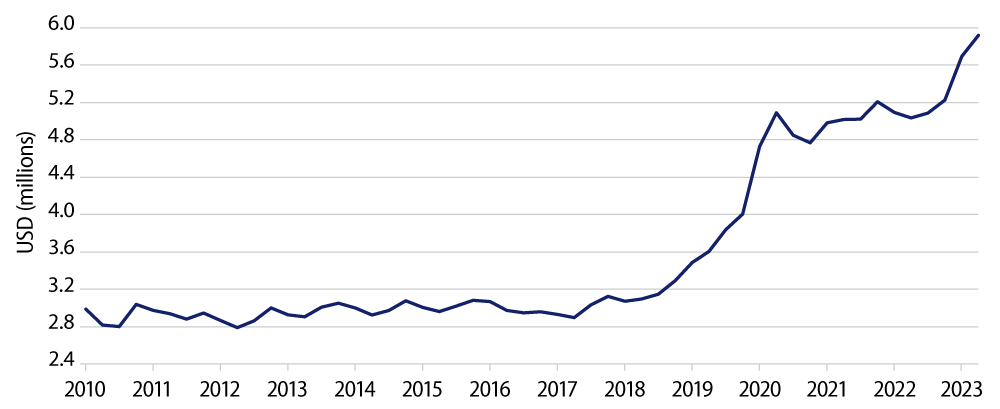
  • Technical Backdrop—The current economic environment is a continuing tailwind. Corporate issuance is forecast to remain stable in 2024 compared to 2022/2023 levels. But demand is expected to be robust as the massive flows that went into cash (Exhibit 4) could be redeployed given the anticipated central bank policy rate cuts. Overseas demand should also increase as FX hedging costs are expected to ease.
  • Exhibit 4: Assets Flowed Into Cash—Money Market Fund Balances Approach $6 Trillion
    Assets Flowed Into Cash—Money Market Fund Balances Approach $6 Trillion
    Source: Board of Governors of the Federal Reserve System (US). As of 29 Dec 23. Select the image to expand the view.

  • Active Management—As always, there are certain industries that we believe will benefit from fundamental tailwinds (e.g., banking, metals & mining—especially copper), while others face headwinds (e.g., utilities, lower-quality technology). There may also be a better entry point for longer-dated credit as spreads there are historically tight due to the recent supply/demand imbalances; yield-based buyers locking in attractive all-in yields in 2H23 were met with dwindling long-end supply (corporations being prudent by not wanting to lock in high financing costs for a long period of time).

While investment-grade credit returns, as measured by the Bloomberg US Corporate Index, have already turned the corner (+8.5% in the last three months, as of December 31, 2023), history suggests that there may still be room to run, especially as we believe the current backdrop remains supportive.

© Western Asset Management Company, LLC 2024. The information contained in these materials ("the materials") is intended for the exclusive use of the designated recipient ("the recipient"). This information is proprietary and confidential and may contain commercially sensitive information, and may not be copied, reproduced or republished, in whole or in part, without the prior written consent of Western Asset Management Company ("Western Asset").
Past performance does not predict future returns. These materials should not be deemed to be a prediction or projection of future performance. These materials are intended for investment professionals including professional clients, eligible counterparties, and qualified investors only.
These materials have been produced for illustrative and informational purposes only. These materials contain Western Asset's opinions and beliefs as of the date designated on the materials; these views are subject to change and may not reflect real-time market developments and investment views.
Third party data may be used throughout the materials, and this data is believed to be accurate to the best of Western Asset's knowledge at the time of publication, but cannot be guaranteed. These materials may also contain strategy or product awards or rankings from independent third parties or industry publications which are based on unbiased quantitative and/or qualitative information determined independently by each third party or publication. In some cases, Western Asset may subscribe to these third party's standard industry services or publications. These standard subscriptions and services are available to all asset managers and do not influence rankings or awards in any way.
Investment strategies or products discussed herein may involve a high degree of risk, including the loss of some or all capital. Investments in any products or strategies described in these materials may be volatile, and investors should have the financial ability and willingness to accept such risks.
Unless otherwise noted, investment performance contained in these materials is reflective of a strategy composite. All other strategy data and information included in these materials reflects a representative portfolio which is an account in the composite that Western Asset believes most closely reflects the current portfolio management style of the strategy. Performance is not a consideration in the selection of the representative portfolio. The characteristics of the representative portfolio shown may differ from other accounts in the composite. Information regarding the representative portfolio and the other accounts in the composite are available upon request. Statements in these materials should not be considered investment advice. References, either general or specific, to securities and/or issuers in the materials are for illustrative purposes only and are not intended to be, and should not be interpreted as, recommendation to purchase or sell such securities. Employees and/or clients of Western Asset may have a position in the securities or issuers mentioned.
These materials are not intended to provide, and should not be relied on for, accounting, legal, tax, investment or other advice. The recipient should consult its own counsel, accountant, investment, tax, and any other advisers for this advice, including economic risks and merits, related to making an investment with Western Asset. The recipient is responsible for observing the applicable laws and regulations of their country of residence.
Founded in 1971, Western Asset Management Company is a global fixed-income investment manager with offices in Pasadena, New York, London, Singapore, Tokyo, Melbourne, São Paulo, Hong Kong, and Zürich. Western Asset is a wholly owned subsidiary of Franklin Resources, Inc. but operates autonomously. Western Asset is comprised of six legal entities across the globe, each with distinct regional registrations: Western Asset Management Company, LLC, a registered Investment Adviser with the Securities and Exchange Commission; Western Asset Management Company Distribuidora de Títulos e Valores Mobiliários Limitada is authorized and regulated by Comissão de Valores Mobiliários and Brazilian Central Bank; Western Asset Management Company Pty Ltd ABN 41 117 767 923 is the holder of the Australian Financial Services License 303160; Western Asset Management Company Pte. Ltd. Co. Reg. No. 200007692R is a holder of a Capital Markets Services License for fund management and regulated by the Monetary Authority of Singapore; Western Asset Management Company Ltd, a registered Financial Instruments Business Operator and regulated by the Financial Services Agency of Japan; and Western Asset Management Company Limited is authorised and regulated by the Financial Conduct Authority ("FCA") (FRN 145930). This communication is intended for distribution to Professional Clients only if deemed to be a financial promotion in the UK as defined by the FCA. This communication may also be intended for certain EEA countries where Western Asset has been granted permission to do so. For the current list of the approved EEA countries please contact Western Asset at +44 (0)20 7422 3000.