

KEY TAKEAWAYS
- While we do concede that a rise in inflation is more of a possibility at present than at any time over the past 40 years, we’re not convinced it is inevitable or even likely.
- We believe a confluence of factors need to be present—not simply very low interest rates and stimulus—for a sustained rise in inflation to occur.
- Our view is that the increase in the money supply engineered by the Fed, with help from Treasury, has been fully offset by increasing money demand.
- Stricter banking regulations limit the effectiveness of monetary policy, which we cite as the best reason to think that inflation will remain contained.
Introduction
Fears of inflation have resurfaced in recent months, largely in response to dramatic and continued efforts by both the federal government and Federal Reserve (Fed) to assuage the effects of the COVID-19 pandemic and resultant economic shutdowns. Break-even inflation rates have jumped as much as 180 basis points (bps) from mid-shutdown lows and are generally about 30 bps above pre-Covid levels. Meanwhile, both the financial press and financial market commentary are replete with articles and analyses finding rising inflation to be just around the corner.
We have seen claims like these arise in the past. The combination of tax cuts and monetary easing in response to the recession of 1981-1982 generated widespread fears of resurgent inflation through the 1980s. Similar concerns accompanied the Fed’s quantitative easing (QE) operations during the global financial crisis (GFC) of 2007-2009. Just three years ago, in early 2018, we produced a paper countering fears that inflation would resurge in response to the Trump era tax cuts and low Fed yield levels. Since the early-1980s, recurrent, widespread anxiety over resurging inflation have been continually proven wrong.
It might be different this time. Various elements that were absent during previous inflation scares have come into play presently, namely very rapid growth in the money stock. At the same time, however, other prevalent features of the inflationary environment of the 1960s and 1970s have failed to recur, namely rapid growth in bank lending or in aggregate spending and a noticeable response of the real economy to monetary policy initiatives.
We concede that rising inflation is more of a possibility at present than has been the case over the past 40 years. However, we do not believe rising inflation is inevitable or even likely. In this paper, we expand upon the analysis from our 2018 piece to make this case.
One popular tool we don’t take much solace from presently is output gap analysis. Some in the Fed and on Wall Street believe inflation can’t take off when the economy is as depressed as it is presently, with aggregate GDP well below late-2019 levels and even further below trend growth paths. However, when the dramatically different contours of the Covid recession are considered alongside continued shutdowns in those sectors where output is still depressed, output gap analysis can be seen to provide no comfort now.
Our belief that inflation will stay low derives from our assessment that the increase in supply of money engineered by the Fed, with help from Treasury, has been fully offset by increasing money demand. Both consumers and businesses, fearful about the future, have desired to build up deposit balances to protect themselves against the ravages of the pandemic. These fears may not subside when the pandemic does, and even if they do, the lack of a functioning commercial banking system in the US and across the developed market (DM) world should work to dampen inflationary pressures.
Fed Policy, Nominal GDP Growth and Inflation
An oft-cited definition of inflation is that it is simply too much money chasing too few goods. Not only must the central bank be creating new money, but also it must be creating it faster than the private sector desires it—hence too much money—and that excessive money creation must be leading to rapid growth in spending—hence the “chasing” of goods.
While no one violently disagrees with this truism, there are differing ways of determining when there is “too much” money. Keynesians look at the level of interest rates, and if they see these to be too low, they would tend to believe that there is too much money and that inflation pressures could arise. Supply-siders look at commodity prices, most often gold prices, to determine whether there is too much money. Monetarists look first at the money stock.
All these “strands” of economic analysis have both their strengths and their weaknesses. For all of them, the monetary indicator of choice can be clearly seen to be giving accurate signals only if aggregate spending in the economy is moving commensurately. However you reckon Fed policy, if the Fed is indeed supplying too much money, that must be reflected in the growth rate of spending in the economy. Fed policy can’t engineer higher (or lower) inflation unless it is driving faster (or slower) spending.
We made this point in our 2018 paper. We showed there that 1) historically, sustained ups and downs in nominal GDP growth invariably preceded ups and downs in US inflation, and 2) there was no sustained acceleration in nominal GDP growth in 2018, which is why inflation fears then were misplaced.
It should come as no surprise that nominal GDP growth has been depressed over the past year. The 4Q20 level of GDP was down on net from that of 4Q19, and inflation was lower to boot. As adamantly as the Fed—and federal government—tried to stimulate the economy last year, the fact is that their efforts—so far—have failed to fully offset the drag from the pandemic and shutdowns.

This, of course, may change in 2021 or after, as shutdowns are lifted. However, first, we should acknowledge that such changes are speculation, not fact, and second, we should analyze what actually has been happening to get some idea as to whether conditions will indeed change this year or next.
Fed Policy, Interest Rates and the Money Stock
We mentioned earlier that each approach to monetary policy has its strengths and weaknesses. We’ll focus here on the interest rate and money stock approaches. Interest rates are readily observable, and everyone understands them or believes they do. However, interest rates are market prices, and, as such they are determined by both demand and supply.
The Fed supplies liquidity to the financial system, thus influencing interest rates. However, movements in the demand for funds/liquidity can move interest rates as well. Not every move in interest rates is the result of Fed policy, and so movements in interest rates need not be indicative of the stance of Fed policy.
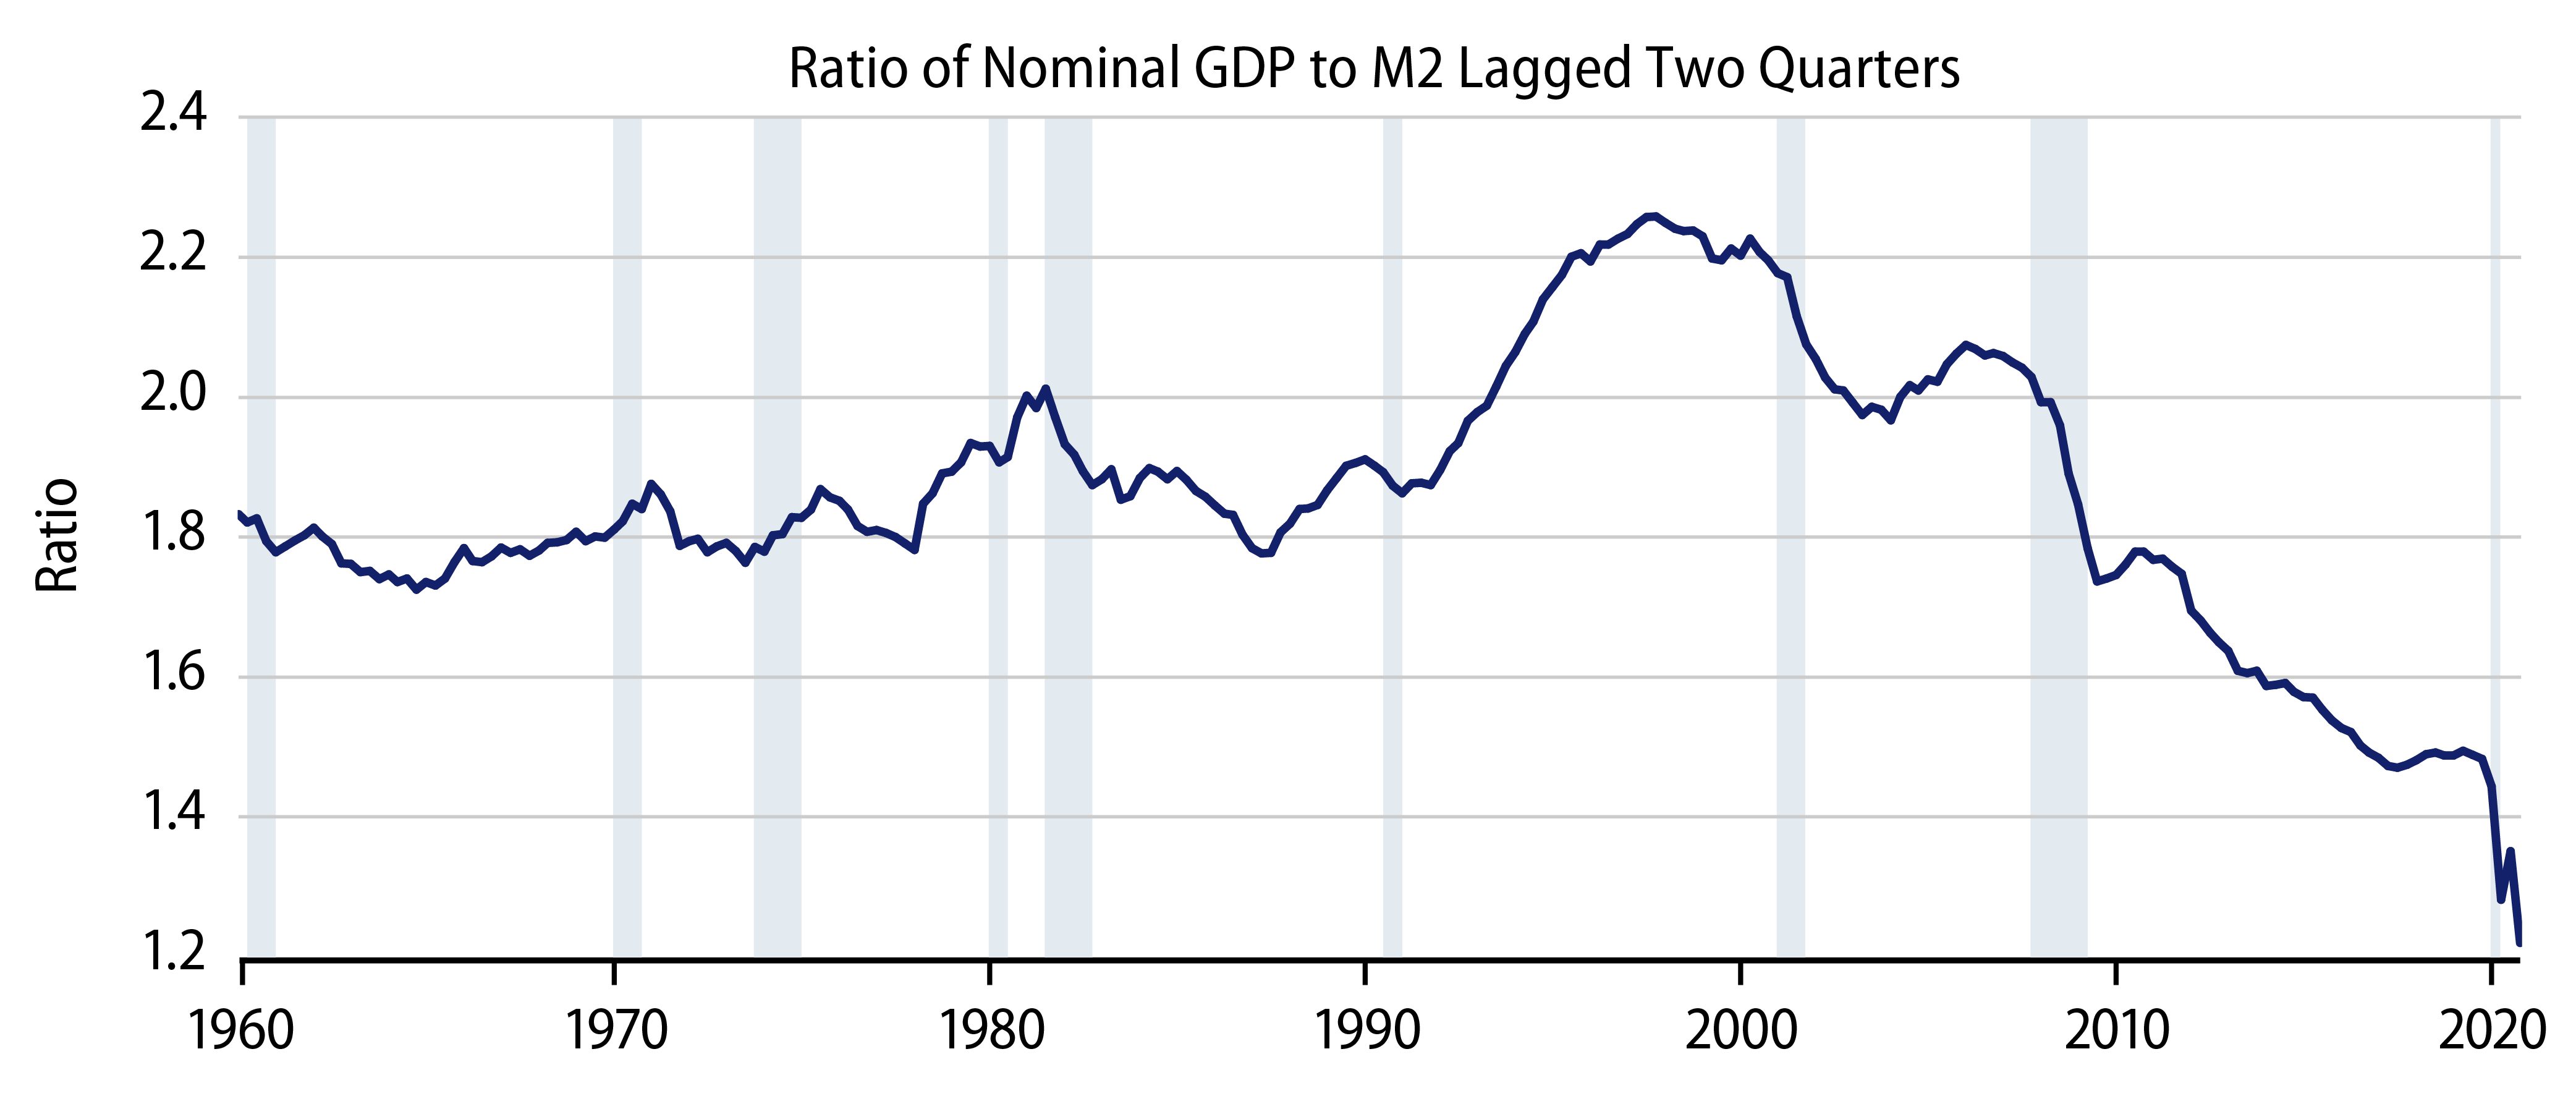
Interest rates have been trending lower for the past 40 years. There is no reason to think that Fed policy has generally been expansive over that time. As seen in Exhibit 1, the declining trend growth in nominal GDP over 1981-2019 argues forcefully against the premise of generally expansive policy by the Fed over that span, as does the accompanying downtrend in inflation.
The existence of supposedly unsustainably low interest rates has been a common factor cited during all the inflation scares of the last 40 years. Yet each such scare proved wrong. The level of interest rates alone has been a lousy indicator of the easiness or tightness of Fed policy throughout the last 40 years, and we would argue it was similarly misleading in the 1960s and 1970s.
Furthermore, as pointed out in our 2018 paper, the direct stimulus from a decline in interest rates fades as the lags from yield to spending run out. Once those lags have elapsed, a given level of yields itself no longer stimulates activity. Holding interest rates at a given level—however low—can be sustainedly expansive policy only if the Fed is artificially holding them at levels that the economy would not otherwise sustain. But such artificial suppression of yields must be accompanied by the constant shoveling by the Fed of ever-greater amounts of new money into the system. How else could an “unsustainable” level of interest rates be sustained?
There was no evidence of such “force-feeding” by the Fed over 2015-2018, and the evidence is pretty skimpy at present. The pace of Fed open-market operations (balance sheet expansion) plummeted last summer following a spring binge and has since held steady. Yes, yields have moved higher since August 2020, but rate pressures have not been explosive nor relentless, and we see no evidence of overheating in the financial markets or the economy.
The money stock approach to monetary policy has problems of its own. In the post-1980s financial system, with interest paid on most checking deposits and with the ability to instantly shift funds from savings accounts to checking accounts and back, we see much more widespread “hot money” flows driving spurious swings in the money stock than we did prior to 1980. Near-zero yields only exacerbate this. Furthermore, a succession of financial shocks has driven increased demand to hold—rather than spend—liquid assets, leading to downward pressure on the velocity of money, thus reduced efficacy of the money stock in predicting/explaining nominal GDP and inflation (Exhibit 2).
Fed Policy Works Through the Banking System
So, neither interest rates nor the money stock have in recent decades provided simple, simplistic measures by which to judge monetary policy and predict inflation. Those analysts citing simplistic depictions of Fed policy have consistently been wrong about inflation for the past 40 years.
Throughout this period, though, we believe one feature has continued to hold true. A pervasive disinflationary environment—tempo—has been sustained throughout the economy.
Both inflationary and disinflationary environments are pervasive. You can see their presence throughout the financial sector and, indeed, across most of the economy.
In the 1960s and 1970s, Fed policy was generally inflationary. Not only was there an uptrend in nominal GDP growth, but also there were uptrends in growth of the money stock and of bank lending (Exhibit 3). The Fed generally provided more liquidity to the financial system than was required at previously existing rates of inflation and real growth, with the result that the extra liquidity was converted into new bank loans and bank deposits that generated still more spending growth and inflation.
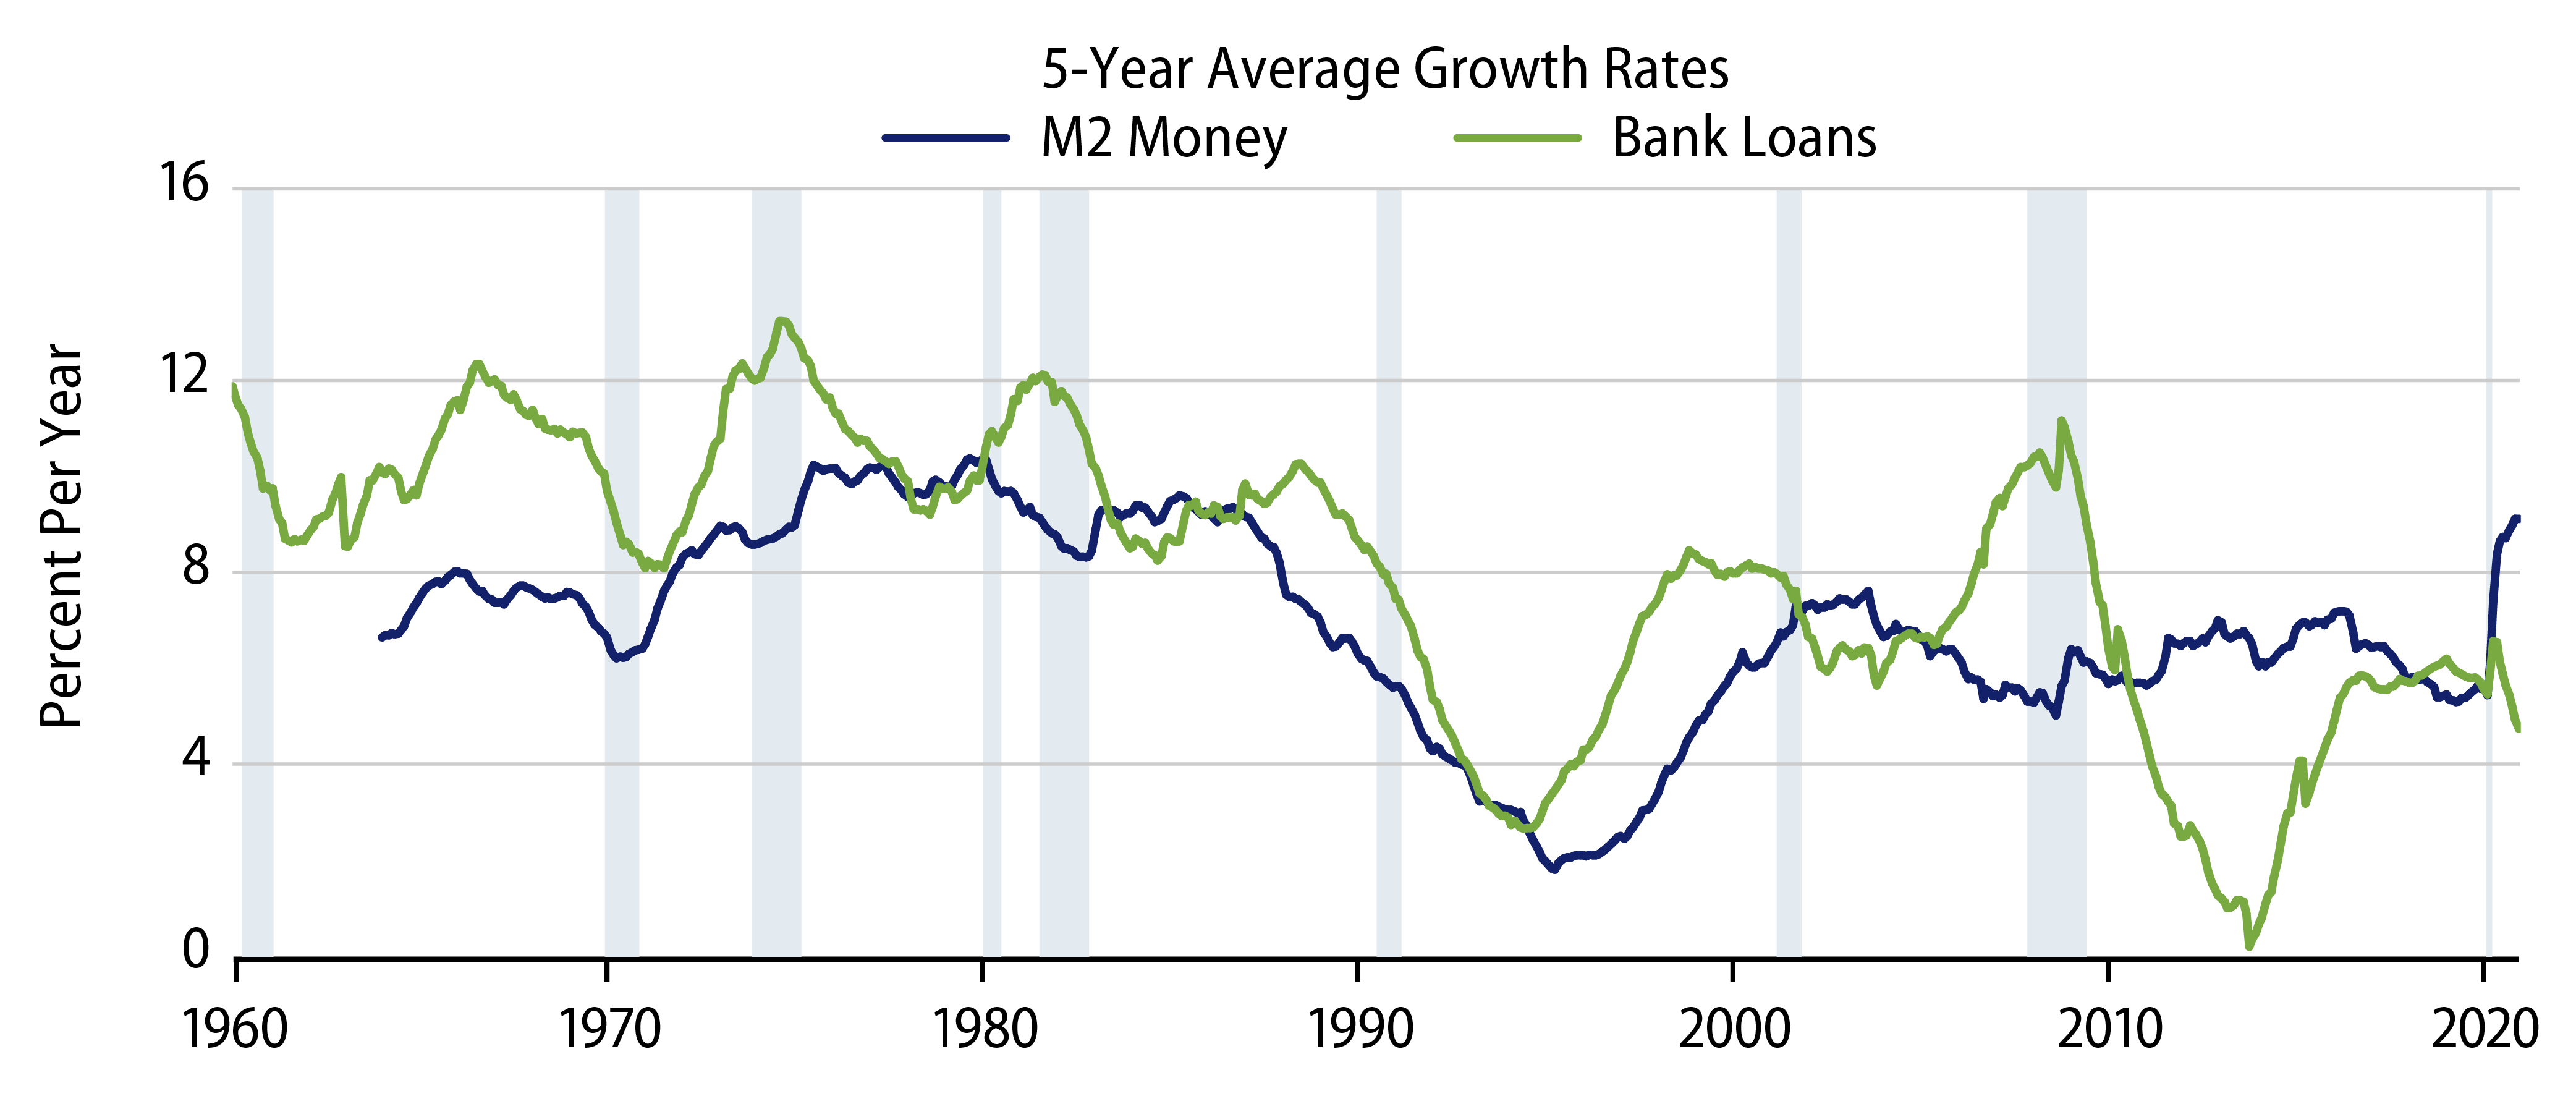
When Fed policy dramatically shifted course in 1979 and after under Paul Volcker, these trends shifted. Nominal GDP growth started to trend lower. More importantly, bank lending growth turned lower as well, as did, most of the time, growth in the money stock.
We have seen no such pervasive shift in financial activity since then. In 1983-1984, when the money stock briefly accelerated, bank lending did not accelerate in turn, nor did nominal GDP growth. In retrospect, we can say that lower inflation led households and businesses to want to rebuild liquid balances depleted during the high inflation period. This allowed a one-time burst in the money stock without a rise in inflation.
In 2001-2002, a recession then as well as the effects of Y2K and 9/11 the next year led to brief, emergency pulses of liquidity by the Fed into the financial system. These were one-time injections, without any accompanying pick-ups in the money stock or bank lending—and without any impact on nominal GDP nor inflation.
In the aftermath of the GFC, again, the Fed embarked on a program of massive quantitative easing, quadrupling the size of its balance sheet. However, while banks were more than flush with liquidity, bank lending never picked up, nor did the money stock, and nominal GDP growth continued along a generally declining trend, with no meaningful upward pressure on inflation.
Why didn’t banks lend out the massive amounts of liquidity that had been provided to them? The best answer we have is that newly imposed and enforced capital requirements prevented it. After the Basel Accords, US banks were subject to global capital requirements that had not previously been in place nor enforced. (Fed capital requirements were generally not enforced during recessions or periods of widespread financial stress.) Furthermore, since the GFC, the Fed itself has added on a number of varying stress-test-based capital and liquidity requirements imposed on banks. In order to increase holdings of “risky” assets such as mortgages or business loans, banks now have to hold not only sufficient deposits and reserves to fund the loans, but also sufficient capital and liquidity to be able to survive potential defaults on such loans.
While expansive Fed open-market operations increase banks’ ability to fund higher loan levels, they do nothing to enhance banks’ capital, thus banks’ ability to sustain such holdings. In the mid- and post-GFC environment of loan charge-offs and stressed balance sheets, banks did not have sufficient capital to expand their holdings of risky assets, and the liquidity provided by the Fed ended up sitting idly on banks’ balance sheets as deposits at the Fed.
Without the banking system “recycling” liquidity throughout the economy, the Fed’s actions did nothing to stimulate money growth, nominal spending growth, nor even, apparently, interest rate levels. (That is to say, there is reason to think that massive QE had no effect on interest rate levels, given that it had no discernible effect on financial sector activity nor on the economy.)
What’s Different This Time
Once again, three installments of QE failed to elicit any response in the US money stock, which grew essentially at pre-GFC trend rates throughout the 2009-2020 expansion. The money stock has behaved differently so far during the pandemic. Indeed, the Fed’s QE efforts—aka balance sheet expansion—last spring was accompanied by a massive expansion of the money stock.
Why were things so different in 2020 from 2009-2020? In the post-GFC expansion, Fed activities consisted of standard open-market operations, where the Fed bought Treasuries and mortgages in exchange for increased bank deposits at the Fed. The banking system held more (interest-bearing) liabilities of the Fed and less interest-bearing liabilities of the Treasury, with little else changed.
In contrast, in 2020, while the Fed’s direct actions were again largely open-market exchanges of Fed deposits for cash, these accompanied similarly massive payments of cash by the Treasury to businesses and households via the CARES Act. The Treasury sold new T-Bills and T-Bonds to fund its payments to the private-sector, and those sales offset the purchases of T-Bills and T-Bonds by the Fed.
On net, the private sector and financial system held more liabilities of the Fed without any reduction in its holdings of Treasury liabilities. In effect, the Fed and Treasury together were practicing Modern Monetary Theory (MMT), sending cash directly to individuals financed by Treasury-issued debt.
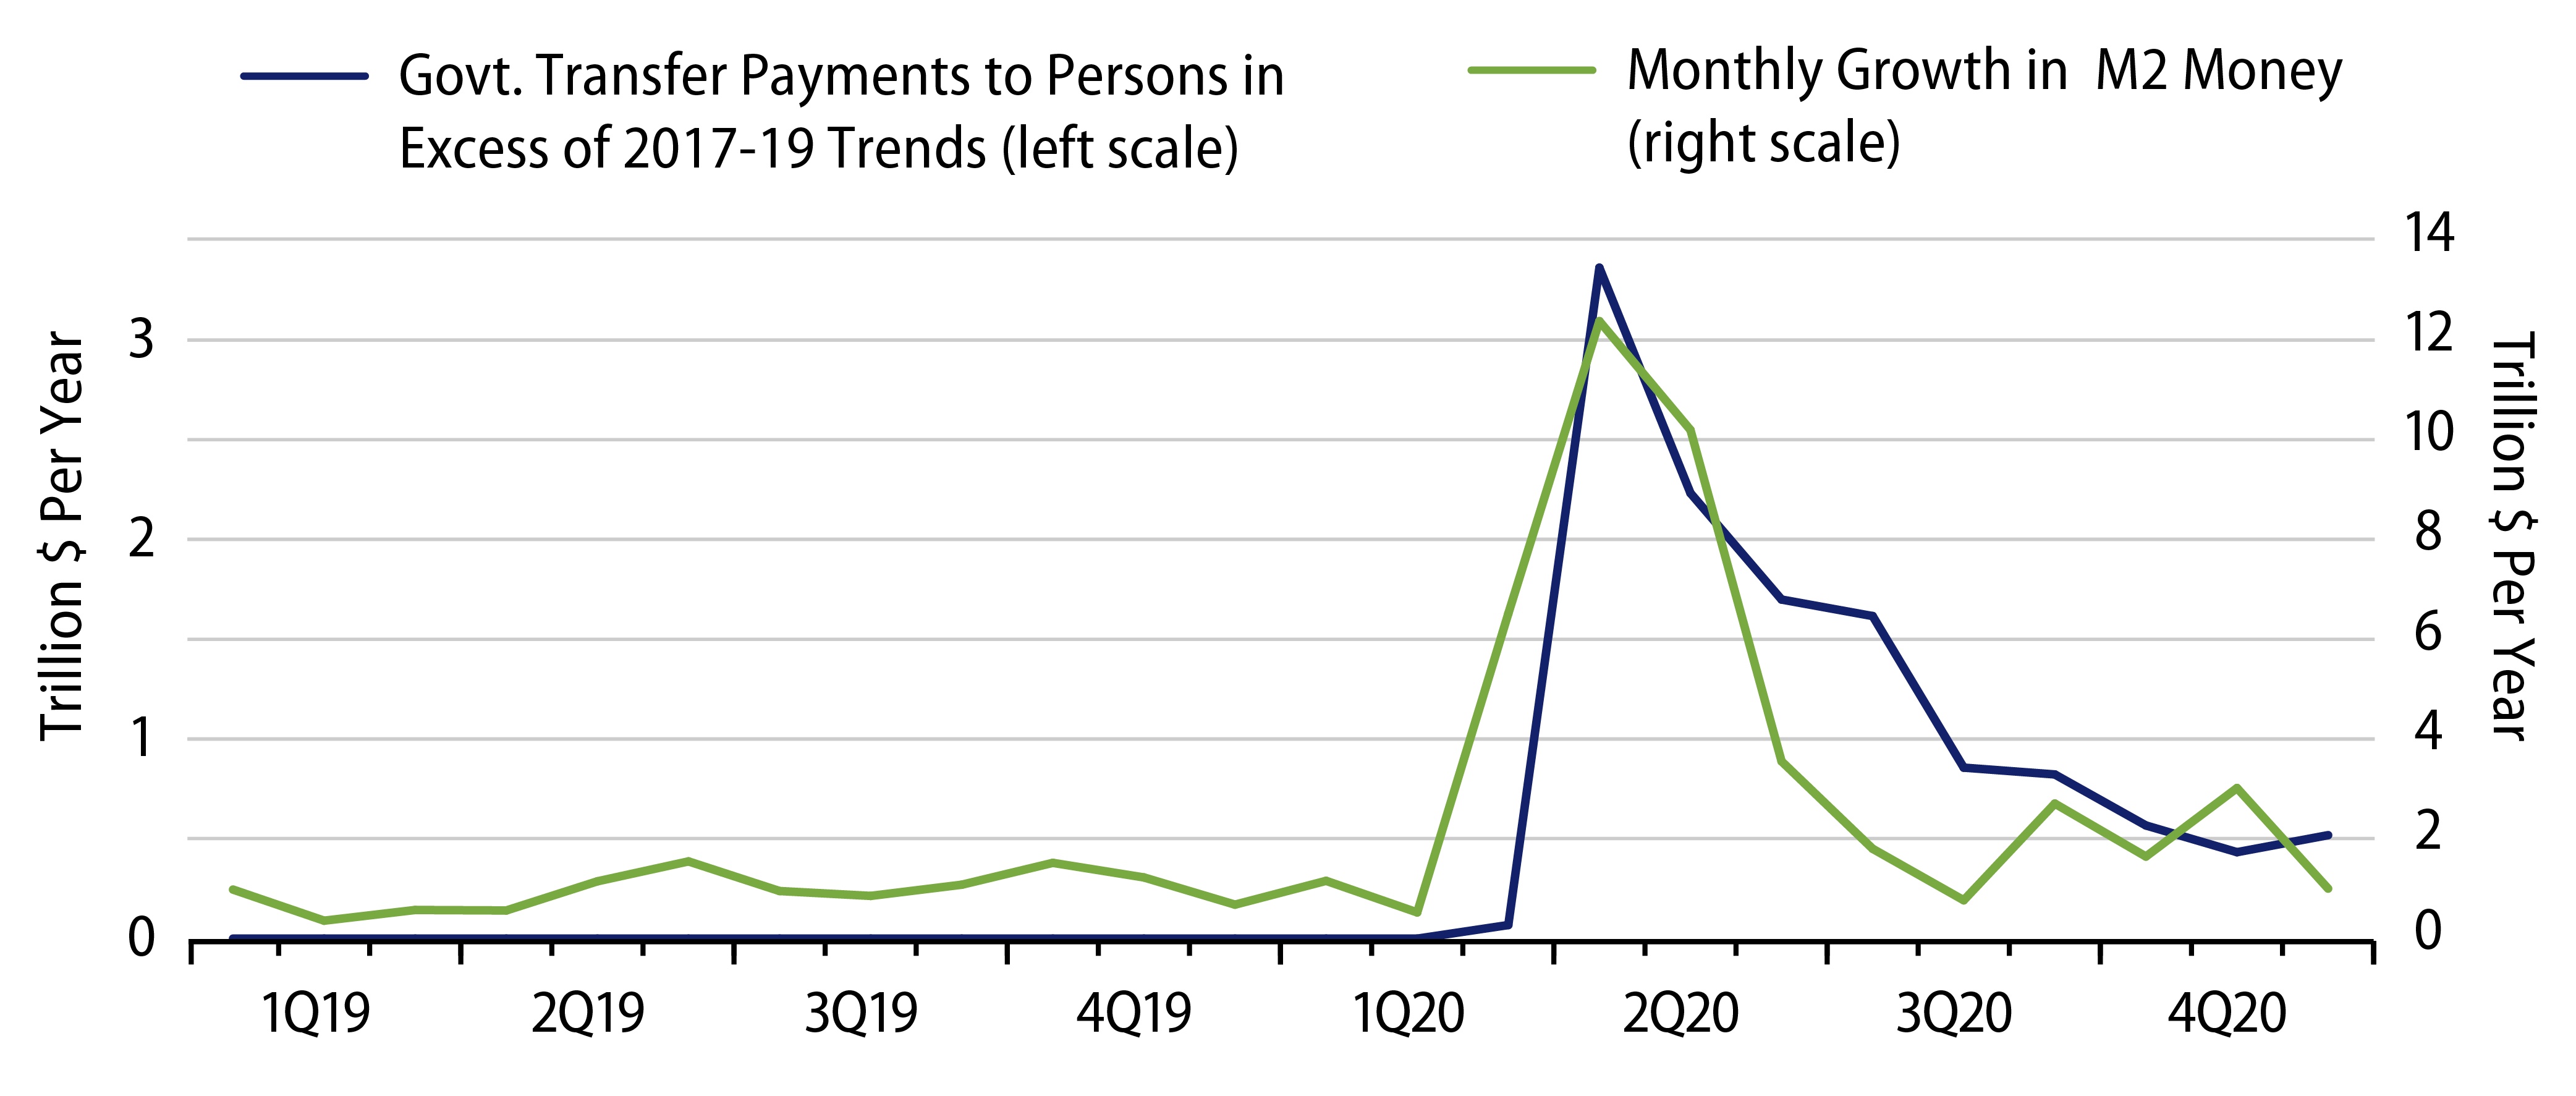
Individuals then “parked” these funds in bank deposits. Without getting into financial system complexities, a look at the facts makes this point forcefully. Exhibit 4 compares monthly changes in the money stock with monthly aid provided to households by the CARES Act.
They are perfectly in phase. M2 money expanded dramatically in April 2020, the very month when most CARES Act payments were remitted. CARES Act aid has since diminished, and M2 growth has as well. CARES Act payments continued through December 2020 at a positive rate,1 and M2 growth remained at higher rates in recent months than were seen prior to the March 2020 shutdown.
Keep in mind that Exhibit 4 shows only CARES Act aid going directly to households. Additional payments went to businesses, but are harder to measure on a monthly basis from available data.
What’s Not Different This Time
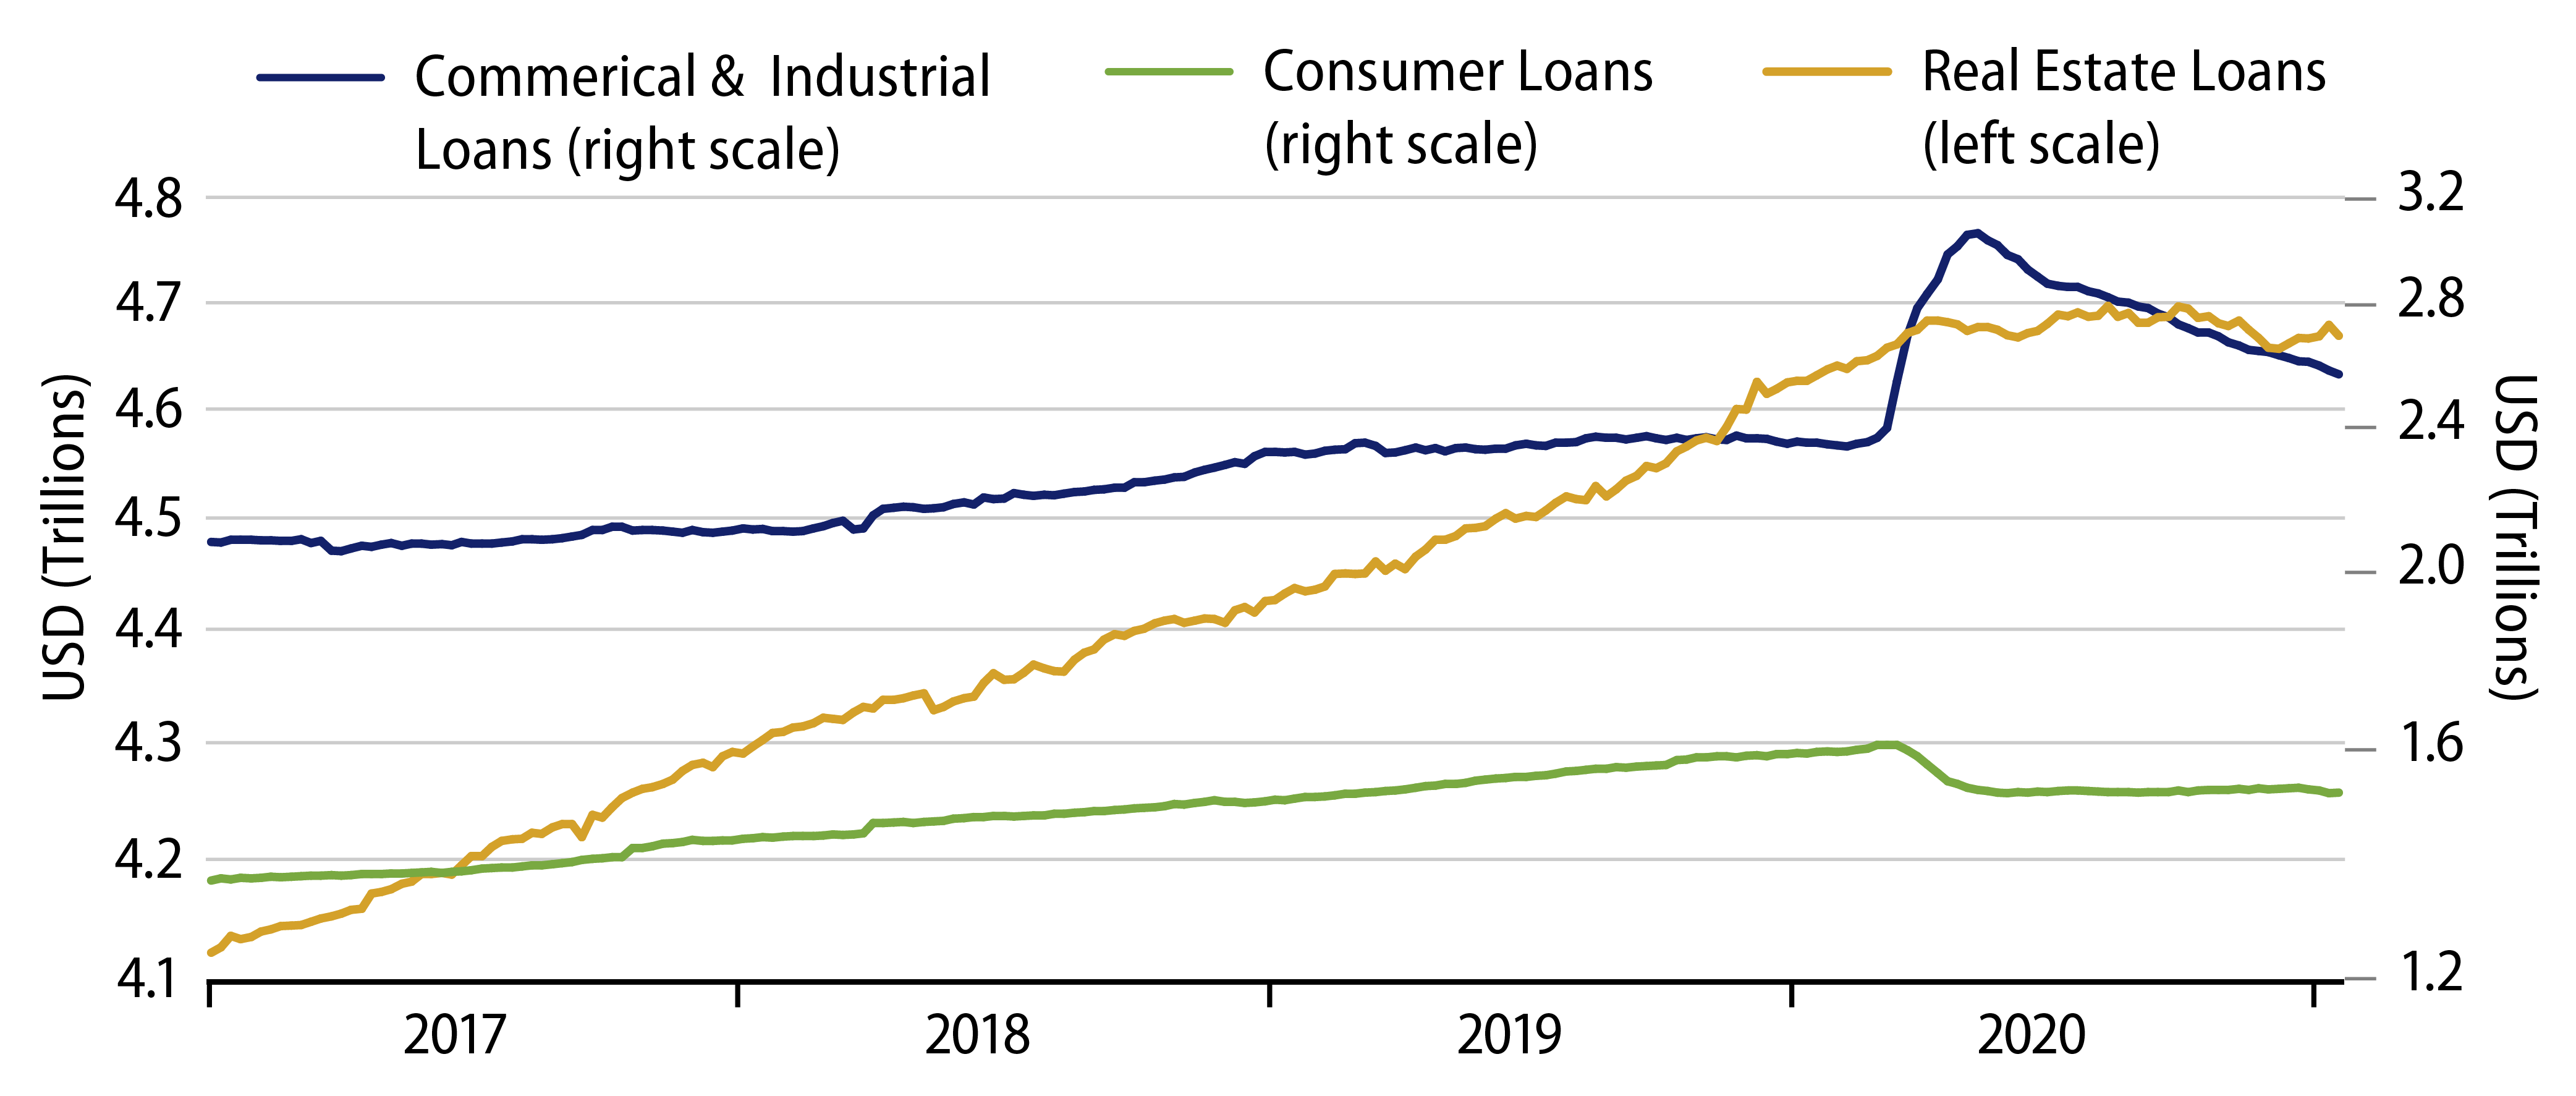
In effect, the money stock grew essentially without any complicity from bank lending. In fact, financial system activity levels are little different from what we saw post-GFC. Bank lending to businesses spiked briefly in March/April 2020, apparently as businesses drew down existing lines of credit to achieve an emergency cushion of operating cash. However, lending to other entities moved not a whit, and since April 2020, most of the business loans drawn down have been repaid.
It is possible that businesses are instead getting increased funding through corporate bond issuance and non-bank lenders. Consumers might be receiving non-bank funding as well. However, the banking system is not doing its part to keep these funds flowing. In the 1960s and 1970s, when consumers spent funds, businesses deposited the revenues, and banks loaned out the deposits to generate still more money and credit. That is not happening now, and this difference could become crucially important ere too long.
Presently, consumers and businesses have built up huge amounts of precautionary deposit balances. They are holding these funds rather than spending them. When and as shutdowns and pandemic concerns ease, consumers may want to spend some of those balances, working them down to non-precautionary levels.
Such spending will stimulate the economy and may serve to generate price pressures. The Fed could subvert those pressures via a timely contraction of its balance sheet. But even if it doesn’t, the spending surge and the pricing pressures won’t be sustained unless either banks begin to recycle proffered funds into further loan and deposit growth or else the federal government continues to shovel yet more funds into the system, in effect, a continued resort to MMT, not just an emergency one.
While the response of the money stock has been dramatically different this time from that of 2009 and after, other aspects of financial system behavior have not changed. The commercial banking system is not “recycling” Fed liquidity any more effectively presently than it did in the aftermath of the GFC. As noted in our 2018 paper, it is sustained inflations that push interest rates higher, and sustained inflations require sustained impetus from the central bank or elsewhere. Without a functioning, pervasively expansionary financial system, it will be most difficult to create sustained inflation in the DM world.
Note that the dysfunction we cite in bank lending activity is directly related to regulatory and macro-prudential initiatives pursued by the Fed, the federal government and global agencies. These same initiatives have served to improve banking system safety and made bank paper an attractive asset in our view. The unintended (unnoticed?) consequence of the initiatives has been a savaging of the efficacy of “traditional” monetary policy. (In contrast, MMT is as dangerous as ever.)
Meanwhile, as we have also remarked, previous declines in money velocity have continued unreversed. We take that to mean that previous increases in the demand for money—whether in 1983-1984, 2001-2002 or 2007-2009—were sustained. It is reasonable to describe the 2020 money growth as being precautionary balances willingly accumulated by individuals and businesses. However, it is not clear why these deposits will be depleted any more than other such bouts of deposit accumulation.
Output Gap?
As for the output gap, Exhibit 6 forcefully drives home our problems with it. As you can see there, growth in both the goods and construction sectors has rebounded to where shutdown-related declines have been fully reversed.
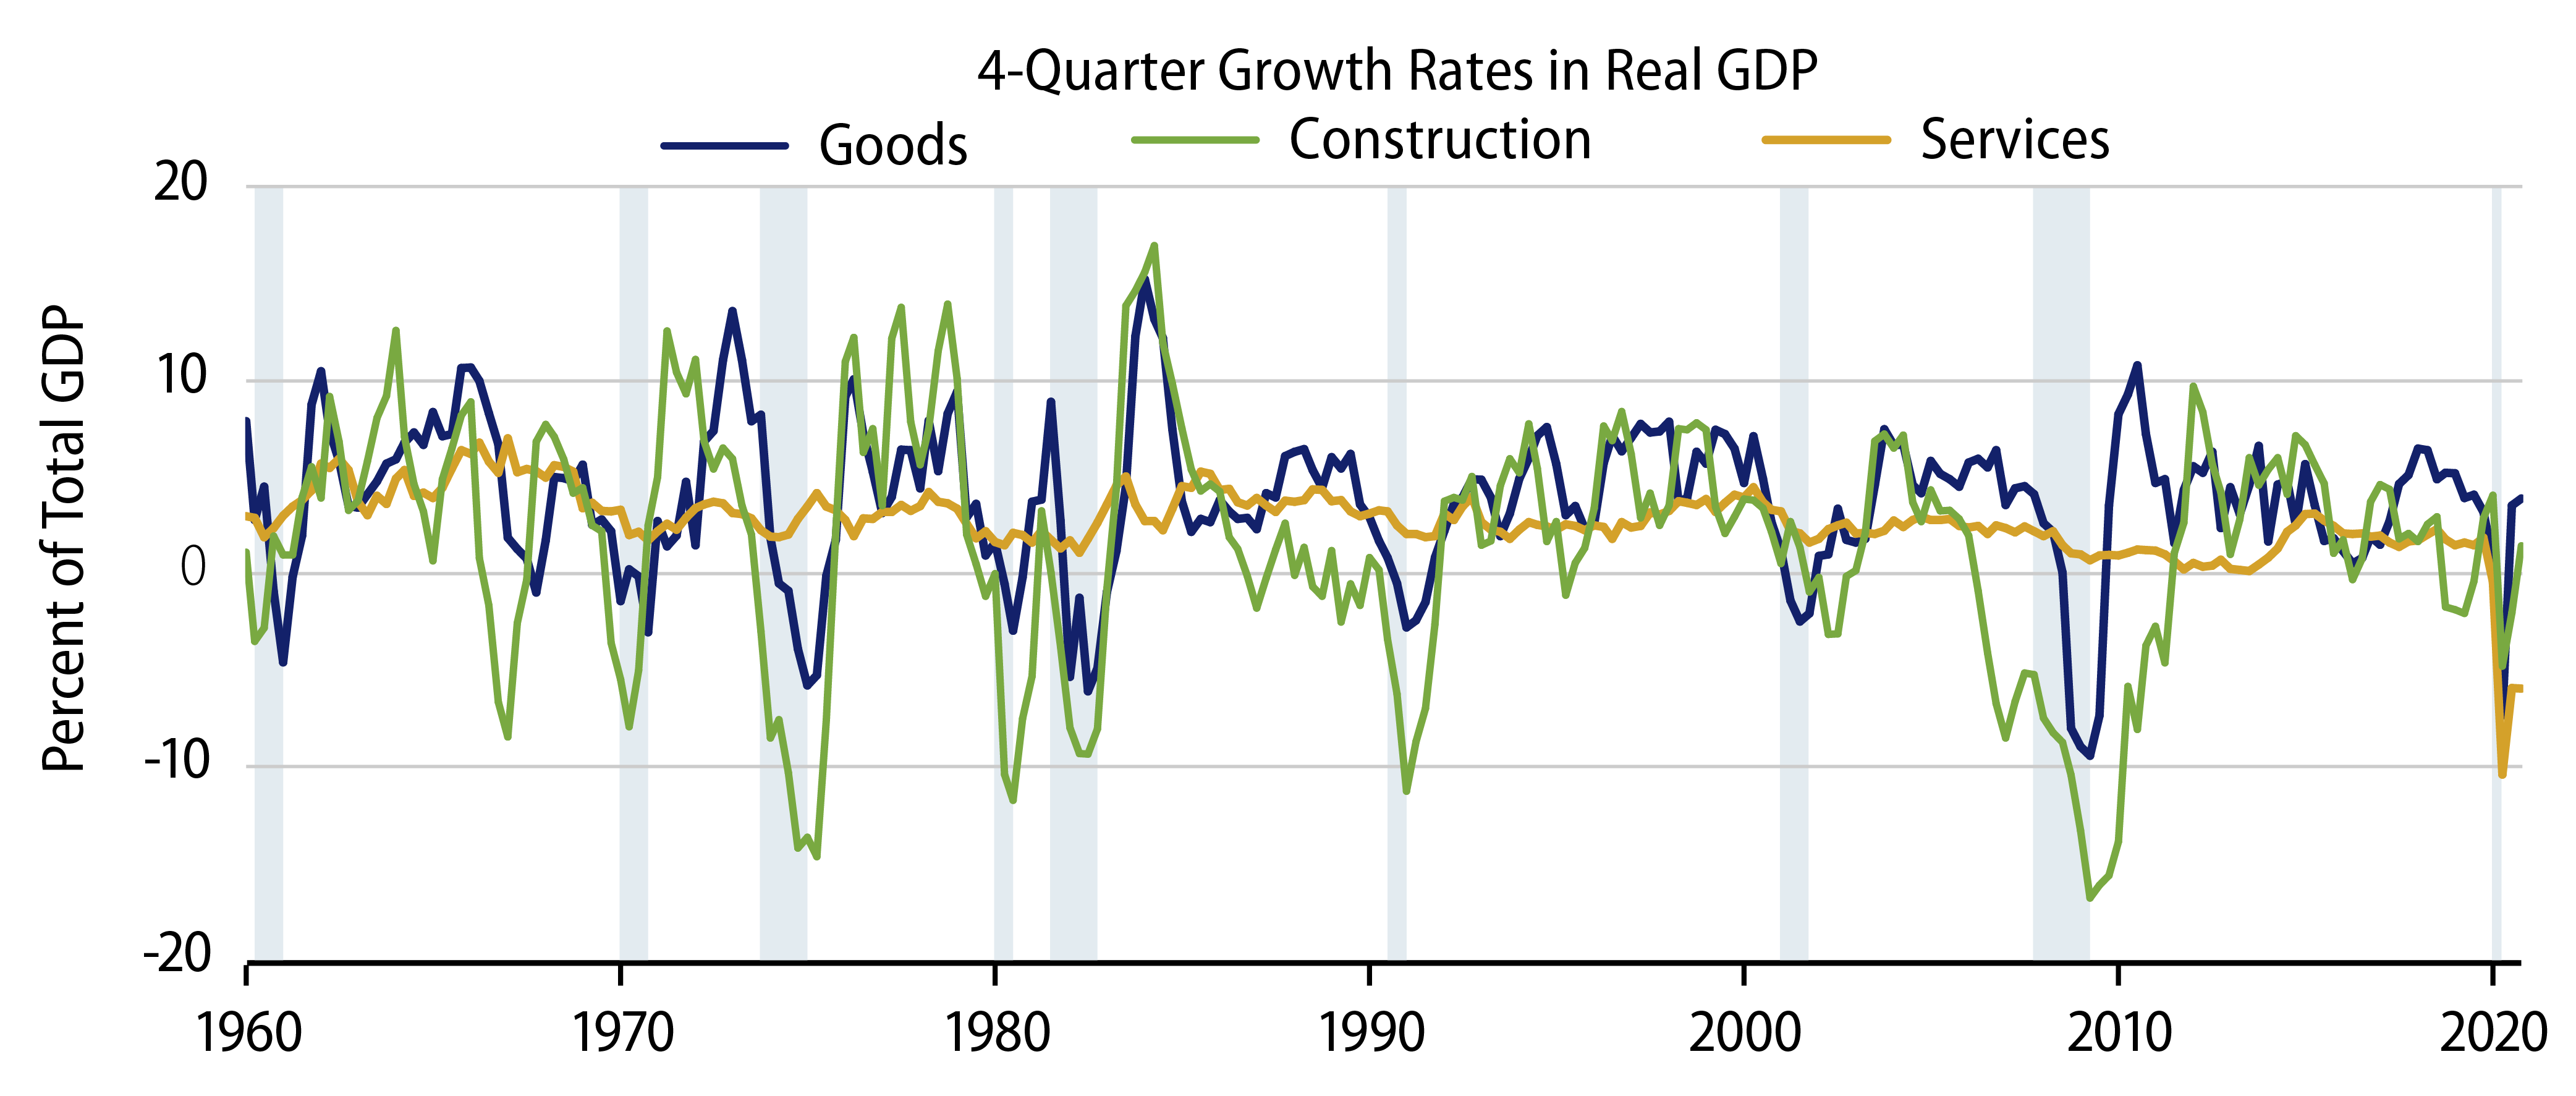
Combining the 1H20 recession with the 2H20 rebound, goods sector GDP was up 3.9% for all of 2020, above its 2.9% trend rate for the previous cycle. Construction GDP was up 1.8% 4Q20-over-4Q19, also above its -0.5% trend rate during the previous cycle.
In contrast, consider services GDP. Notice first that never in the last 60 years had services GDP shown negative growth over a four-quarter period until 2020. Second, the -6.0% decline seen from 4Q19 through 4Q20 compares to a +1.4% average growth rate over the previous cycle.
It is clear that whatever slack the US economy might evince presently, essentially all of it resides in the services sectors, and utilization of most of that slack is being prevented by continued shutdowns. Any meaningful increase in aggregate demand opposite shut-down service sectors is likely to result in immediate pricing pressures. And if and when service sectors are allowed to reopen, any slack remaining might quickly be used up.
The 2021 economy is dramatically different from anything we have previously seen coming out of a recession. Using output gap analysis to assess the chances of recession is at best misguided.
Conclusion
The workings of the banking system are little different from what we have seen in general over the post-GFC (and post-Basel) experience. This limits the effectiveness of monetary policy and, in our view, is the best reason to think that a run-up in inflation is not in the offing.
True, thanks to a lift from the CARES Act, Fed balance sheet expansion has finally elicited a response by the money stock. However, as yet, this money is being held rather than spent by households and businesses.
Previous deposit buildups by individuals never were spent. (The velocity did not rebound over 2000-2019.) Even if the present buildup should indeed prove different, with individuals seeking to work down precautionary deposits once pandemic protocols have lifted, the question arises as to whether any burst of spending can be sustained without a functional banking system to abet it.
We’ll admit to more concern about inflation presently than we felt either in 2009 or 2018. However, lots of things will have to go right (wrong) for an inflation resurgence to occur, and the Fed will have to sit by idly and let it happen, even after the pandemic has faded and the economy has fully recovered.
- Also, the reader might note that aid specifically mandated by the CARES Act ran out around October 2020. The continued aid shown in Exhibit 4 reflects continued unemployment assistance and related benefits that are provided for by previously existing federal law, aka “automatic stabilizers.” While these are not part of the CARES Act per se, they do reflect federal aid occurring in response to employment and income losses triggered by the pandemic and related economic shutdowns, and so they are a relevant aspect of the aid depicted in the chart.