

Central Banks: The Slow Road to “Normal”
Let thy step be slow and steady, that thou stumble not. ~Tokugawa Ieyasu
Executive Summary
- The Fed, ECB and BoJ are each at different stages of their balance sheet normalization processes, which broadly map to each country’s respective progress in meeting their key policy goals.
- We believe that the Fed’s balance sheet normalization will likely serve as a general template for the ECB and BoJ.
- Most estimates of the terminal size of the Fed’s balance sheet range from $2.5-$3.0 trillion.
- Overall we believe that the ECB is likely to stay accommodative for the foreseeable future with a projected balance sheet size of €4 trillion at the end of 2020.
- The BoJ is expected to continue with extremely easy monetary policy for a prolonged period given slower-than-expected developments on inflation.
- We believe the Fed, ECB and BoJ balance sheets will remain substantial for a prolonged period and that they share the common goal of targeting short-term interest rates as their main policy tool.
- Western Asset believes that while the overall impact on markets from balance sheet normalization will be limited, differences in timing and composition present investment opportunities.
In response to the great financial crisis that culminated in 2008, central banks around the world sprang into action to provide liquidity and to calm markets with large-scale asset purchases. Now, as the world economy stabilizes a decade later, the three largest central banks—the US Federal Reserve (Fed), European Central Bank (ECB) and Bank of Japan (BoJ)—are in the process of removing the extraordinary accommodation that bolstered markets. This represents unchartered territory for investors as the effects of the central banks’ large balance sheets, and the efforts to unwind them, have yet to unfold.
In this paper, we take a closer look at current market anxiety with respect to the Fed, ECB and BoJ processes of balance sheet “normalization,” and how this grand reversal could impact asset prices. We examine this topic by addressing the following questions:
- Where are the Fed, ECB and BoJ in their normalization processes?
- How do we expect the normalization processes to evolve in the future?
- What is the potential market impact?
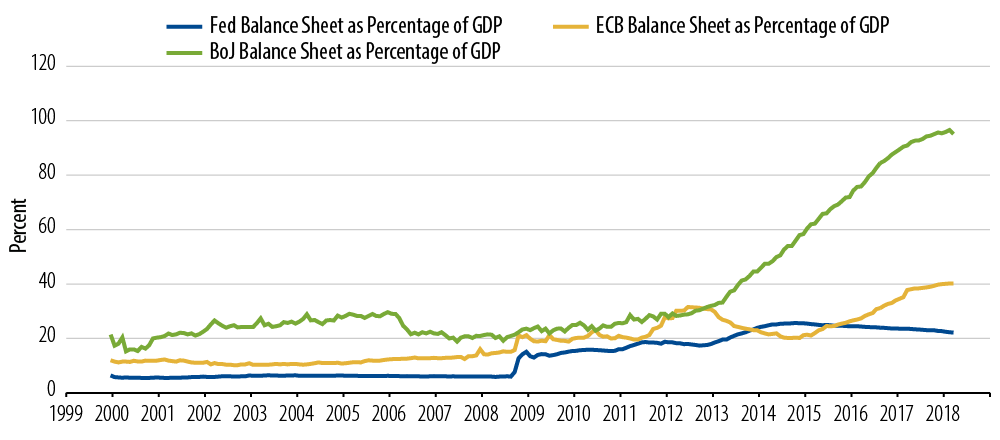
Total Assets of Major Central Banks as a Percentage of Respective GDP
Where Are the Fed, ECB and BoJ in Their Normalization Processes?
The Fed, ECB and BoJ are each currently at different stages of their respective balance sheet normalization processes, which broadly map to each country’s respective progress in meeting the key policy goals of achieving sustained economic recovery and (more importantly for the ECB and BoJ) reaching their mandated inflation objectives.
The Fed is the most far along in this process, announcing the start of its balance sheet normalization in September 2017. Under this process the Fed will reduce its monthly US Treasury (UST) and MBS purchases by a maximum of $6 billion and $4 billion, respectively, and will raise these caps every three months by $6 billion and $4 billion, until they reach $30 billion and $20 billion, respectively. If roll-off amounts exceed these caps in any given month, the Fed will reinvest the difference.
The ECB has similarly begun its gradual withdrawal of monetary stimulus, with the bond-buying program being reduced from €60 billion to €30 billion per month starting from January 2018. However, in contrast with the Fed, the ECB will continue to reinvest proceeds from its bond purchases as they mature over an “extended period of time” beyond the actual end of the bond purchase program.
Having previously embarked on a bond-buying program similar to those of the Fed and ECB (referred to as “quantitative and qualitative easing” or QQE), the BoJ adopted a new strategy in September 2016 to boost growth and achieve its inflation objective: “yield curve control” (YCC). The aim of this policy was to keep 10-year Japanese government bond (JGB) yields at 0% and widen the gap between those and longer-term yields as a means to encourage bank lending.
How Do We Expect the Normalization Processes to Evolve in the Future?
We believe that the Fed’s experience of balance sheet normalization in terms of its gradual and transparent approach will likely serve as a general template for the ECB and BoJ. Part of this gradual approach is likely to be motivated by concerns that it may be difficult for central banks to reduce the size of their balance sheets quickly without negatively affecting financial markets. In addition, looking forward, central banks may face a decline in the natural long-term rate of interest whereby policy rates could remain at much lower levels than they have historically, implying that future monetary policy may have to rely more on balance sheet policies and less on interest rates to provide accommodation in response to recessions.
In July 2017, Western Asset published a paper on the Fed balance sheet entitled Fed Balance Sheet Normalization: When Boring Is Good. In that paper we argued “we expect the Fed to take a cautious, gradual and well communicated approach to reducing its purchases”. This was consistent with the subsequent announcement of the mechanics of the plan whereby the monthly run-off of USTs can be projected in advance. This gradual and transparent approach is consistent with the Fed’s intention to continue to use the fed funds rate as the main policy setting tool while maintaining some degree of balance sheet flexibility. Most estimates of the terminal size of the Fed’s balance sheet range from $2.5-$3.0 trillion (approximately 15% of GDP), in line with the Fed’s projection of its balance sheet reaching this range between 2020 and 2021.
The projected size and composition of the ECB’s balance sheet has a number of permutations depending on assumptions around several variables: the date when asset purchases will stop, the country composition of government bond purchases and the overall split of purchases between government and corporate bonds.
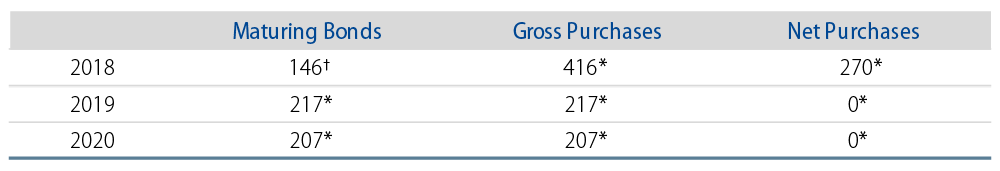
Our projections for the ECB’s balance sheet are based on our assumptions that monthly asset purchases will stop by the end of 2018 and that the ECB will continue to reinvest maturing securities well beyond the start of the rate cycle which we expect to commence in mid-2019. Asset purchases will be solely focused on the reinvestment of maturing securities across the four parts1 of the asset purchase program (APP). With a high level of securities maturing, the reinvestment of asset purchases (Exhibit 2) should ensure a degree of ongoing support for yields.
QE Reinvestments (Euro in Billions)
Overall we believe that the ECB monetary policy stance is likely to stay accommodative for the foreseeable future with a projected balance sheet size of €4 trillion at the end of 2020 and only modest declines thereafter. Given the significant amount of ongoing excess liquidity, the deposit rate will remain the primary policy tool for the ECB to meet its inflation objective.
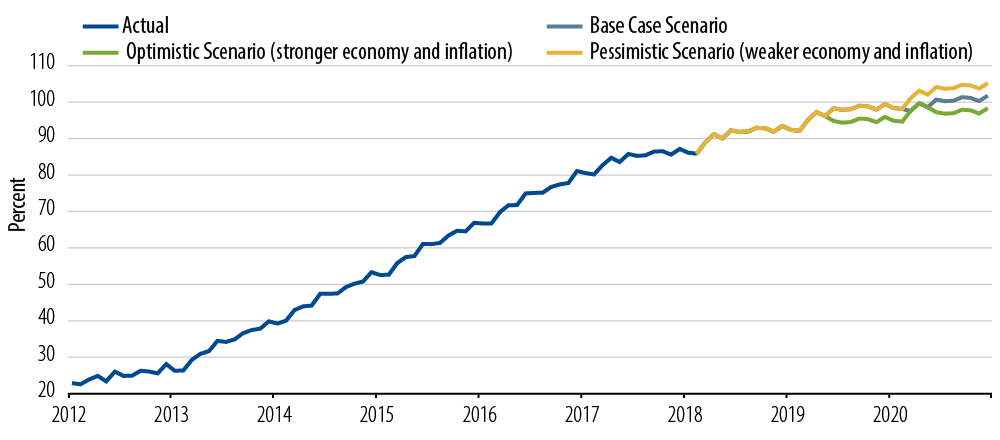
The BoJ is at a different stage in its balance sheet normalization. The shift in policy from QQE to YCC reflects the need for the BoJ to continue with extremely easy monetary policy for a prolonged period given slower-than-expected developments on inflation and a belief they can be achieved in a more sustainable way through YCC. With the focus of policy now towards targeting a level of yields for 10-year JGBs rather than the outright size of the balance sheet, the average annual increase in the BoJ’s balance sheet has fallen to ¥44 trillion compared to ¥80 trillion previously. Looking forward, the size of the BoJ’s balance sheet will depend on assumptions made about growth and inflation and the potential impact these will have on 10-year yields.
In Exhibit 3 we consider three different scenarios:
- Base case2: steadily rising growth and inflation
- Optimistic case3: stronger growth and inflation
- Pessimistic case4: weaker growth and inflation
BoJ’s Balance Sheet (Monetary Base as a % of Nominal GDP)5
What Is the Potential Market Impact?
Western Asset’s view is that ultimately asset prices will be determined by underlying fundamentals. However, in the short term we acknowledge that valuations can be distorted by the balance sheet policies of central banks. Combining both factors into our analysis, Western Asset is focused on several investment themes.
We believe the supply of USTs and MBS to the market from the Fed’s balance sheet normalization will be manageable. The run-off schedule is very gradual and we believe it gives the market ample time to adjust. In our estimates, the UST and MBS supply created by the Fed’s program would add only about 2% to the current balances outstanding, but this supply could be even lower if yields rise in line with market expectations and prepayments slow. By contrast, should yields decline and the MBS run-off exceed the cap due to faster prepayment speeds, the Fed will likely reinvest the excess, providing support to the MBS sector. Overall our view on the level of UST yields is influenced more by our analysis of growth and inflation and what this implies for the Fed’s interest rate policy. Western Asset remains of the view that despite modest upward revisions to growth from recently announced tax changes, inflation pressures remain benign and this backdrop does not support aggressive Fed rate hikes. Given that and our view that USTs will remain a diversifier to credit exposures in portfolios, we continue to advocate a long US duration stance.
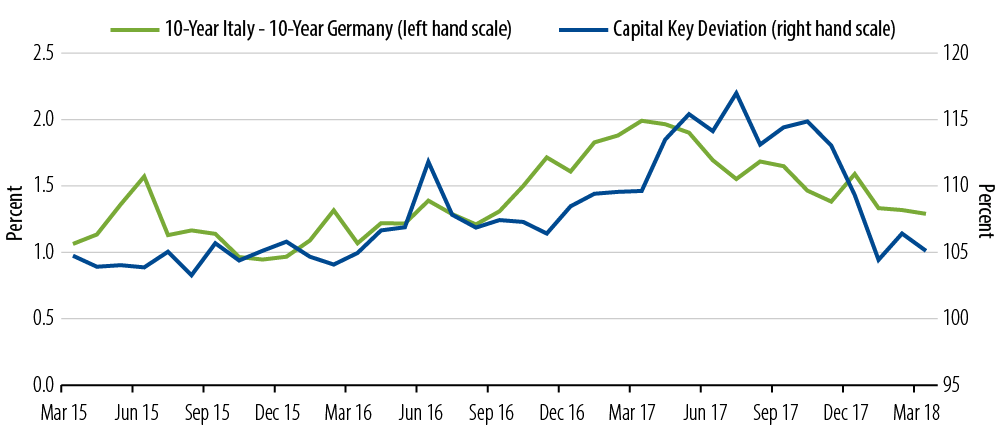
While the ECB’s balance sheet is likely to remain substantial for the foreseeable future and the sequencing of policy normalization has been well telegraphed, there are potential investment implications that could arise from changes in the balance sheet composition. Given the support provided to both periphery and corporate bond markets since the APP (asset purchase programmes) began, the key issue is the distribution of that reinvestment and the flexibility that the ECB allows itself once net purchases are completed. A continuation (or acceleration) of recent trends should ensure periphery and corporate spreads remain contained, if not tighten. Monitoring of these developments will thus be key as the year progresses. In our opinion, the ECB will want to retain maximum flexibility, allowing some deviation from the capital key weights for the PSPP (public sector purchase programme) and not be tied to reinvestment in the maturing asset class. France, Italy and Spain have been the main beneficiaries of this flexibility at the expense of the smaller (and newer) eurozone members. While ECB President Mario Draghi is correct that over the course of the APP the ECB has adhered to capital key weights, the degree of variation has at times been large, and mainly driven by market conditions. The ECB has responded to any significant widening in periphery spreads by increasing purchases relative to capital key weights in subsequent months (Exhibit 4).
BTP Spreads and Capital Key Deviation
Similarly, flexibility should help to underpin corporate bond spreads. Since the halving of APP purchases at the beginning of the year, PSPP purchases have declined 63% against their average run rate for the prior 18 months, while CSPP (corporate sector purchase programme) purchases have declined only 20%, a clear switch in emphasis towards net CSPP purchases.
Japan
In adopting the YCC policy, the BoJ shifted its policy target away from a quantity-based measure (amount of JGBs purchased) to a level (0% “cap”) on 10-year JGB yields and the overnight policy rate. Under the BoJ’s YCC policy with 10-year JGB yields effectively pinned, we expect that, mechanistically, a scenario of higher inflation expectations will drive real interest rates lower. In turn, lower real interest rates should help narrow the output gap and boost inflation over time.
This process will be pro-cyclical6 and as long as the “cap” on 10-year JGBs remains, we expect longer-dated nominal JGB yields to rise. Having a steeper curve beyond 10 years is helpful for bank profitability. We believe this will make the BoJ’s eventual exit strategy easier as the long end of the curve will have already risen to reflect stronger growth and higher inflation. As a result, the bulk of the adjustment to yields will come in shorter-dated maturities. Putting these together supports our investment view that “breakeven inflation” should widen and that the yield curve should steepen further beyond 10-year maturities. With respect to the potential currency impact, we expect that lower real interest rates will keep the Japanese yen under some modest depreciation pressure relative to the US dollar and euro even though the balance sheet is likely to expand at a slower pace going forward.
Prior to switching to YCC, the BoJ’s balance sheet was increasing by around ¥80 trillion per year since QQE was expanded in October 2014. This compares to estimates of around ¥50 trillion per year under YCC, depending on the assumptions about the level of global yields. Previously, the size of the BoJ balance sheet relative to the Fed’s balance sheet was an important driver of USD/JPY. This relationship has largely broken down since late 2016 despite an initial sell-off in the Japanese yen post the YCC announcement (which caused the yen to weaken as domestic bond investors allocated to overseas bond markets in search of yield). Although this is not our base case, a scenario of higher global yields, with its associated faster pace of BoJ balance sheet expansion, could see this relationship re-established and potentially act as a diversifier to overweight UST duration positions.
A Final Word
Ultimately, we believe that the Fed, ECB and BoJ balance sheets will remain substantial for a prolonged period and that the normalization processes—which we expect to continue in a gradual and well-telegraphed manner—are unlikely to have a significant impact on markets.
The Fed, ECB and BoJ are all at different stages in the normalization process. While this broadly reflects progress towards achieving their respective policy objectives, these major central banks share the common goal of seeking to target short-term interest rates as their main policy tool. That stated, there are obvious differences in both timing and composition and we believe these differences should be the focus for investors as they look for investment opportunities.
Endnotes
- Asset-Backed Securities Purchase Programme (ABSPP), Third Covered Bond Purchase Programme (CBPP3), Corporate Sector Purchase Programme (CSPP), Public Sector Purchase Programme (PSPP).
- Base case assumptions: YCC unchanged until end of 1Q20 and then increase target yield from 0 to 25 basis points (bps). BoJ balance sheet to expand by ¥45 trillion per year on average until 1Q20 then ¥25 trillion thereafter.
- Optimistic case assumptions: YCC unchanged until end of 2Q19 and then increase target yield from 0 to 25 bps. BoJ balance sheet to expand by ¥45 trillion per year on average until 2Q19 then ¥25 trillion thereafter.
- Pessimistic case assumption: YCC unchanged until end of 2Q19 and then lower target yield from 0 to -25 bps. BoJ balance sheet to expand by ¥45 trillion per year on average until 2Q19, and by the same amount thereafter.
- We assume that nominal GDP will grow by 2% per year.
- YCC is pro-cyclical in nature: when global yields rise, the BoJ has to defend the 0% “cap” by buying JGBs; conversely, when global yields rally, the BoJ has to buy fewer JGBs.