Municipals Post Near-Record Losses
The municipal market closed out 2022 on a negative note, with municipal mutual fund outflows having a record year of net outflows. Despite outperformance of the municipal asset class versus high-grade fixed-income, the value of the municipal tax exemption extended at higher nominal rates.
This Week in Munis: Year in Review
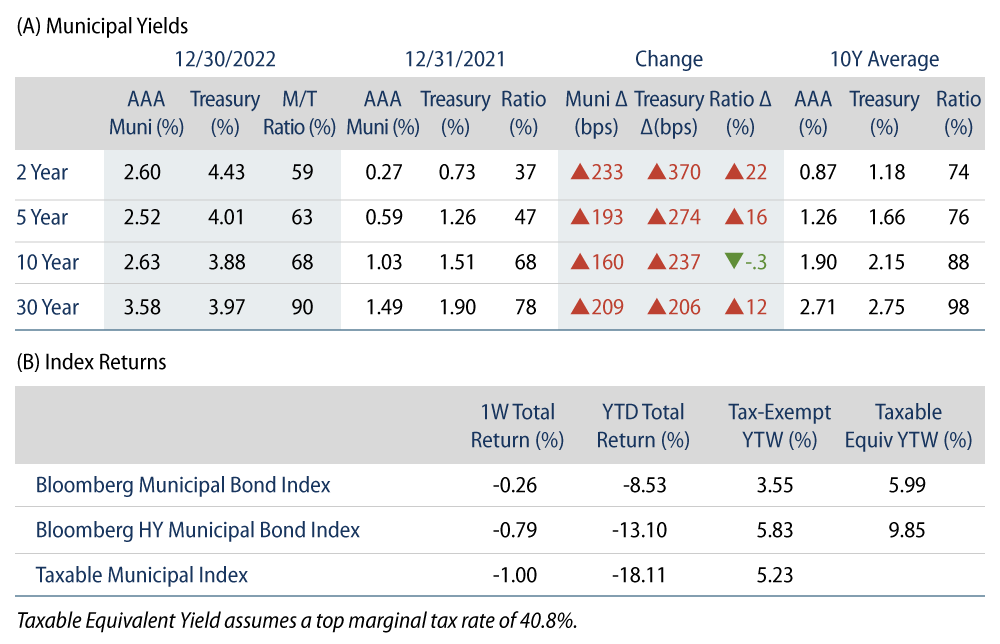
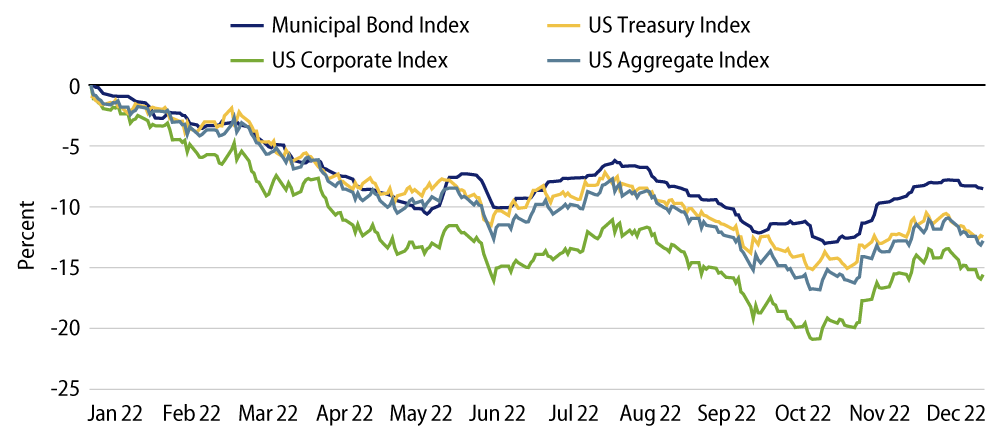
Last year marked one of the worst years on record for the municipal market, as the investment-grade Bloomberg Municipal Index returned -8.53% in 2022, the worst return in the past 20 calendar years and the third worst calendar-year return in the index’s history. AAA municipal yields moved 1.60%-2.33% higher across the curve, as elevated inflation and the Fed’s policy response contributed to higher interest rates. 30-year yields moved higher in sympathy with Treasuries, while AAA municipals outperformed Treasuries in short and intermediate maturities.
In line with prior Fed tightening cycles, municipals outperformed most other fixed-income asset classes. The Bloomberg Municipal Index fared better than other major fixed-income asset classes in 2022, as the Bloomberg U.S Treasury Index Returned -12.46%, the Bloomberg US Corporate Index returned -15.76%, and the US Aggregate returned -13.01%.
Technicals: Weakness Driven by Record Municipal Mutual Fund Outflow Cycle
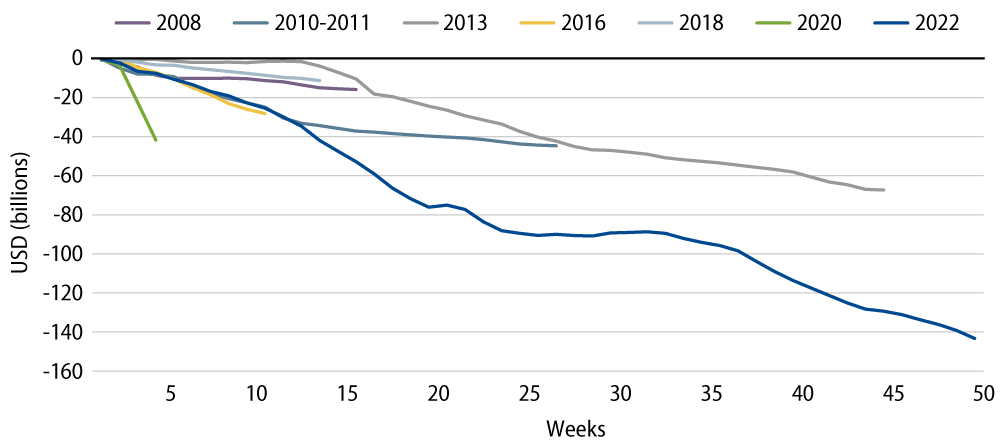
Fund Flows: Lipper reporting municipal mutual funds recorded $122 billion of net outflows in 2022. Long-term funds recorded $57 billion of outflows, intermediate funds recorded $34 billion of outflows and high-yield funds recorded $20 billion of outflows. The stretch of outflows lasted 46 of the last 50 weeks of the year, surpassing the amount ($67 billion) and length (44 weeks) of the prior taper tantrum outflow cycle in 2013.
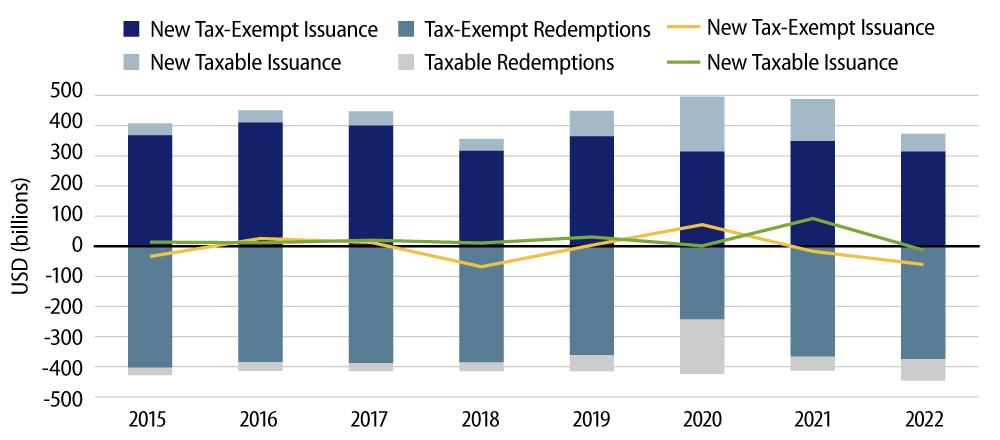
Supply: The market impact of fund outflows was partially alleviated by negative net supply conditions. The municipal market recorded $373 billion of new-issue volume in 2022, down 23% from the prior year. Tax-exempt issuance declined 9% year-over-year (YoY) to $313 billion. Taxable issuance declined 57% YoY to $59 billion as the higher rate environment deteriorated refinancing economics. In addition to lower overall volume, market redemptions in the form of refunded debt and maturities reached the highest level in a decade, contributing to net supply of -$73 billion during the year (-$61 billion of net tax-exempt supply).
Fundamentals: Strong Credit Trends Were Bolstered by Robust Tax Collections
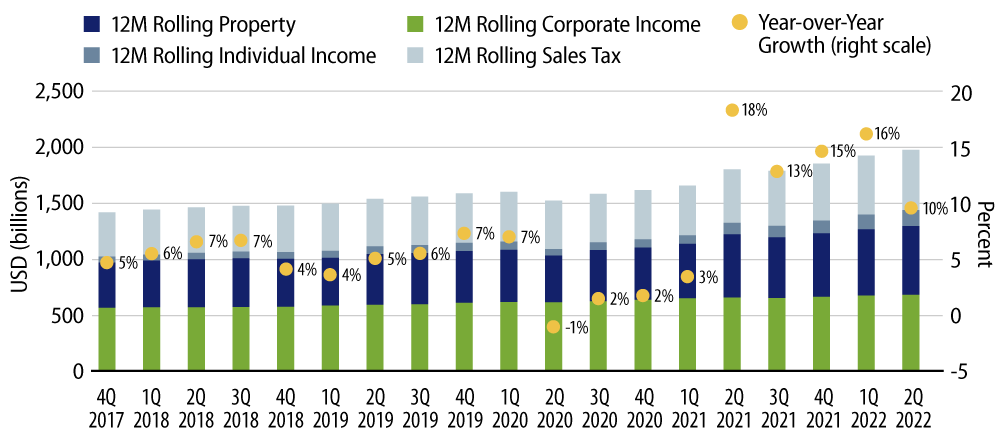
State and local tax collections continue to be supported by favorable labor and housing market conditions. June 2022 four-quarter trailing state and local tax collections coincided with fiscal 2022 for most municipalities and reached $2.0 trillion, up 10% from the prior record-setting year. The largest sources of state and local revenues, which are individual income tax, sales tax and property tax collections, were higher by 9%, 12% and 4% YoY, respectively.
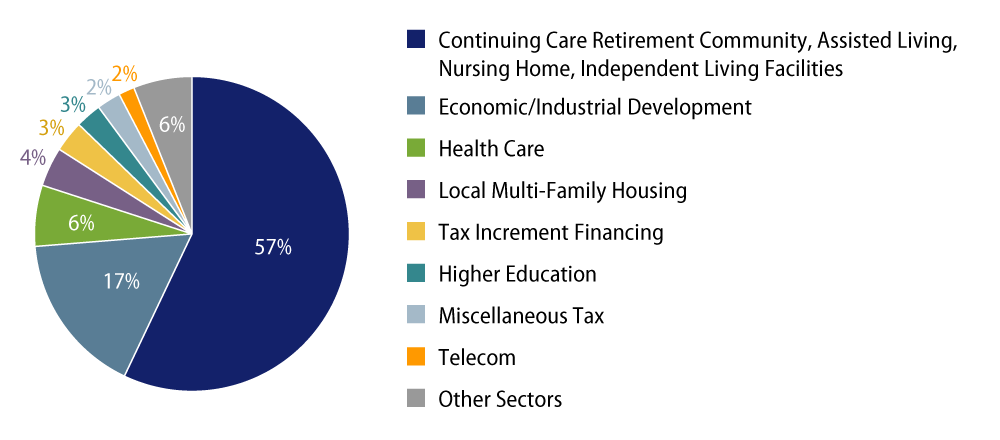
Municipal defaults remained limited and contained to select high-yield sectors during the year. Through December 15, the municipal market recorded 47 first-time debt service payment defaults totaling $1.3 billion, down from the 57 defaults that totaled $1.8 billion in 2021, according to Bloomberg. Similar to recent years, more than 50% of outstanding defaulted par was driven by high-yield continuing care and retirement community, assisted living, and health care sectors.
Valuations: More Compelling at Higher Rates
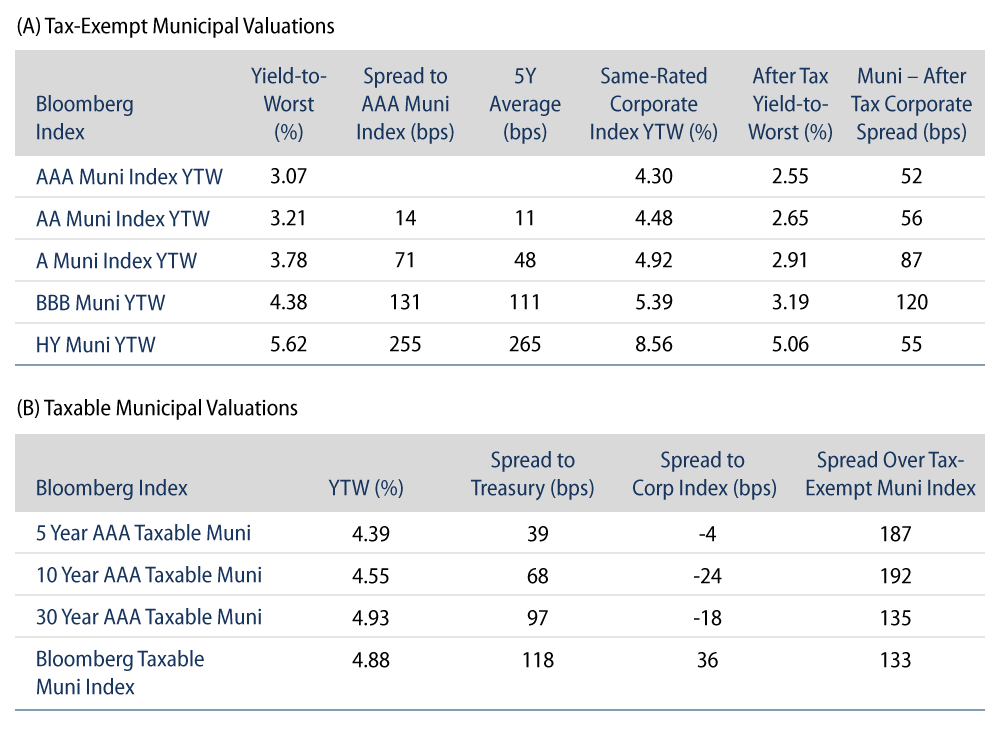
While fixed-income outperformance often leads to less attractive relative valuations, the tax-exempt municipal asset class is unique in the fact that the tax-exemption becomes increasingly valuable at higher rates.
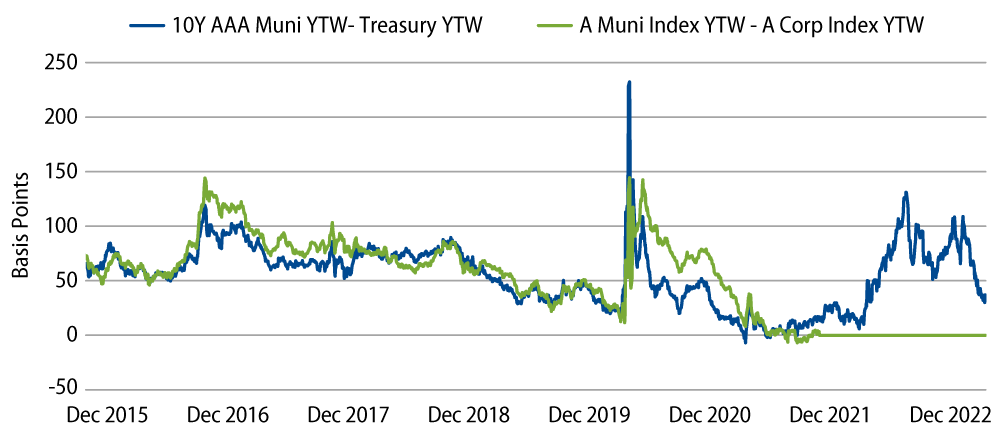
Consider the yields of the 10-year AAA municipal bond versus that of the 10-year AAA Treasury bond. At the end of 2021, the 10-year AAA municipal yield offered 1.03% while the 10-year Treasury yield of 1.51% offered just 0.89% after the top effective federal tax rate of 40.8%. A top taxpayer was just 14 bps better off in the tax-exempt security. During 2022, the municipal yield moved 1.60% higher to 2.63% while the Treasury yield moved 2.37% higher to 3.88% (2.30% after taxes). Despite the municipal outperformance, the after-tax relative value has more than doubled from 14 bps at the start of the year, to 33 bps at 2022 year-end.
Moving down the credit spectrum, a similar dynamic can be observed. At the beginning of the year, the Bloomberg A Municipal Index yield of 1.27% offered 6 bps less yield than the Bloomberg A Corporate Index yield of 1.33% (after taxes). During the year, the A Muni Index yield moved 2.67% higher to 3.94%, while the A Corporate Index yield moved 3.96% higher to 5.23% (or 3.09% after taxes). Despite the municipal outperformance, the after-tax relative value improved from -6 bps at the start of the year to 84 bps by year-end as the value of the municipal tax exemption extended in the higher rate environment.
While it has undoubtedly been a challenging year across fixed-income asset classes considering the market volatility, muni outperformance versus other fixed-income asset classes underscores the value of municipals as part of the ballast of a fixed-income allocation, particularly for investors subject to high tax rates. We believe this value proposition, along with more attractive relative valuations, will attract demand into the asset class in 2023, particularly in an environment where inflation and interest-rate volatility stabilize.