skip navigation
Blog

Stay up to date on timely topics and market events. Subscribe to our Blog now.

MARKETS
12 October 2022
Weekly Municipal Monitor—Third Quarter Review
By Robert E. Amodeo, CFA, Sam Weitzman

Stay up to date on timely topics and market events. Subscribe to our Blog now.

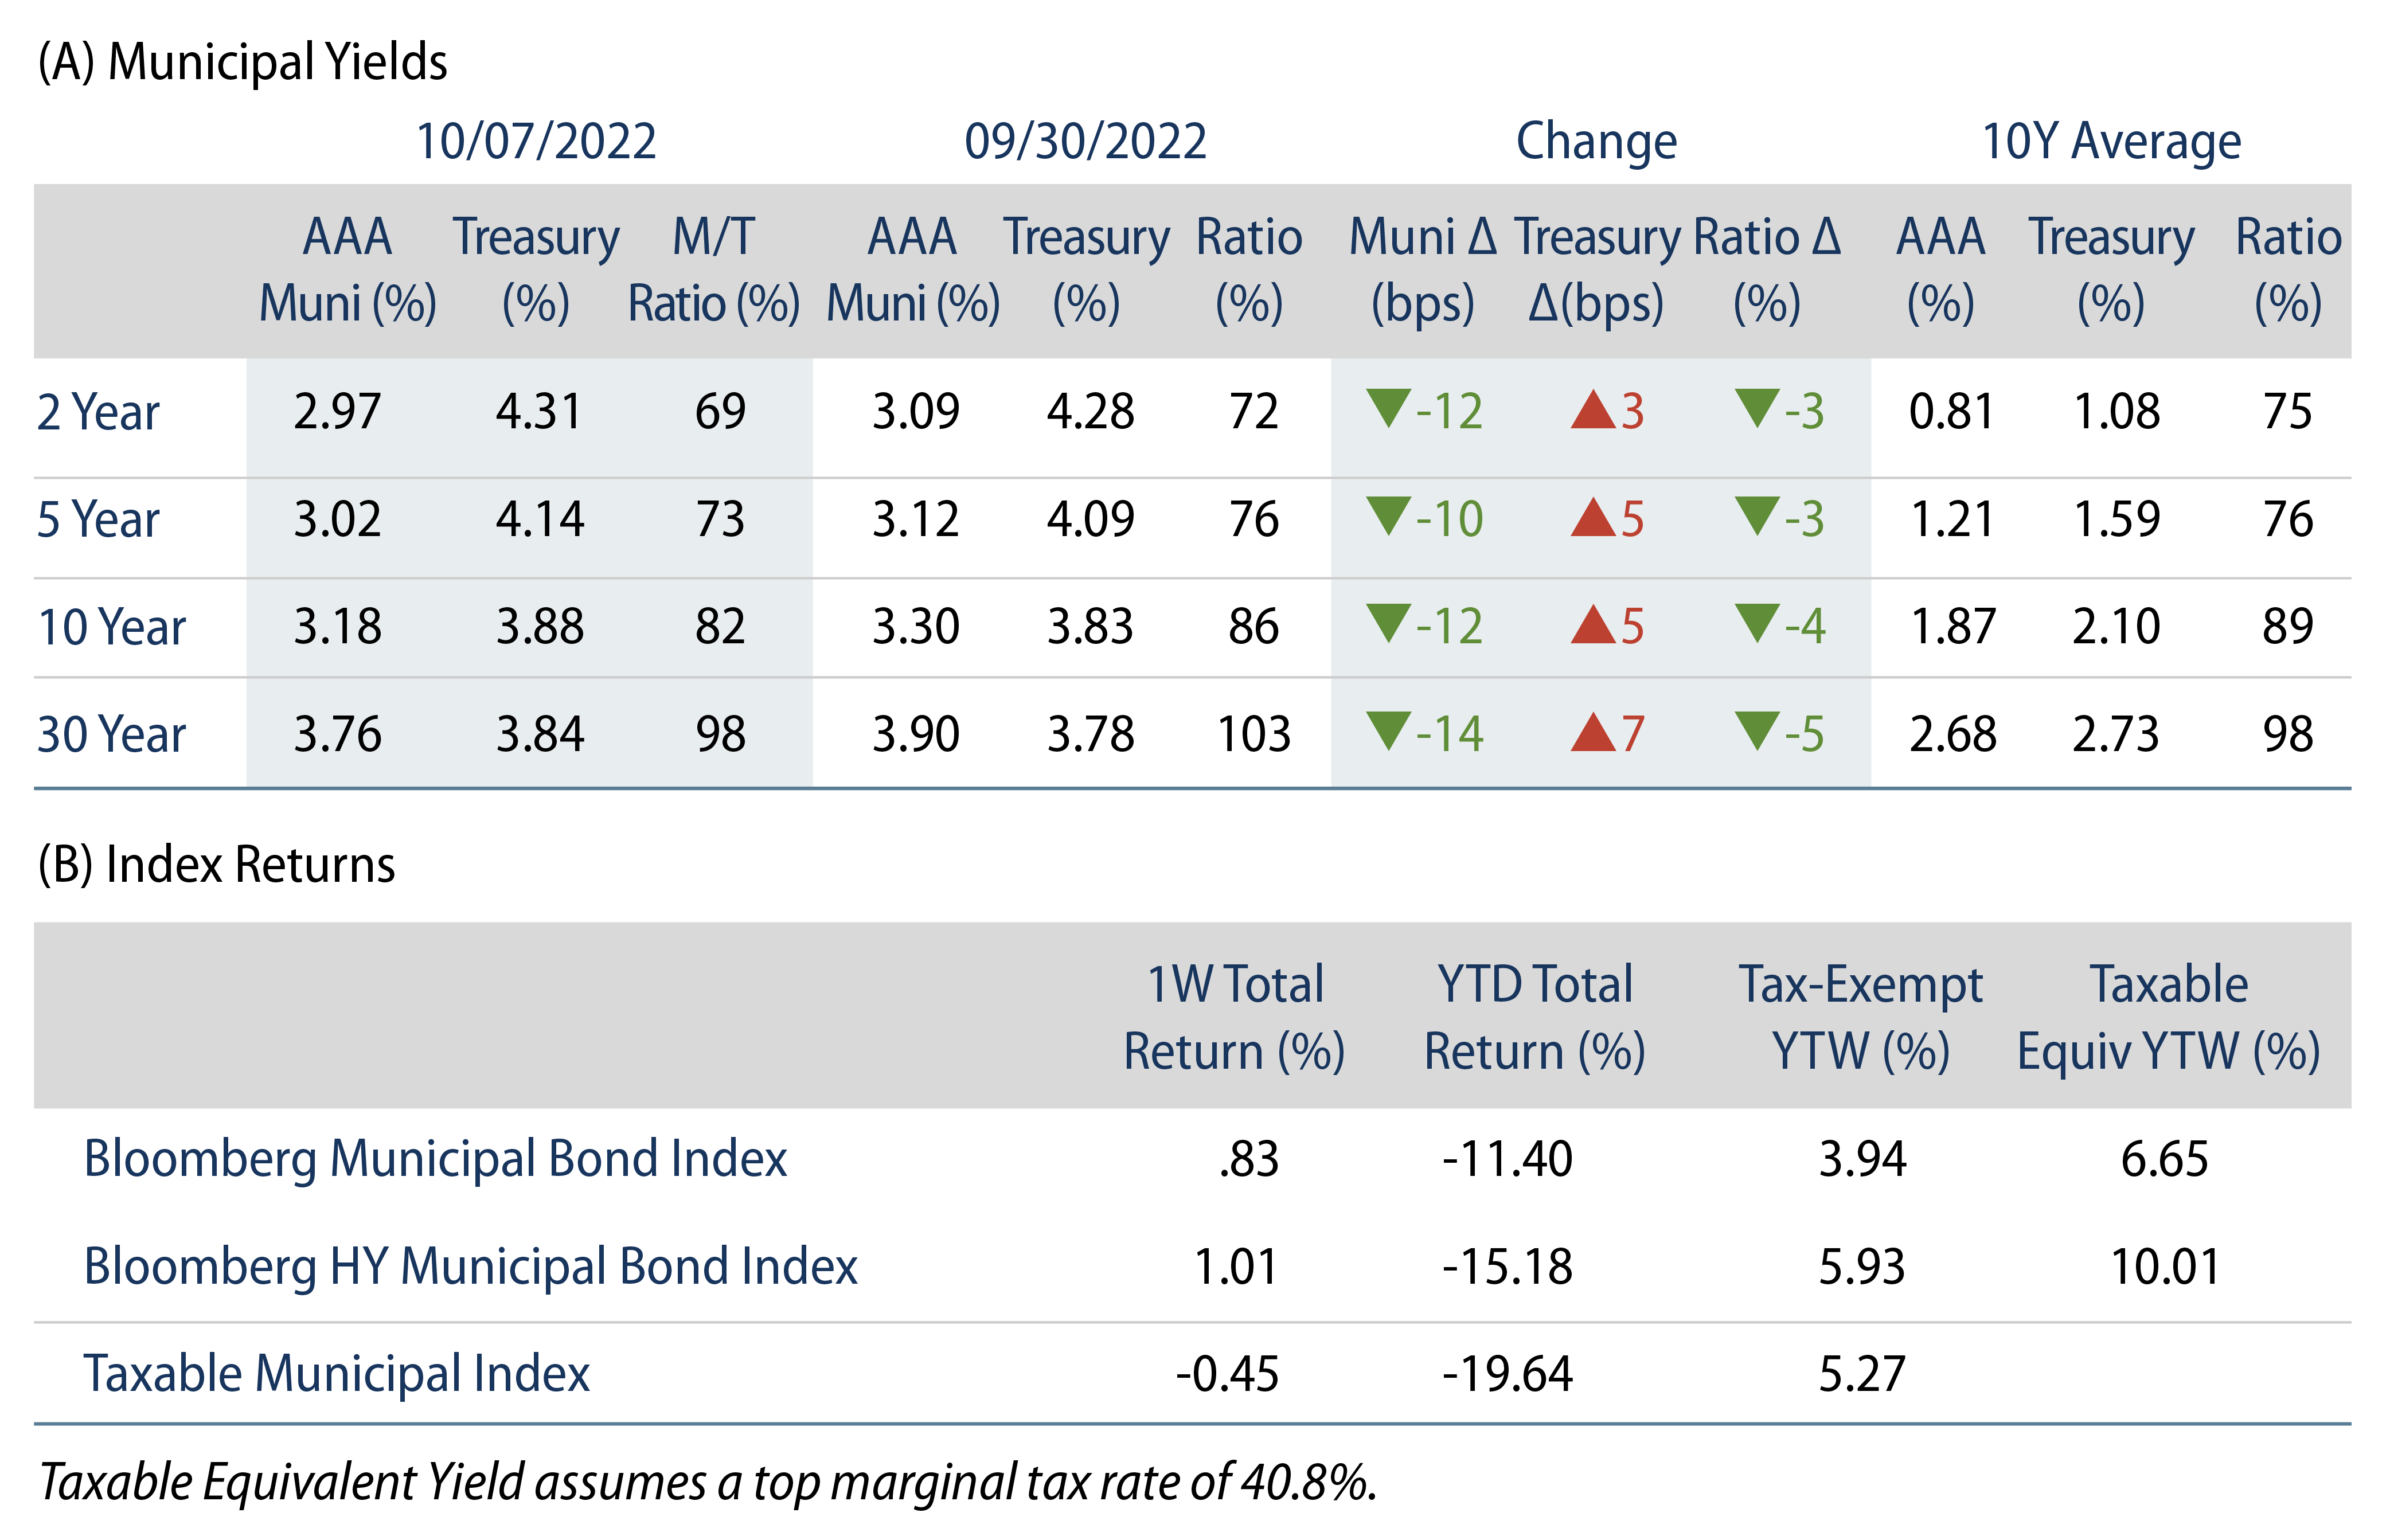
Municipals Posted Positive Returns

Municipals posted positive returns last week despite higher Treasury rates. High-grade municipal yields moved 10-14 bps lower across the curve. Municipals outperformed Treasuries, which reacted to strong economic data and hawkish Fed commentary. Meanwhile, municipal outflows continued amid light supply conditions. The Bloomberg Municipal Index returned 0.83% while the HY Muni Index returned 1.01%. As we enter the last quarter of a volatile year, this week we provide a third quarter recap.

Technicals Were Mixed as Municipal Fund Outflows Were Offset by Light Supply Conditions

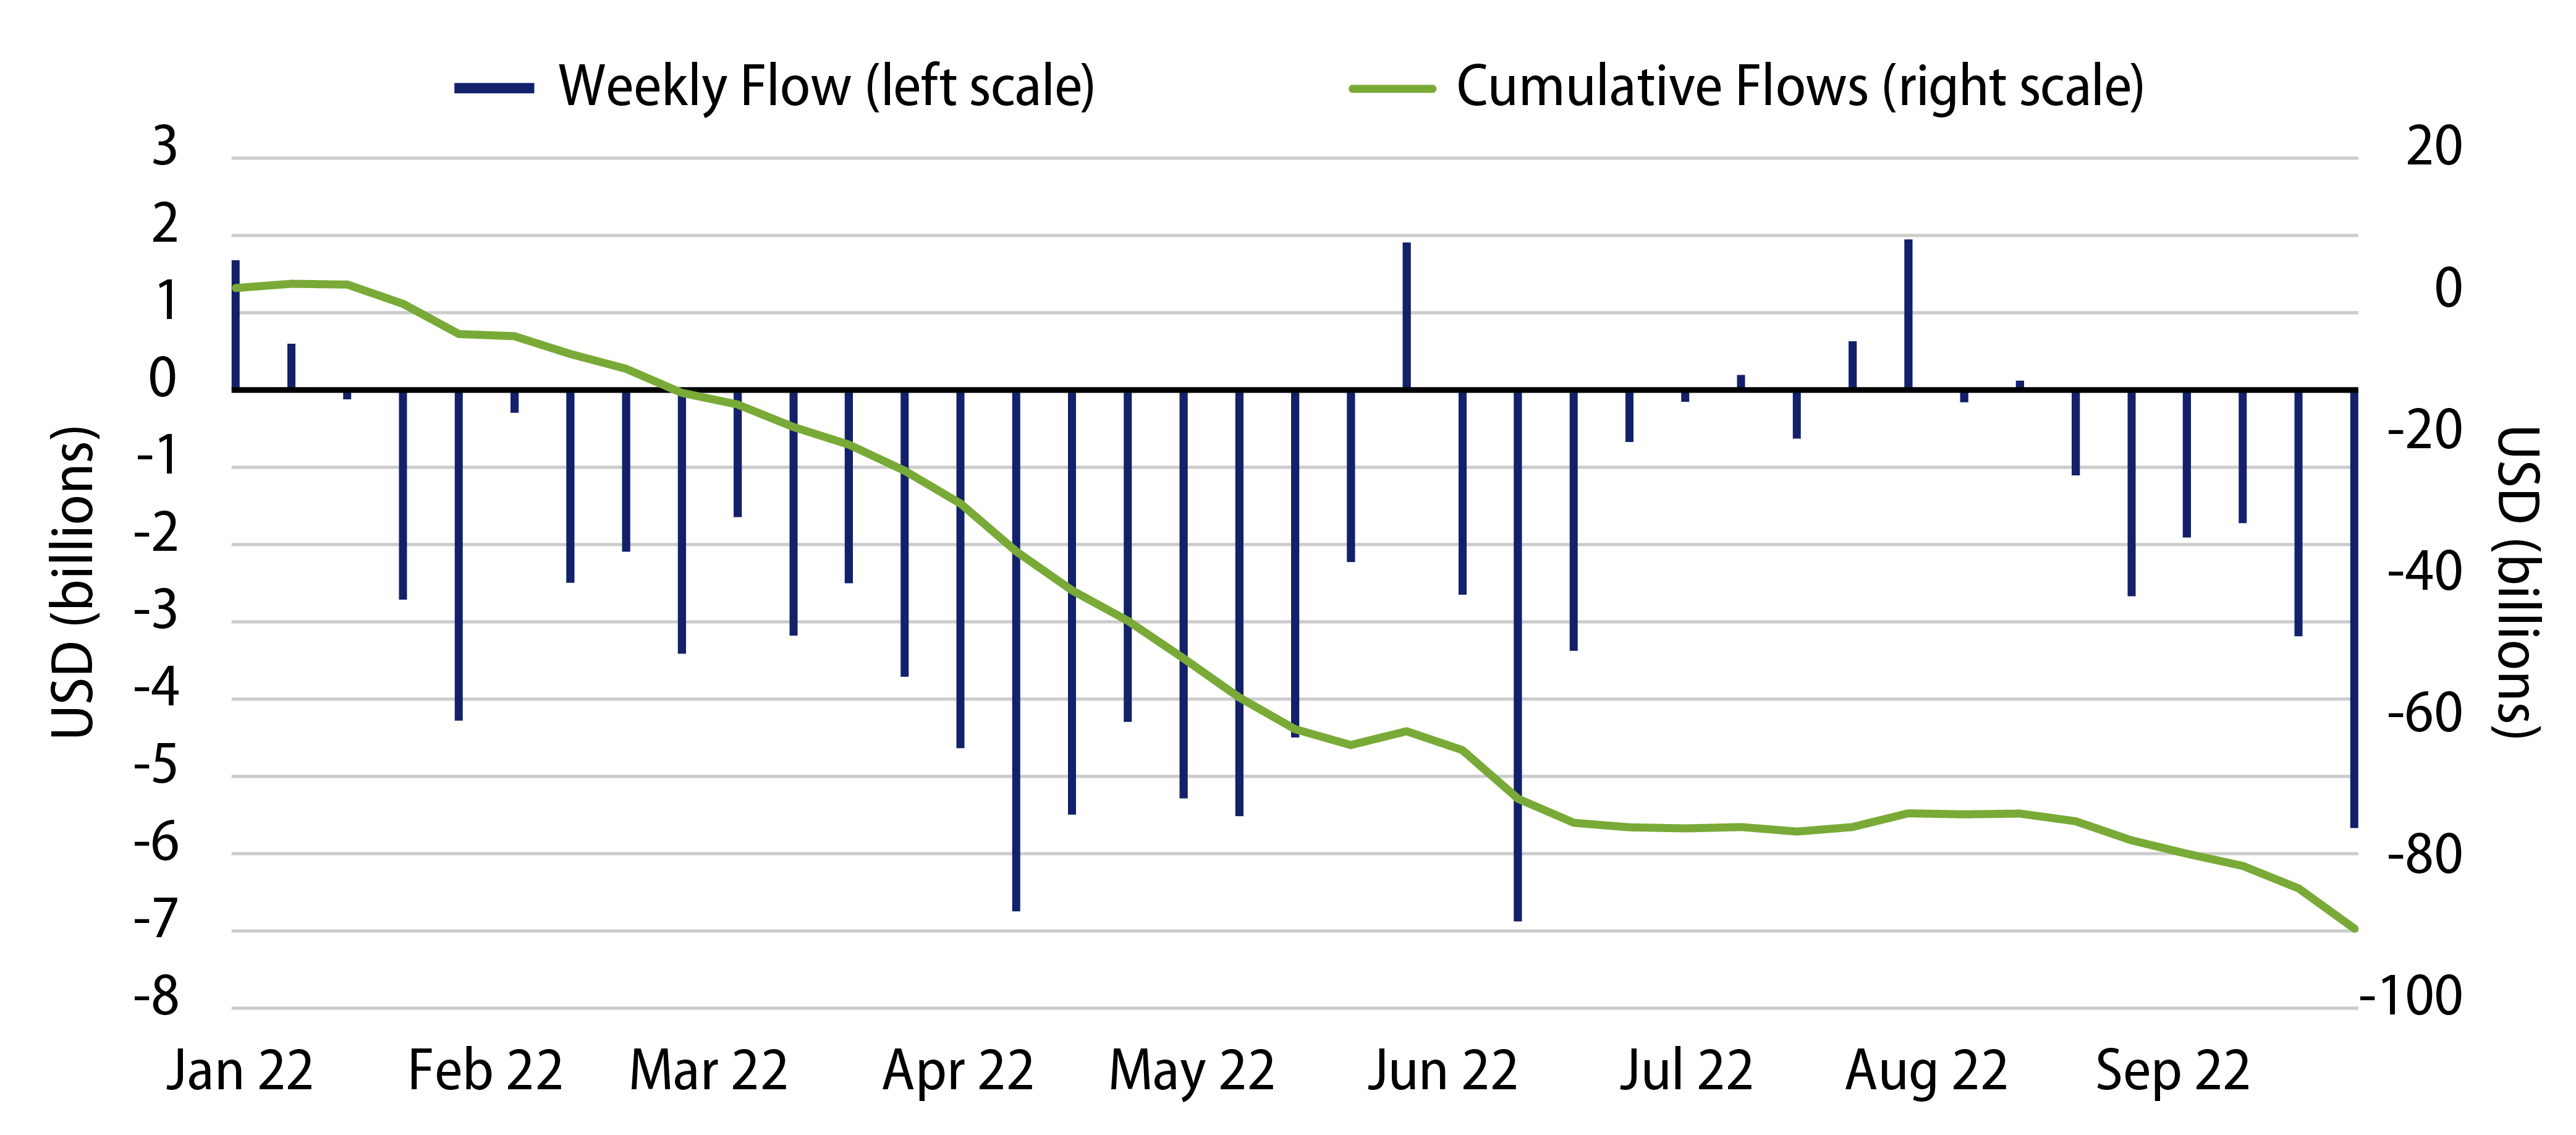
Fund Flows: During the week ending October 5, weekly reporting municipal mutual funds recorded $2.1 billion of net outflows, according to Lipper. Long-term funds recorded $1.2 billion of outflows, high-yield funds recorded $766 million of outflows and intermediate funds recorded $537 million of outflows. The week’s outflows extend year-to-date (YTD) outflows to $92 billion.

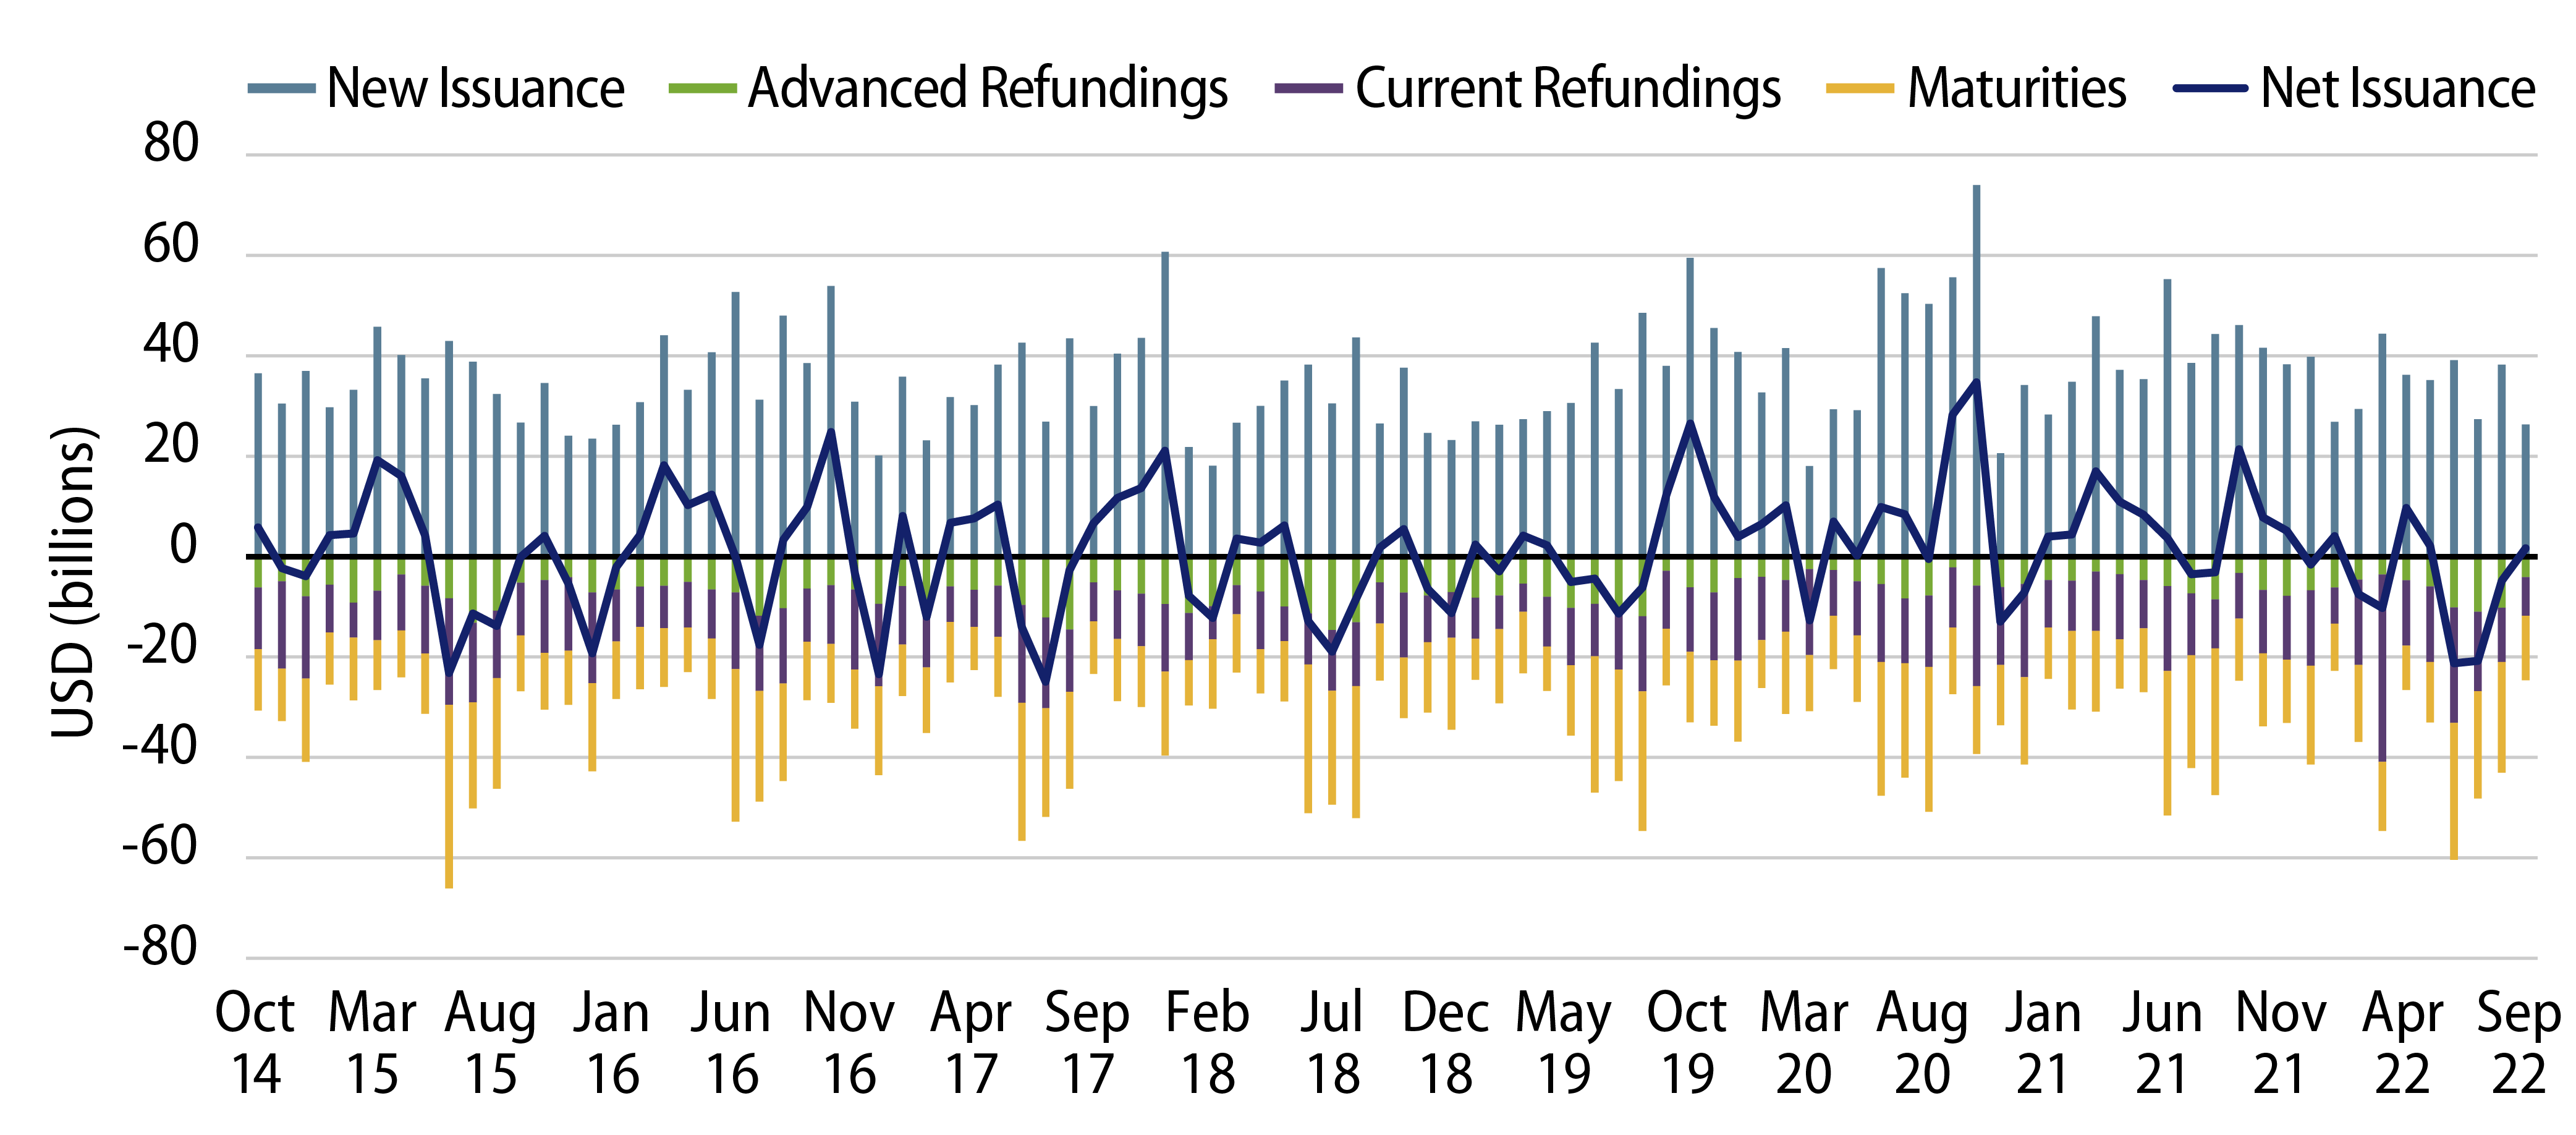
Supply: The muni market recorded $4.9 billion of new-issue volume last week, down 33% from the prior week. Total YTD issuance of $299 billion is 14% lower than last year’s levels, with tax-exempt issuance trending 3% lower year-over-year (YoY) and taxable issuance trending 48% lower YoY. This week’s new-issue calendar is expected to decline to $2 billion due to the holiday. Larger deals include $500 million New Jersey Turnpike Authority and $129 million Leander Independent School District transactions.

This Week in Munis: Third Quarter Review

3Q22 Municipal Performance Extended Historically Large Market Drawdowns: The Bloomberg Municipal Index returned -3.46% in the third quarter, resulting in YTD returns to -12.13% and contributing to the greatest drawdown since the index’s inception. The Bloomberg High Yield Index returned -4.83%. The investment-grade municipal bond index outperformed the Bloomberg U.S. Treasury Index (-4.35%) and the U.S. Corporate Index (-5.06%) during the quarter.

As we have seen in prior rate-hiking cycles, municipals outperformed other major fixed-income asset classes YTD as yields moved higher at a slower pace. We attribute this to the increasing value of the muni tax-exemption at higher nominal rates.

Market Technicals Weakened as Negative Fund Flows Overwhelmed Limited Supply Conditions: Demand for tax-exempt municipals continued to wane in the third quarter, as municipal mutual funds recorded $14 billion of net outflows during the quarter, according to ICI. Market participants were hopeful the record outflow cycle would abate as municipal fund flows fluctuated between positive and negative levels through the first half of the quarter, but fund outflows ultimately accelerated through the end of September, reaching new record highs.

Exhibit 1: Weekly Municipal Mutual Fund Flows
Explore Weekly Municipal Mutual Fund Flows
Source: Bloomberg, ICI, Western Asset. As of 28 Sep 22. Select the image to expand the view.

Regarding supply, in a prior note we anticipated that higher nominal rates and summer holidays would contribute to lower new-issue volume, which when combined with elevated maturity activity would drive negative net new issuance. These trends were realized when total new-issue volume of $92 billion in 3Q22 was down 29% from 3Q21, contributing to a net supply of -$24 billion, compared to +$15 billion in 3Q21.

Exhibit 2: Monthly Net Issuance
Explore Monthly Net Issuance
Source: Bloomberg. As of 30 Sep 22. Select the image to expand the view.

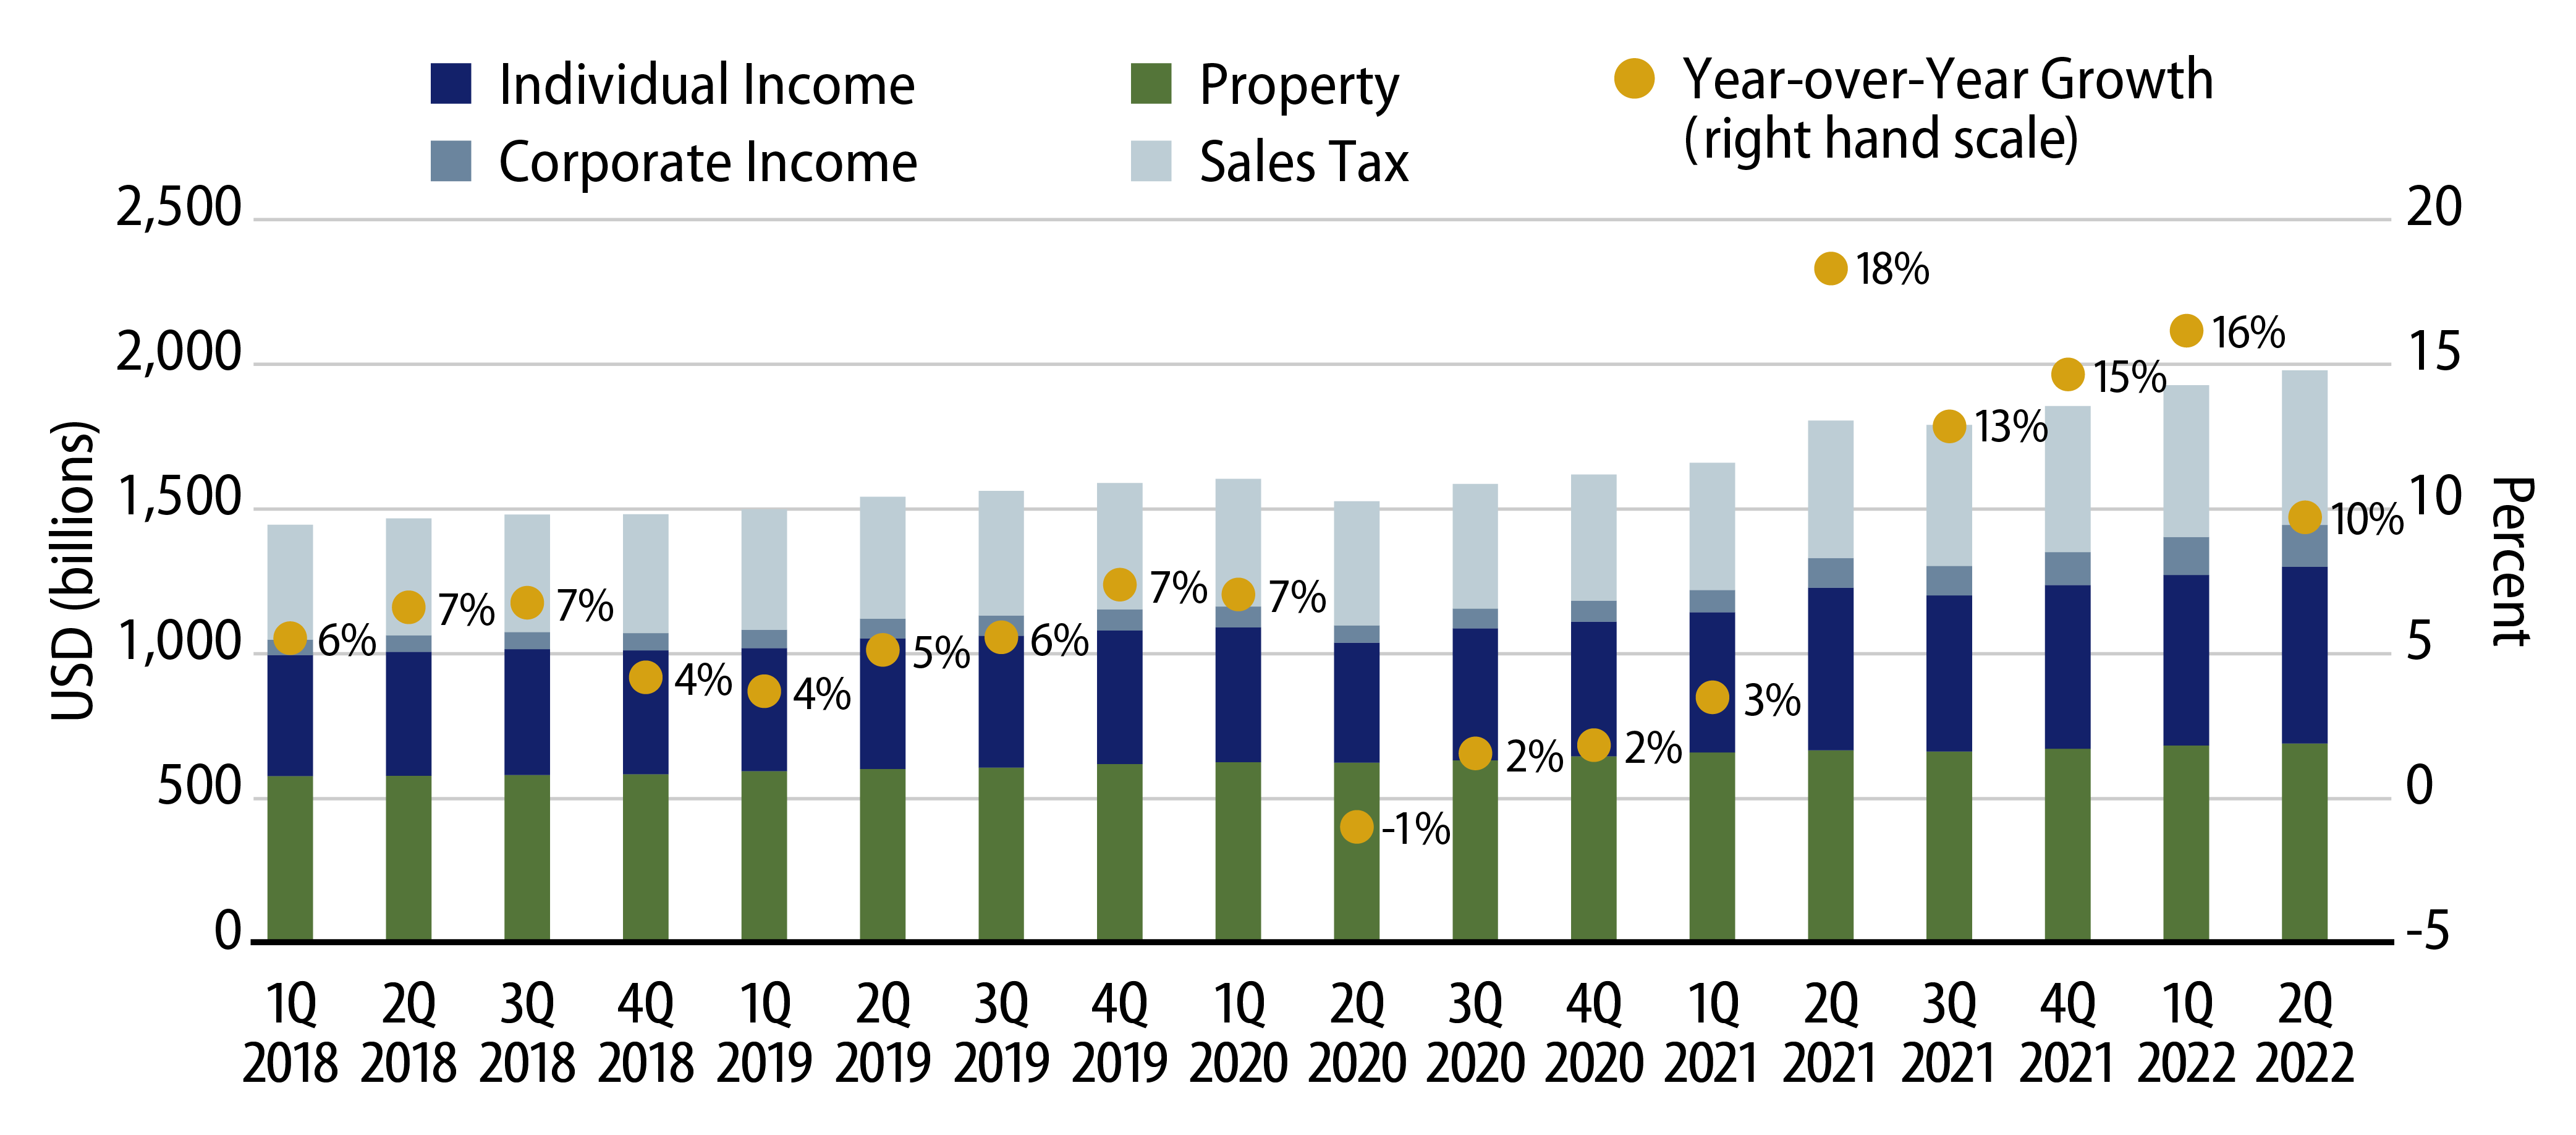
Municipal Fundamentals Continue to Improve: In September, the Census released state and local tax revenue collections for 2Q22, which continue to highlight strong YoY growth driven by favorable labor and housing conditions. Second quarter state and local tax collections were up 11% from the prior year to $532 billion. Individual income tax collections increased 12% to $203 billion, corporate income tax collections increased 29% to $55 billion, property tax collections increased 6% YoY to $124 billion, and sales tax collections increased 7% to $150 billion. Second quarter revenues tend to coincide with the fiscal year-end for many municipalities, and these strong revenue collections should bode well for upcoming financial releases.

Exhibit 3: 12-Month Trailing State and Local Revenue Collections
Explore 12-Month Trailing State and Local Revenue Collections
Source: Census. As of 16 Sep 22. Select the image to expand the view.

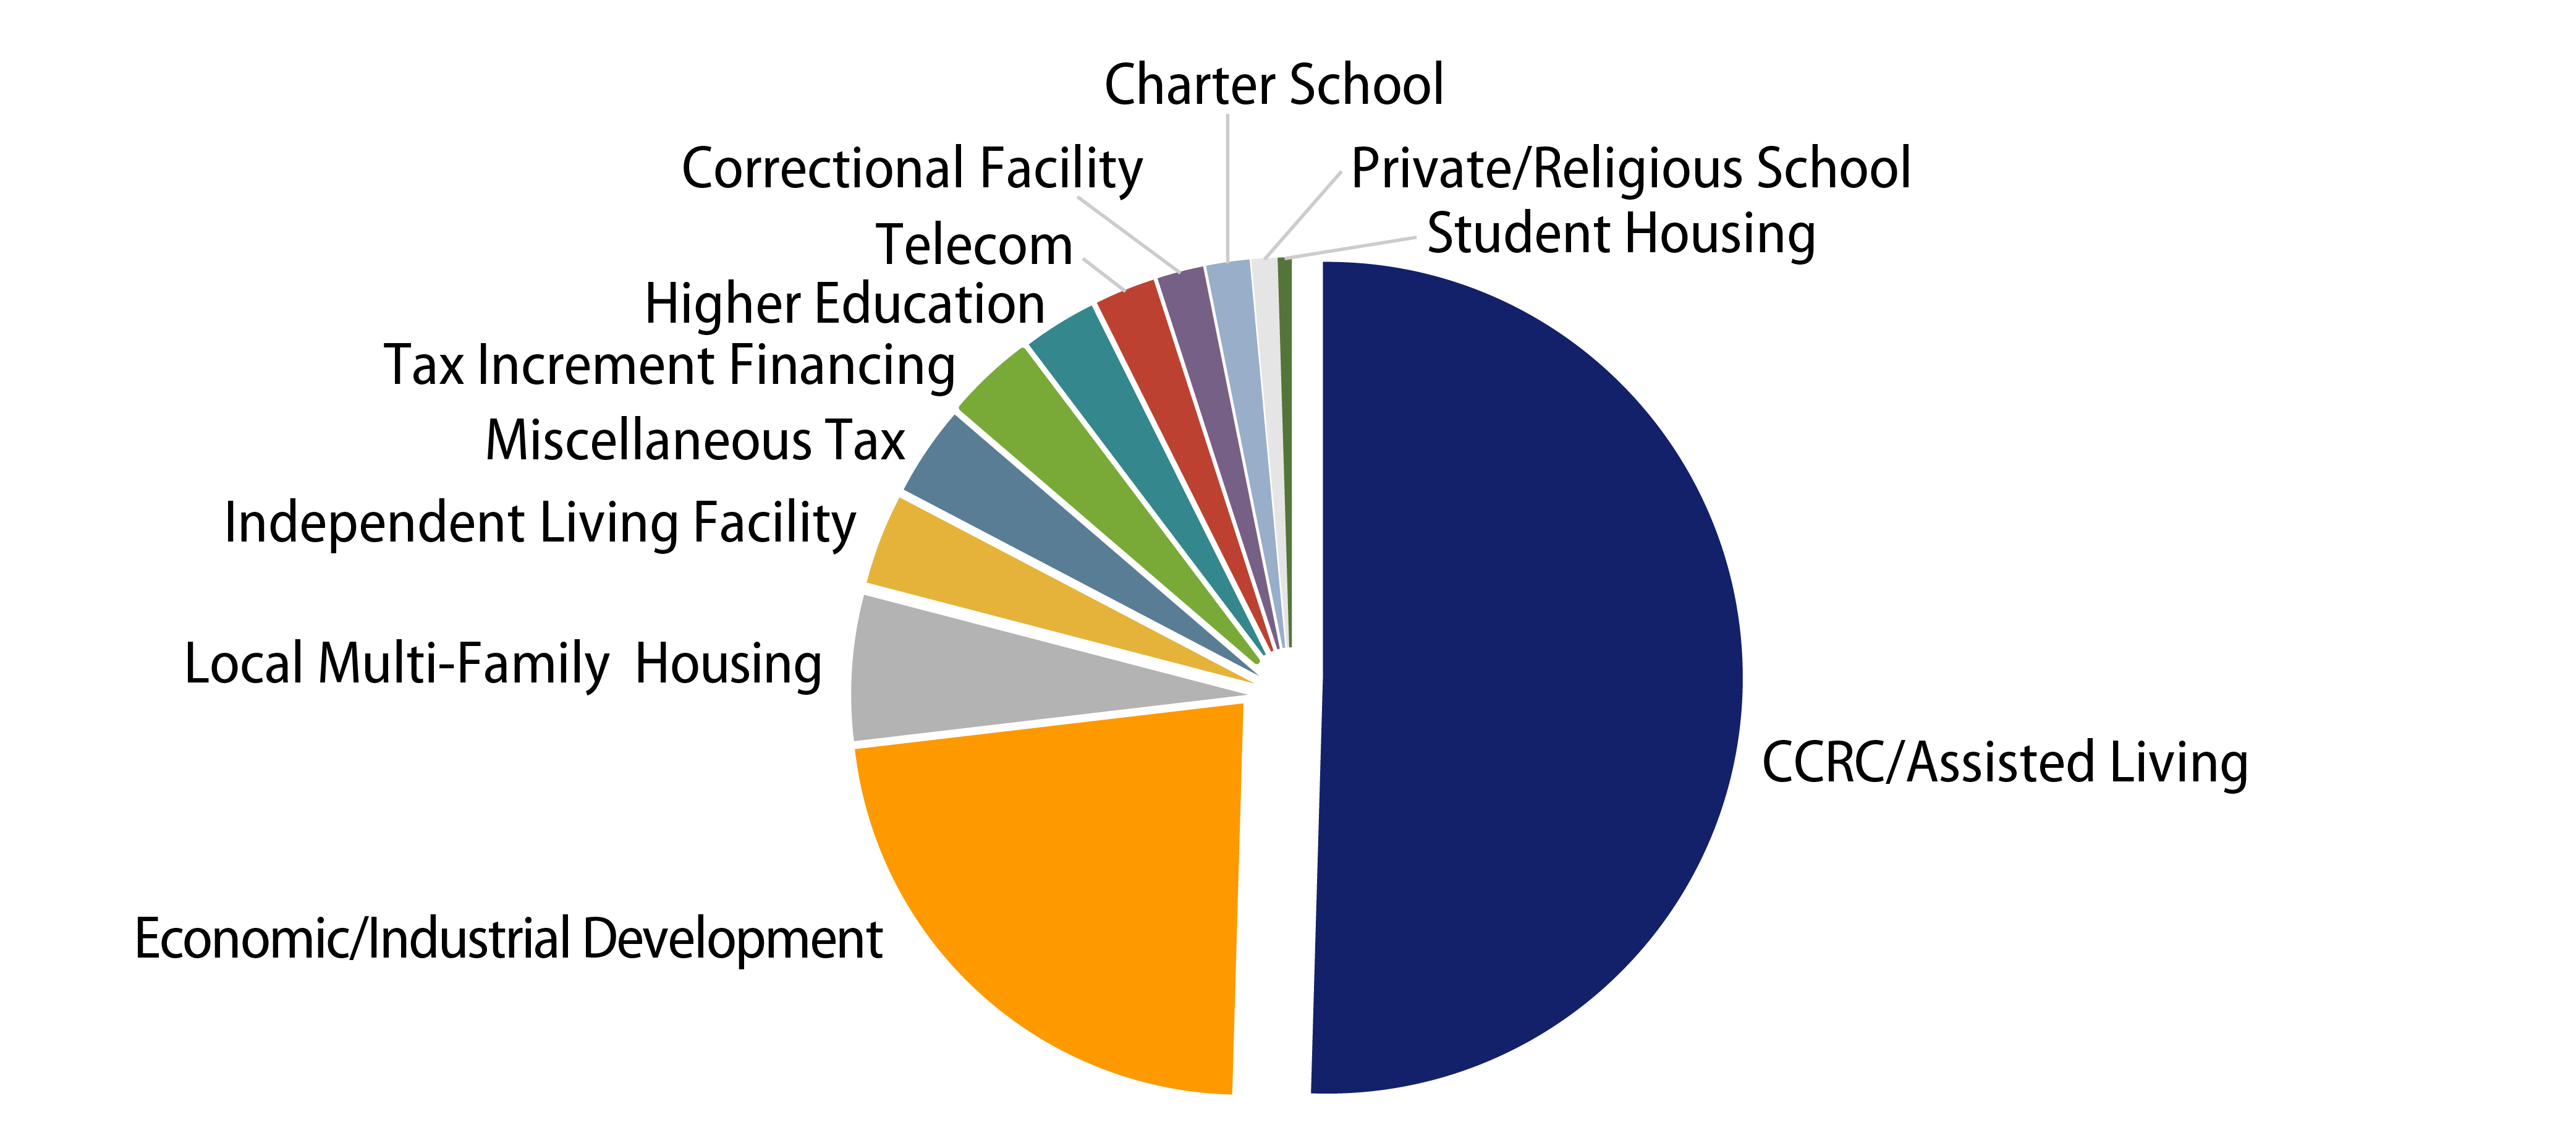
Municipal defaults remain limited and contained to select high-yield sectors. Through September 19, the municipal market recorded 30 debt service payment defaults totaling $853 million, down from the 41 defaults that totaled $1.6 billion through the first nine months of 2021. Similar to recent years, over 50% of outstanding defaulted issuance (by par value) was driven by high-yield Continuing Care and Retirement Community (CCRC) and Assisted Living sectors.

Exhibit 4: 2022 Municipal Defaults
Explore 2022 Municipal Defaults
Source: Bloomberg. As of 16 Sep 22. Select the image to expand the view.

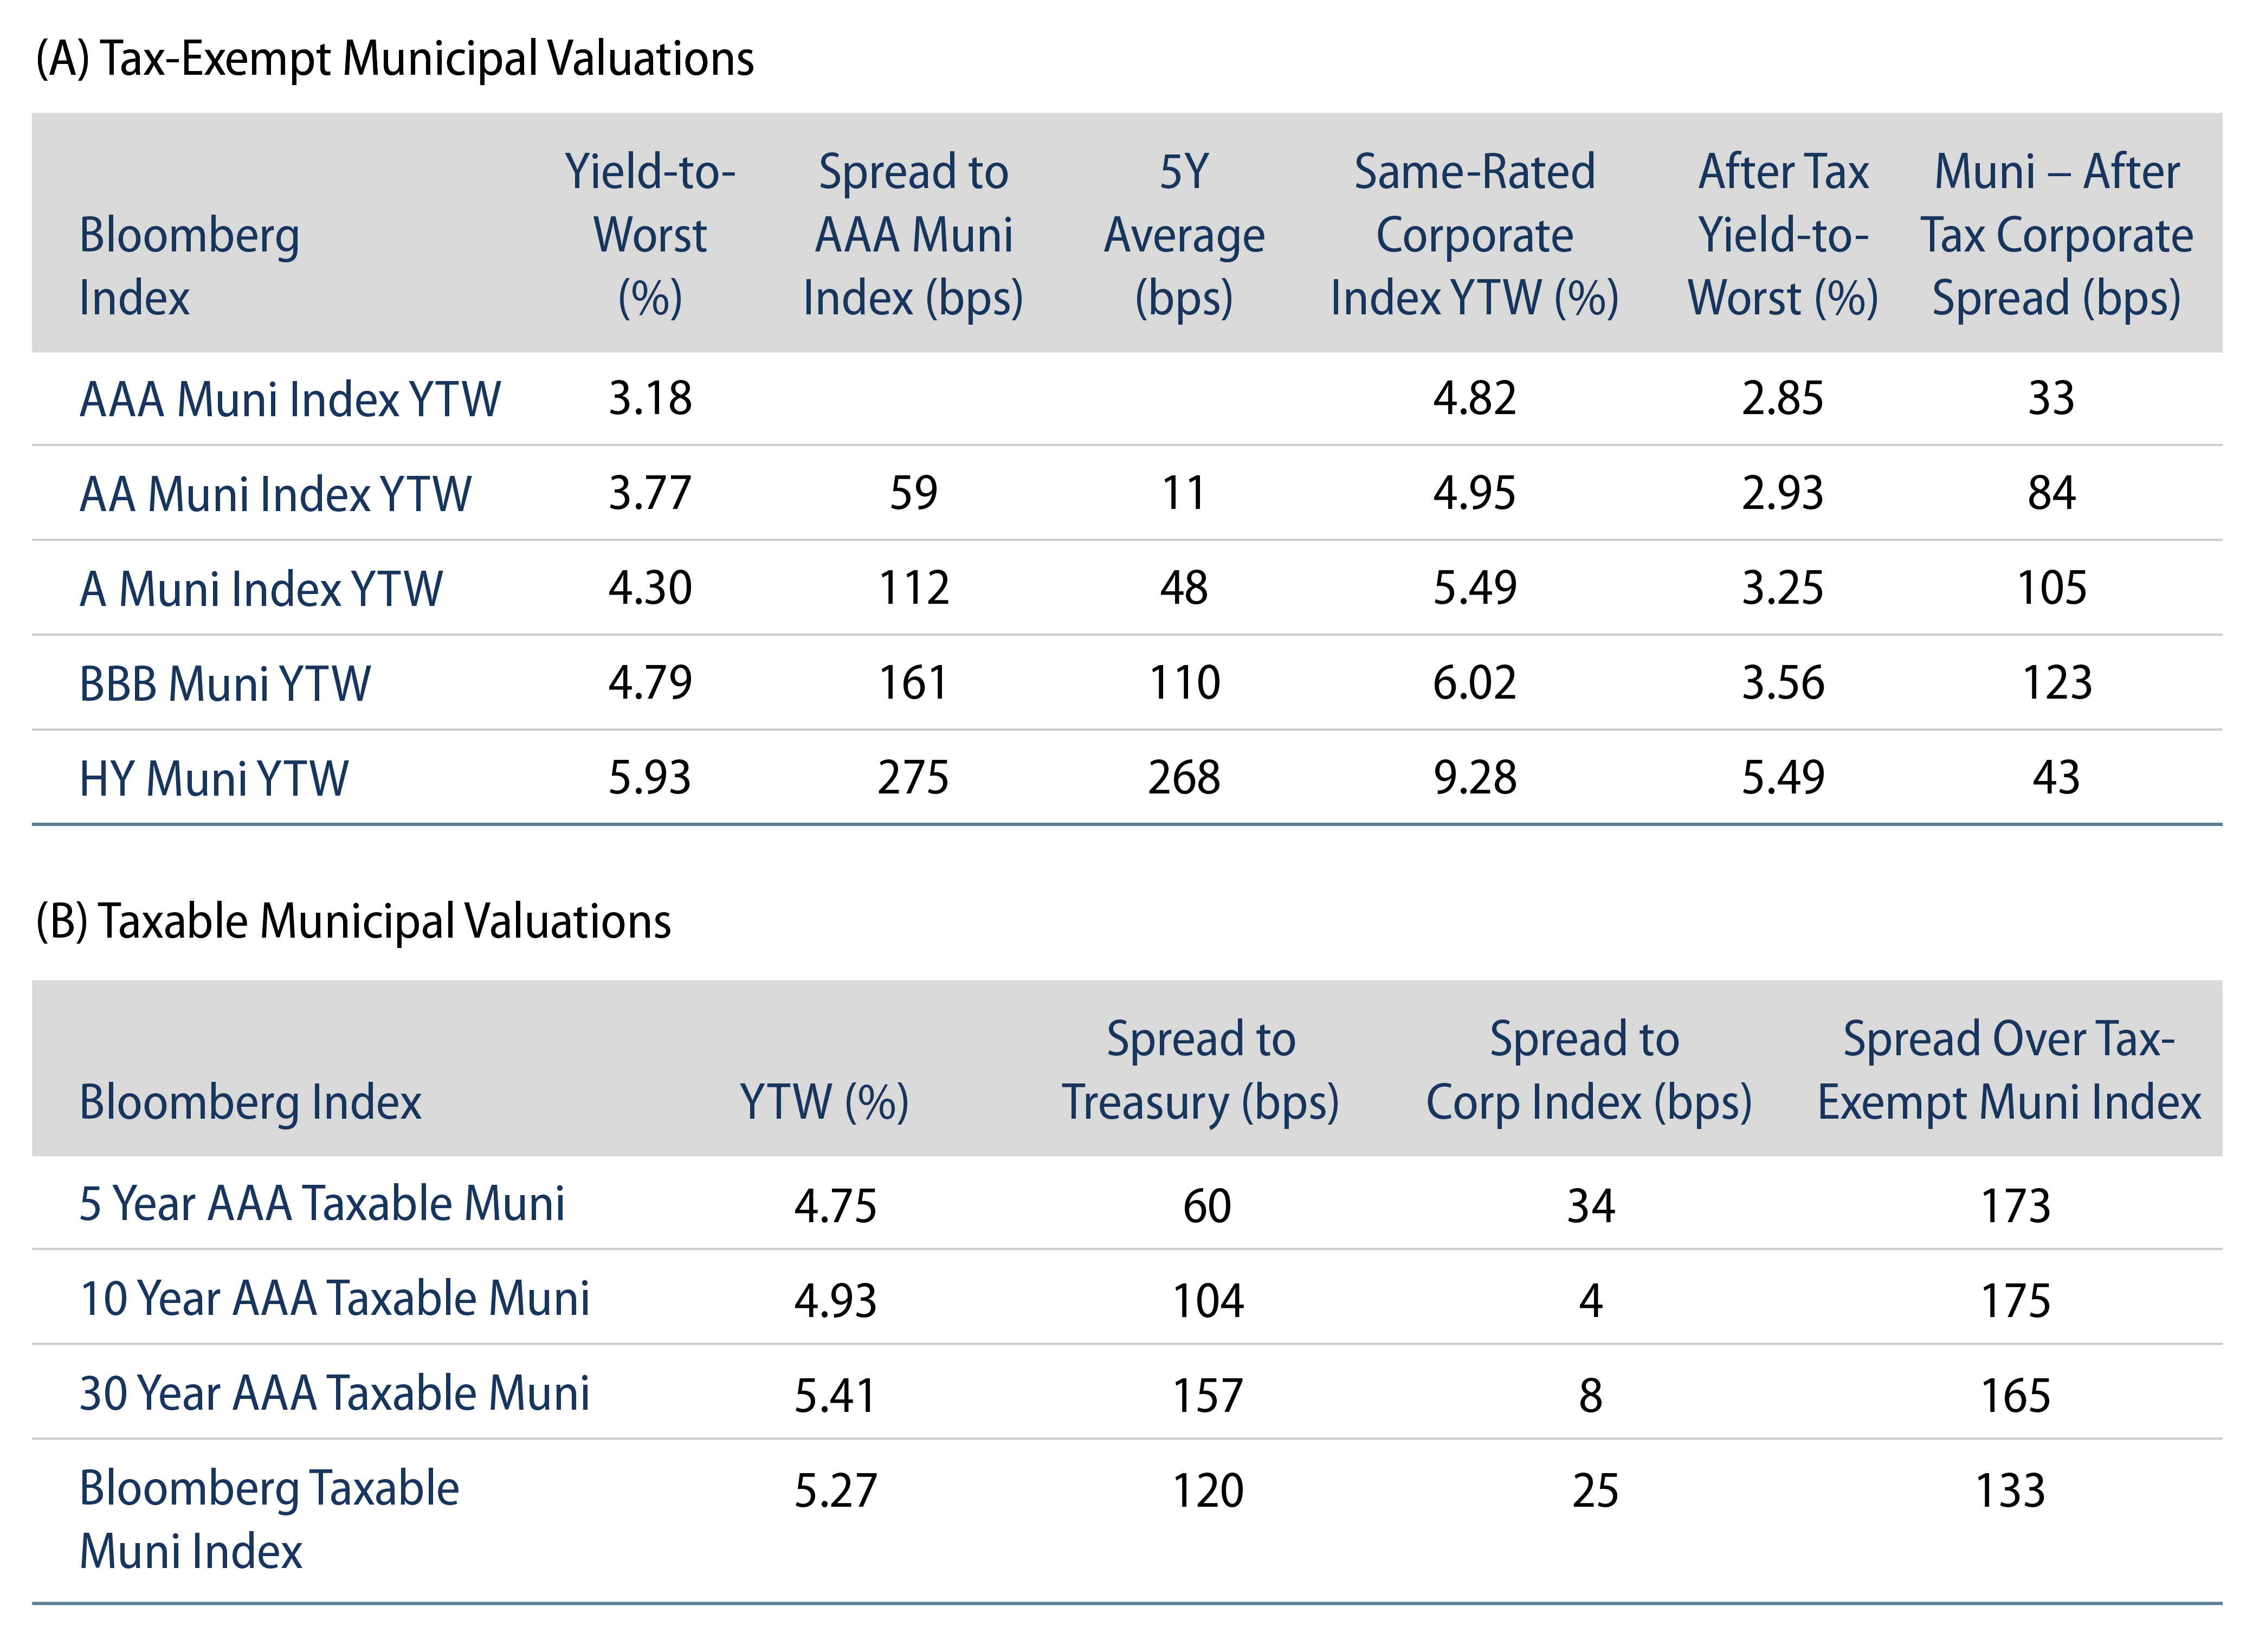
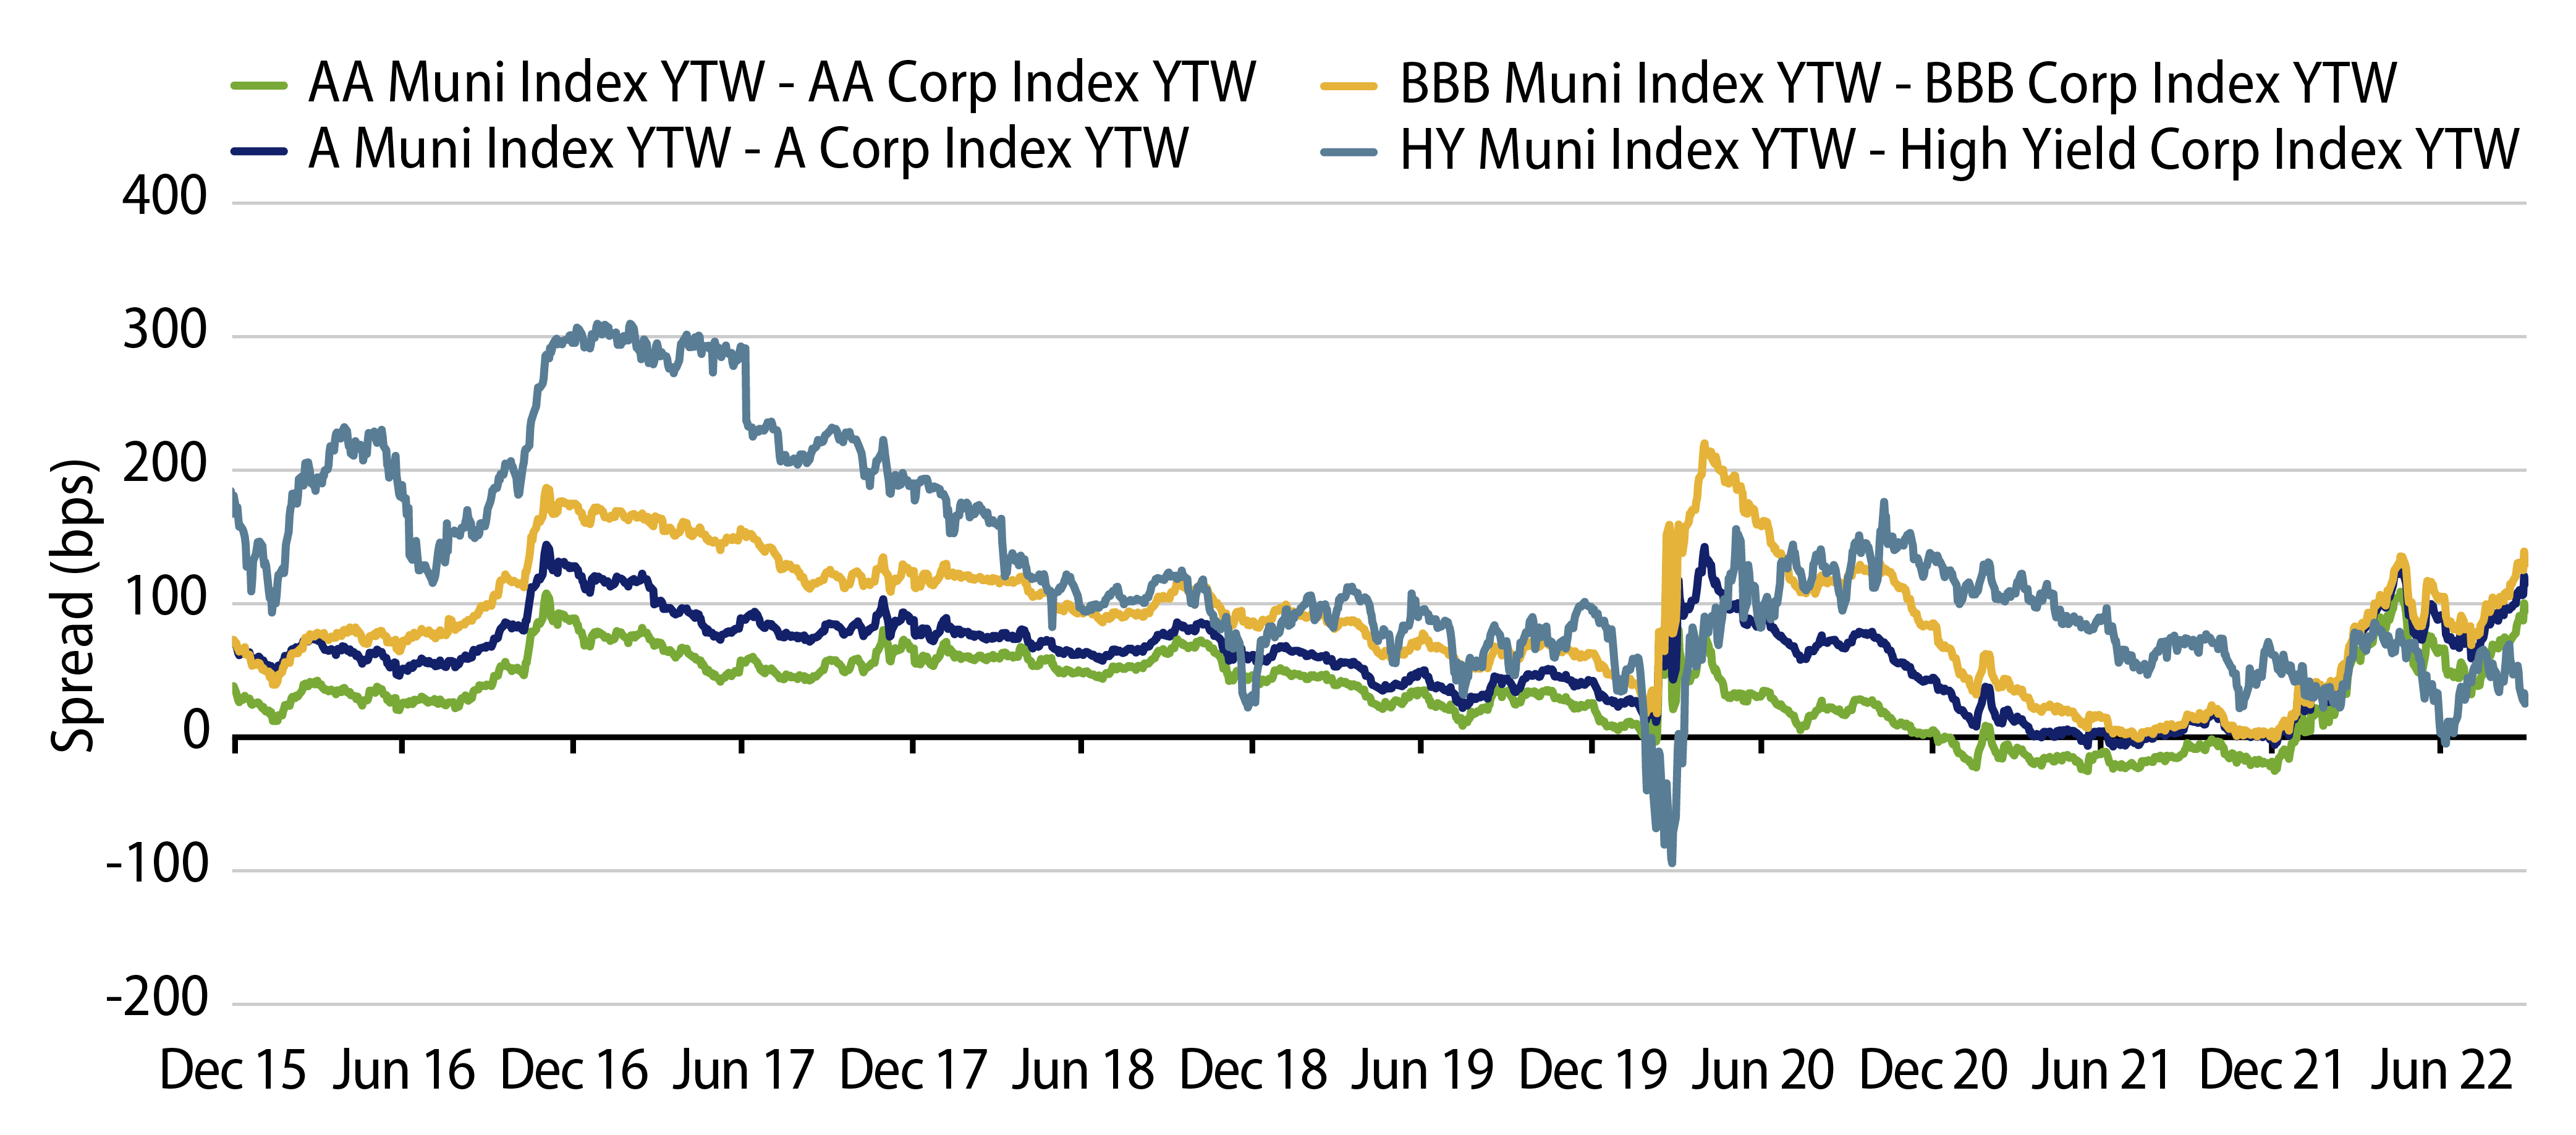
Municipal Valuations Are Attractive for Taxpayers, But Volatility Could Persist: Western Asset believes that municipals will continue to offer value for most investors subject to tax rates. Considering the highest marginal tax rate, investment-grade municipal index yields now offer 100 bps of excess after-tax spread versus comparably rated corporate credit. High-yield municipal relative value is less compelling from this perspective, with the longer duration High Yield Municipal Index offering just 30 bps relative to the High Yield Corporate Index, below historical averages.

Exhibit 5: Muni – Corporate Index (After-Tax) Spreads
Explore Muni – Corporate Index (After-Tax) Spreads
Source: Bloomberg, Western Asset. As of 07 Oct 22. After tax yield assumes top marginal tax rate of 40.8%. Select the image to expand the view.

As we begin 4Q22, we believe volatile market conditions could persist. In addition to the uncertainty around inflation, the potential for higher supply conditions as well as an increased likelihood for a hard landing could negatively impact high-yield municipal credit spreads. As such, Western Asset believes that investors are better compensated in higher grade, more liquid allocations that could better withstand volatile conditions and provide the flexibility to take advantage of outsized market weakness.

Exhibit 6: Municipal Bond Yields and Index Returns
Explore Municipal Bond Yields and Index Returns
Source: Bloomberg. As of 07 Oct 22. Select the image to expand the view.
Exhibit 7: Tax-Exempt and Taxable Muni Valuations
Explore Tax-Exempt and Taxable Muni Valuations
Source: Bloomberg. As of 07 Oct 22. Select the image to expand the view.
© Western Asset Management Company, LLC 2024. The information contained in these materials ("the materials") is intended for the exclusive use of the designated recipient ("the recipient"). This information is proprietary and confidential and may contain commercially sensitive information, and may not be copied, reproduced or republished, in whole or in part, without the prior written consent of Western Asset Management Company ("Western Asset").
Past performance does not predict future returns. These materials should not be deemed to be a prediction or projection of future performance. These materials are intended for investment professionals including professional clients, eligible counterparties, and qualified investors only.
These materials have been produced for illustrative and informational purposes only. These materials contain Western Asset's opinions and beliefs as of the date designated on the materials; these views are subject to change and may not reflect real-time market developments and investment views.
Third party data may be used throughout the materials, and this data is believed to be accurate to the best of Western Asset's knowledge at the time of publication, but cannot be guaranteed. These materials may also contain strategy or product awards or rankings from independent third parties or industry publications which are based on unbiased quantitative and/or qualitative information determined independently by each third party or publication. In some cases, Western Asset may subscribe to these third party's standard industry services or publications. These standard subscriptions and services are available to all asset managers and do not influence rankings or awards in any way.
Investment strategies or products discussed herein may involve a high degree of risk, including the loss of some or all capital. Investments in any products or strategies described in these materials may be volatile, and investors should have the financial ability and willingness to accept such risks.
Unless otherwise noted, investment performance contained in these materials is reflective of a strategy composite. All other strategy data and information included in these materials reflects a representative portfolio which is an account in the composite that Western Asset believes most closely reflects the current portfolio management style of the strategy. Performance is not a consideration in the selection of the representative portfolio. The characteristics of the representative portfolio shown may differ from other accounts in the composite. Information regarding the representative portfolio and the other accounts in the composite are available upon request. Statements in these materials should not be considered investment advice. References, either general or specific, to securities and/or issuers in the materials are for illustrative purposes only and are not intended to be, and should not be interpreted as, recommendation to purchase or sell such securities. Employees and/or clients of Western Asset may have a position in the securities or issuers mentioned.
These materials are not intended to provide, and should not be relied on for, accounting, legal, tax, investment or other advice. The recipient should consult its own counsel, accountant, investment, tax, and any other advisers for this advice, including economic risks and merits, related to making an investment with Western Asset. The recipient is responsible for observing the applicable laws and regulations of their country of residence.
Founded in 1971, Western Asset Management Company is a global fixed-income investment manager with offices in Pasadena, New York, London, Singapore, Tokyo, Melbourne, São Paulo, Hong Kong, and Zürich. Western Asset is a wholly owned subsidiary of Franklin Resources, Inc. but operates autonomously. Western Asset is comprised of six legal entities across the globe, each with distinct regional registrations: Western Asset Management Company, LLC, a registered Investment Adviser with the Securities and Exchange Commission; Western Asset Management Company Distribuidora de Títulos e Valores Mobiliários Limitada is authorized and regulated by Comissão de Valores Mobiliários and Brazilian Central Bank; Western Asset Management Company Pty Ltd ABN 41 117 767 923 is the holder of the Australian Financial Services License 303160; Western Asset Management Company Pte. Ltd. Co. Reg. No. 200007692R is a holder of a Capital Markets Services License for fund management and regulated by the Monetary Authority of Singapore; Western Asset Management Company Ltd, a registered Financial Instruments Business Operator and regulated by the Financial Services Agency of Japan; and Western Asset Management Company Limited is authorised and regulated by the Financial Conduct Authority ("FCA") (FRN 145930). This communication is intended for distribution to Professional Clients only if deemed to be a financial promotion in the UK as defined by the FCA. This communication may also be intended for certain EEA countries where Western Asset has been granted permission to do so. For the current list of the approved EEA countries please contact Western Asset at +44 (0)20 7422 3000.