Investment-Grade Municipals Posted Negative Returns Last Week
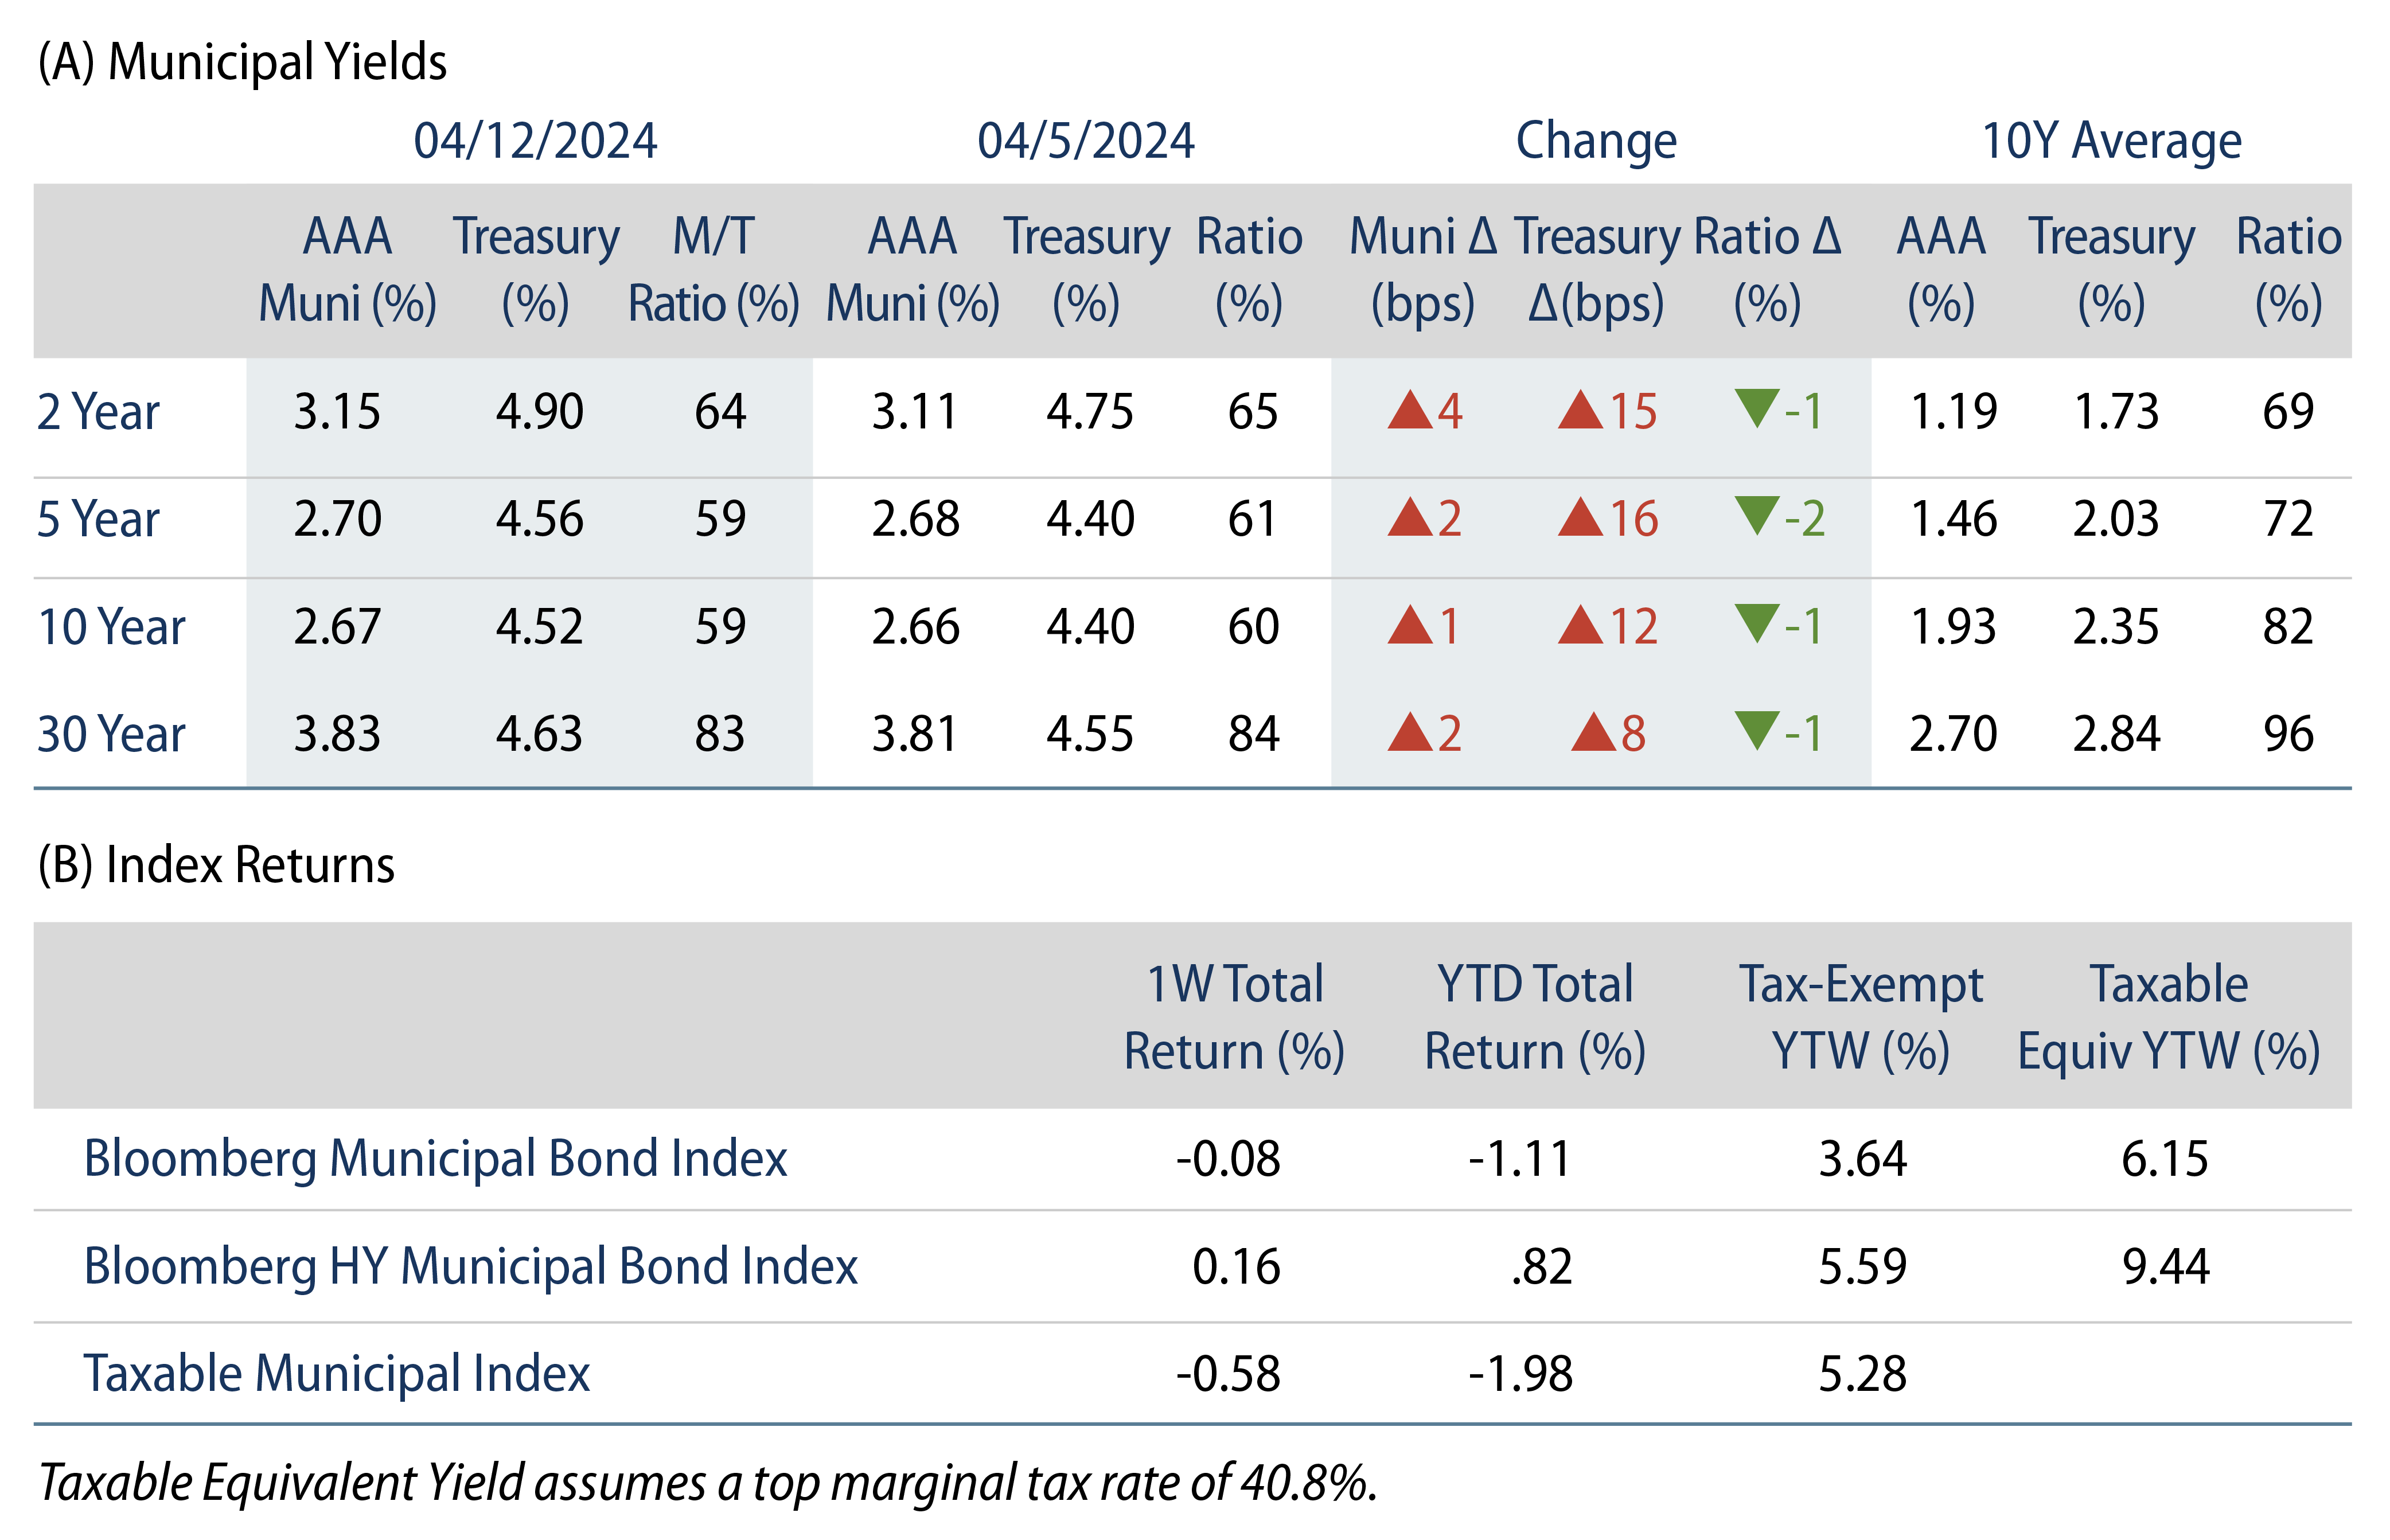
Investment-grade munis posted negative returns last week and outperformed Treasuries, which moved higher on hotter than expected inflation data. High-grade muni yields moved higher across the yield curve and market technicals remained favorable on mutual fund inflows. The Bloomberg Municipal Index returned -0.08% during the week, the High Yield Muni Index returned -0.16% and the Taxable Muni Index returned -0.58%. This week we highlight key tax themes we are monitoring around Tax Day.
Market Technicals Were Supported by Fund Inflows
Fund Flows: During the week ending April 10, weekly reporting municipal mutual funds recorded $415 million of net inflows, according to Lipper. Long-term funds recorded $704 million of inflows, intermediate funds recorded $211 million of outflows and high-yield funds recorded $11 million of inflows. Short-term funds recorded $50 million of outflows. This week’s inflows lead estimated year-to-date (YTD) net inflows higher to $10.7 billion.
Supply: The muni market recorded $9 billion of new-issue volume last week, up 48% from the prior week. YTD issuance of $115 billion is 41% higher than last year’s level, with tax-exempt issuance 55% higher and taxable issuance 42% lower year-over-year. This week’s calendar is expected to decline to $5 billion. Largest deals include $1.5 billion Florida State Board of Administration Financing Corp and $550 million University of Texas transactions.
This Week in Munis: Tax Time
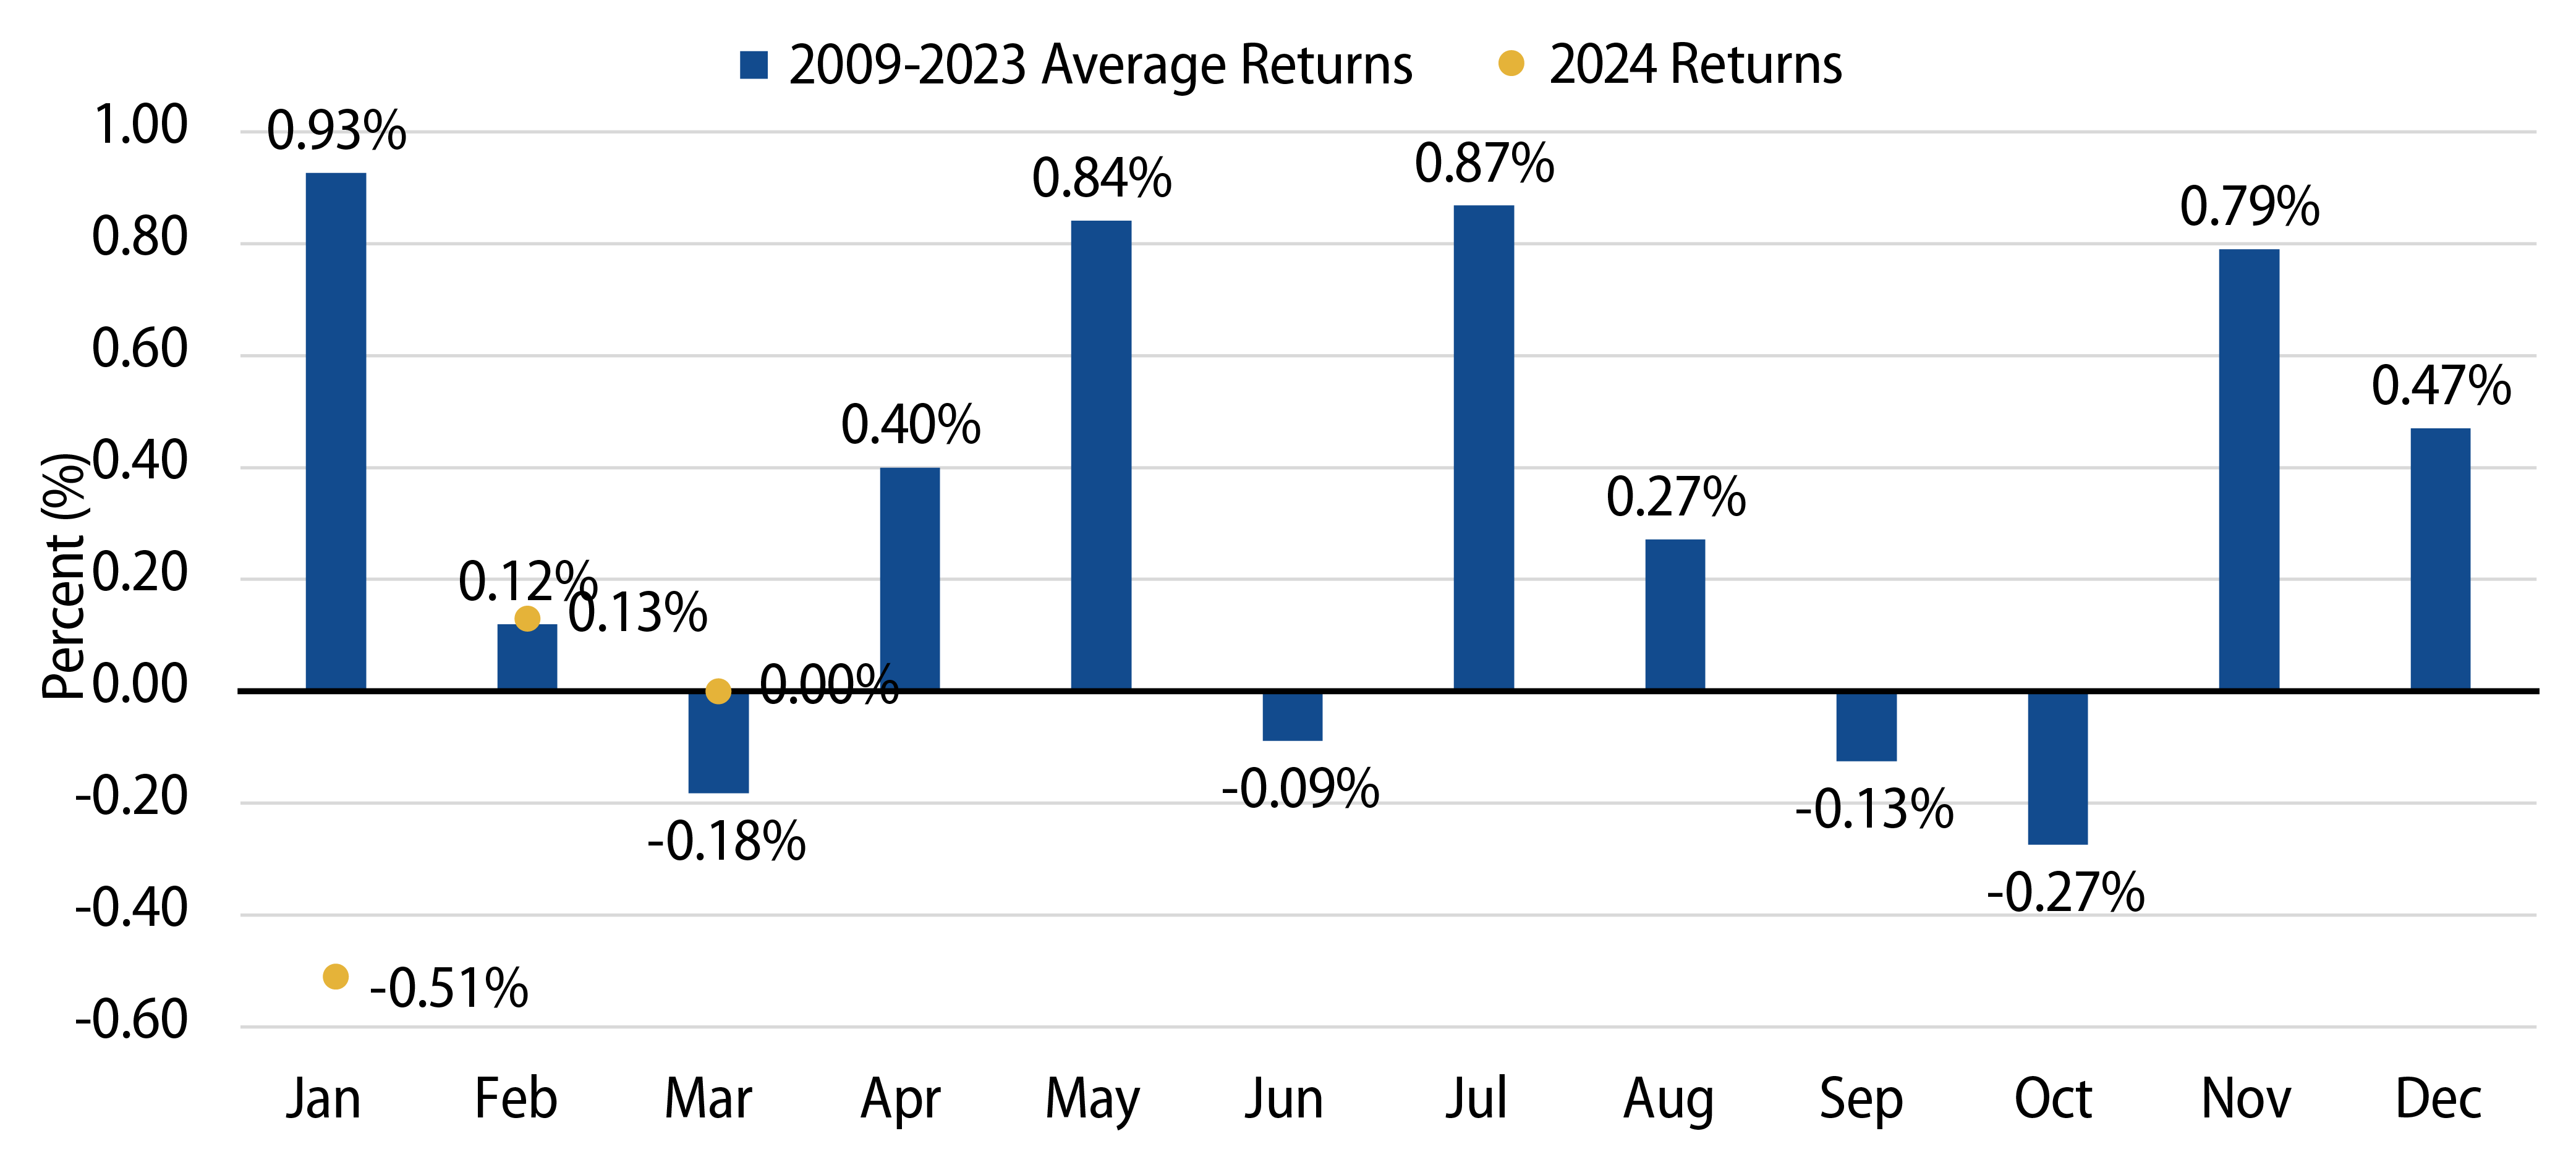
The municipal market has typically delivered below average returns and potential higher yield opportunities during the weeks ahead of Tax Day, largely driven by seasonal demand weakness. From 2009 to 2022 the Bloomberg Muni Bond Index recorded an average total return of -0.18% in March, ranked third-worst across all months. This year, the March 2024 total return of 0.0% outperformed the historical weakness, as market technicals also bucked historical trends and highlighted continued improvement.
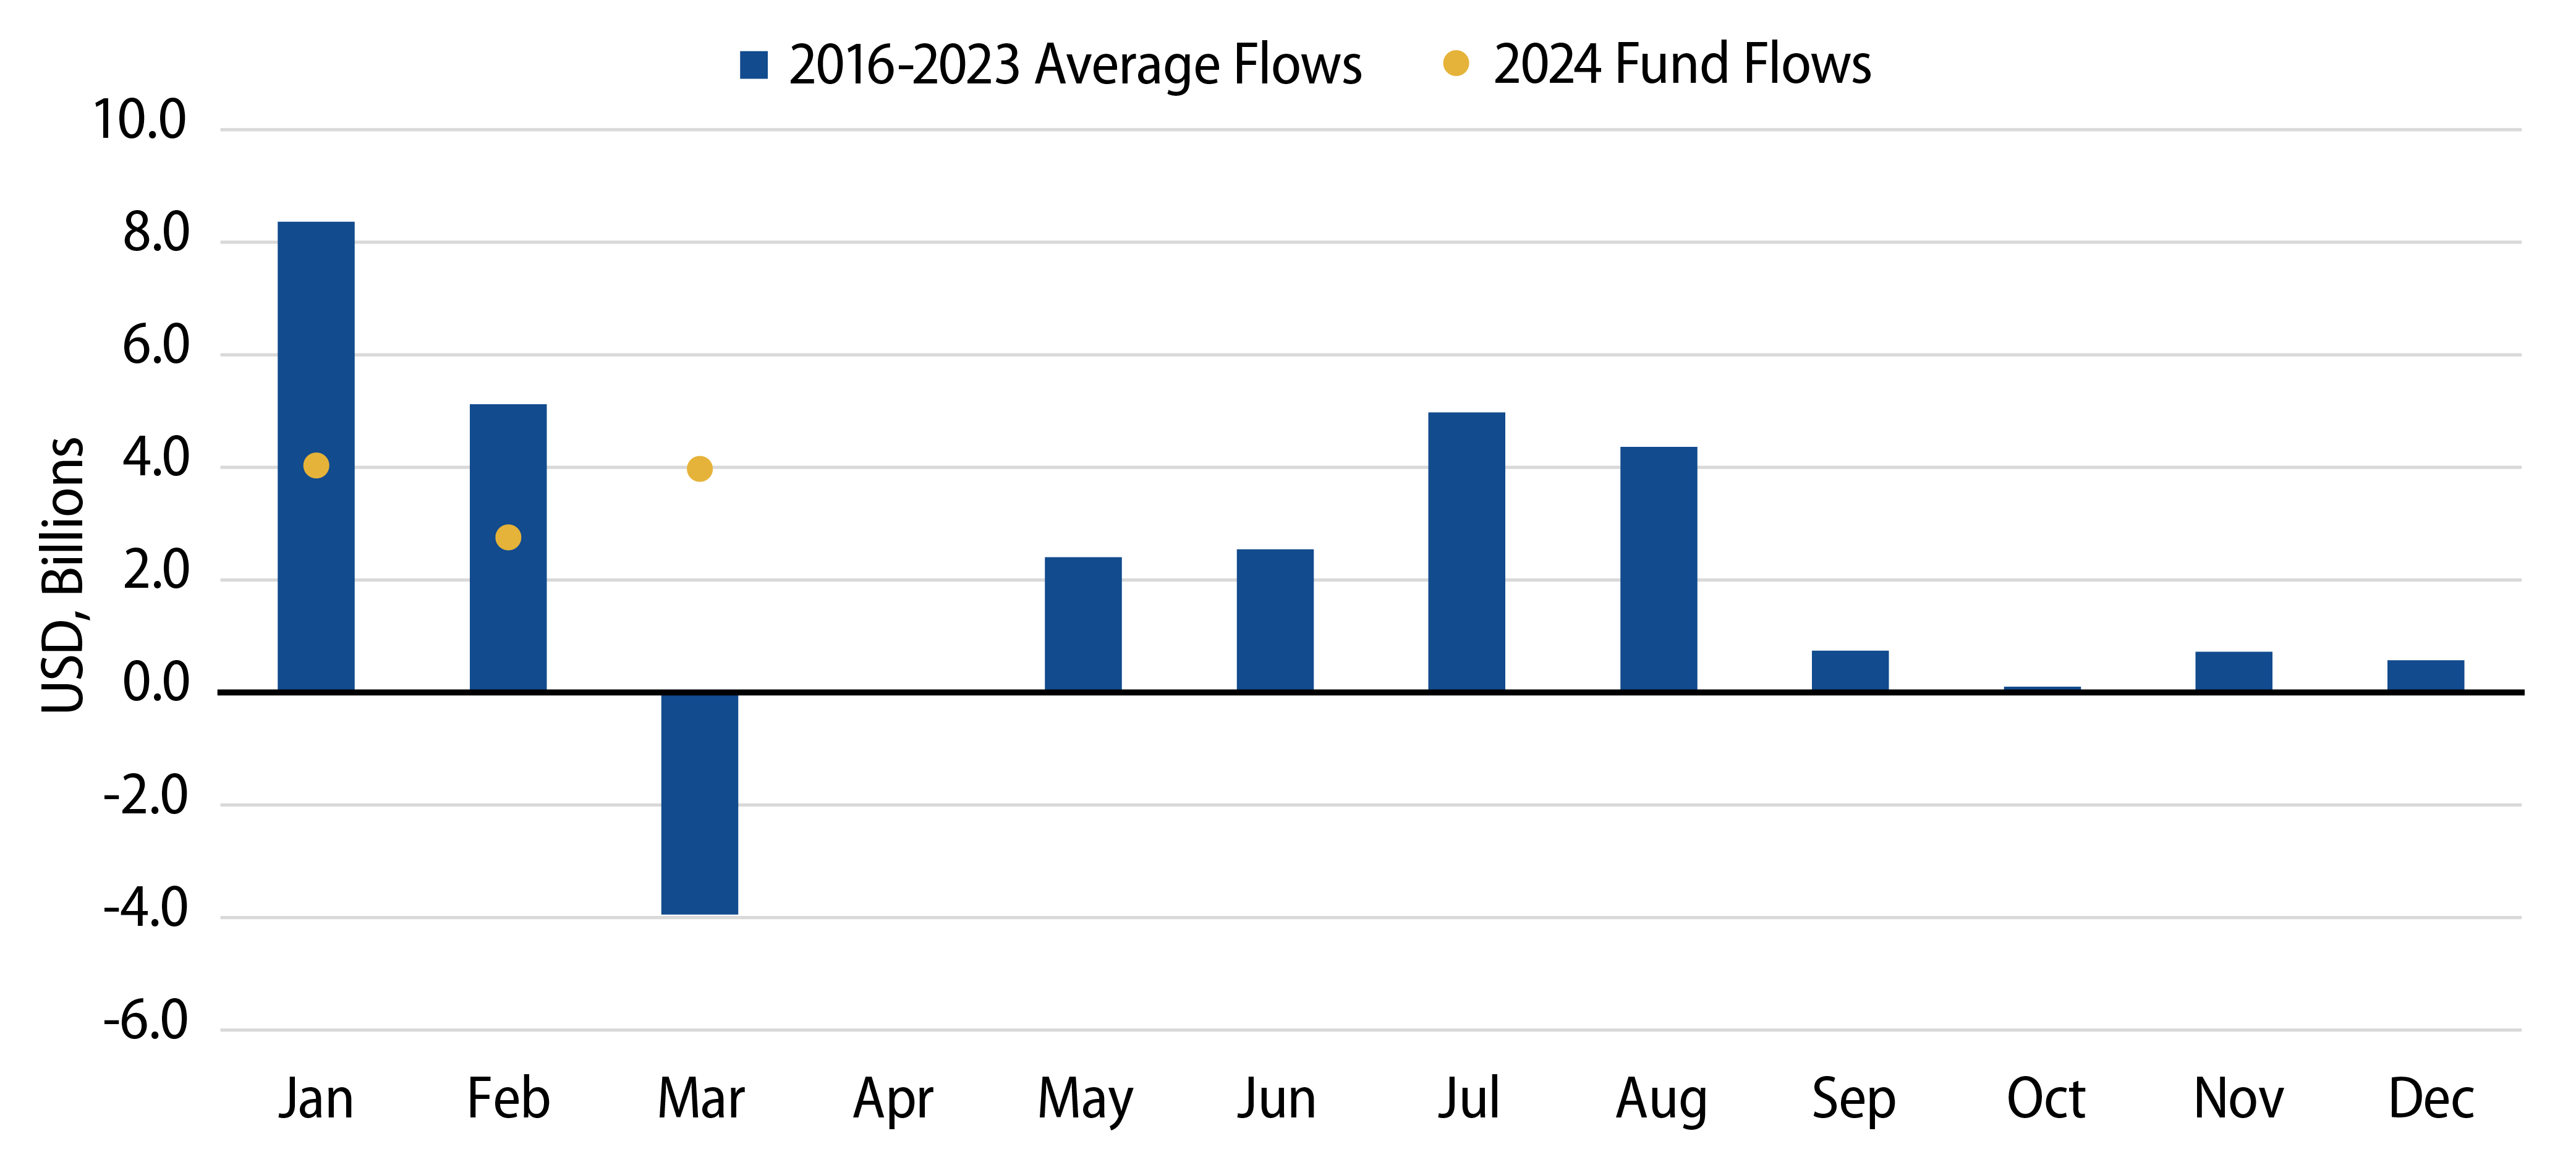
Seasonal demand weakness ahead of Tax Day historically has been characterized by high-net-worth individuals selling municipal allocations to fund tax liabilities. From 2013 to 2023, municipal mutual funds recorded an average $4 billion of outflows in March, while all other months averaged net inflows. March 2024 demand contrasted with seasonal history as municipal mutual funds recorded $4 billion of net inflows, signaling that more investors appeared to take advantage of the relatively high taxable-equivalent yields than those who may have redeemed for tax purposes.
With tax season behind us, we believe investors facing potentially elevated wealth levels could consider higher muni allocations to minimize future tax liabilities. We also expect tax policy to become more of a focus in this year’s election cycle. The tax cuts that were put in place as part of the 2017 Tax Cuts and Jobs Act are slated to expire in 2025, which would increase the top federal tax rate to 39.7% (from 37%) and improve the relative value of tax-exempt municipal debt. The prospects of higher tax rates in the future could potentially build on the positive demand we have observed this year.
Municipal Credit Curves and Relative Value

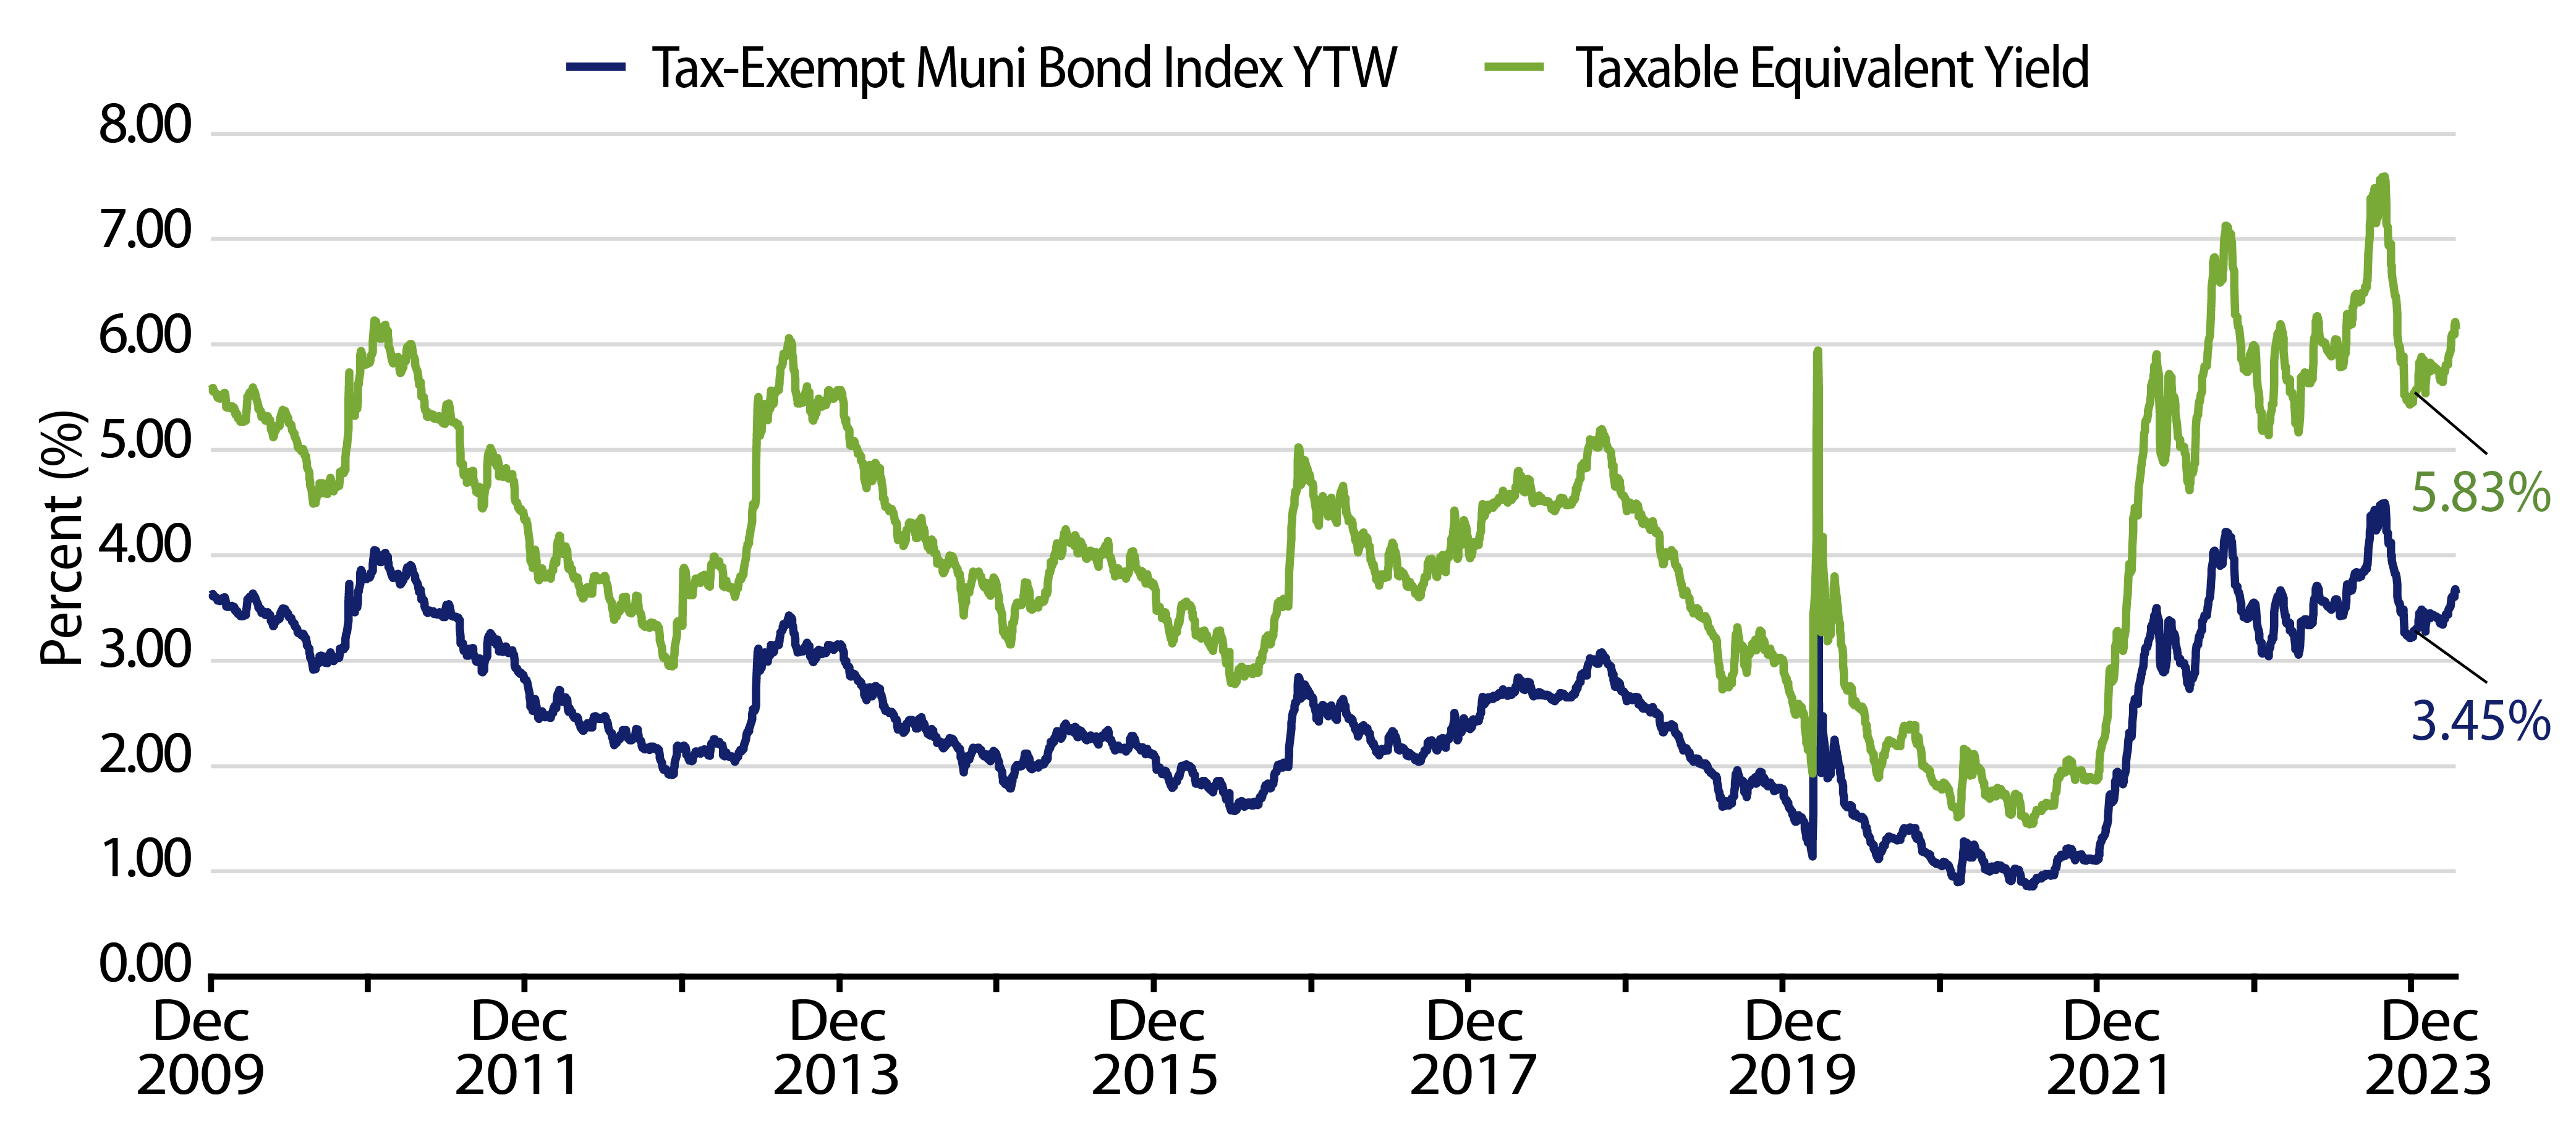
Theme #1: Municipal taxable-equivalent yields are above decade averages.
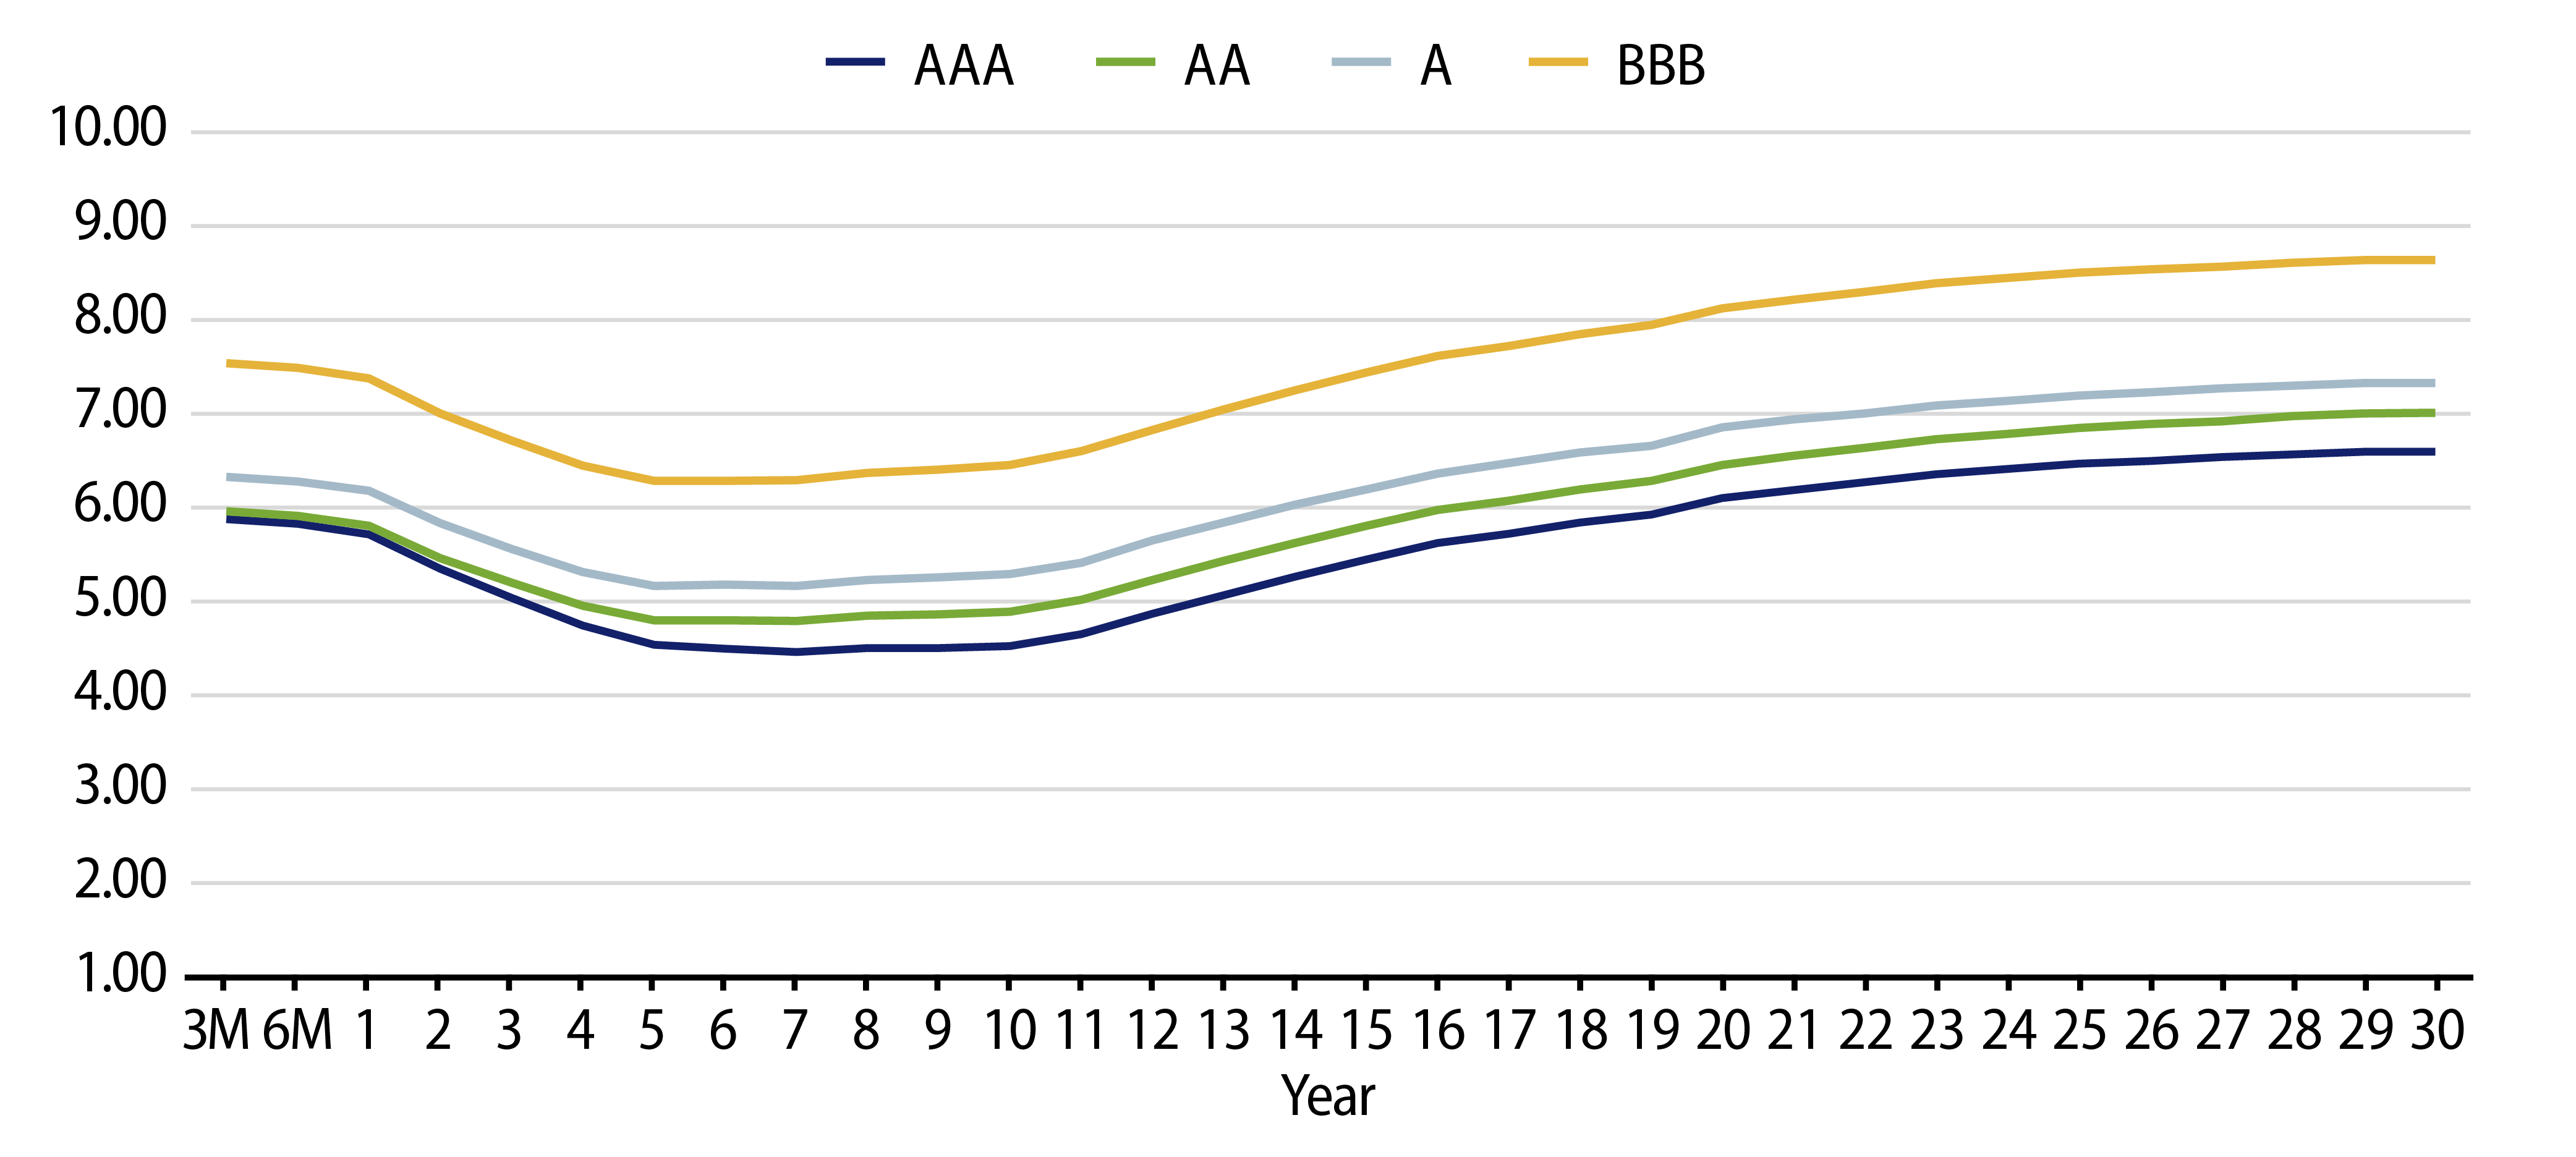
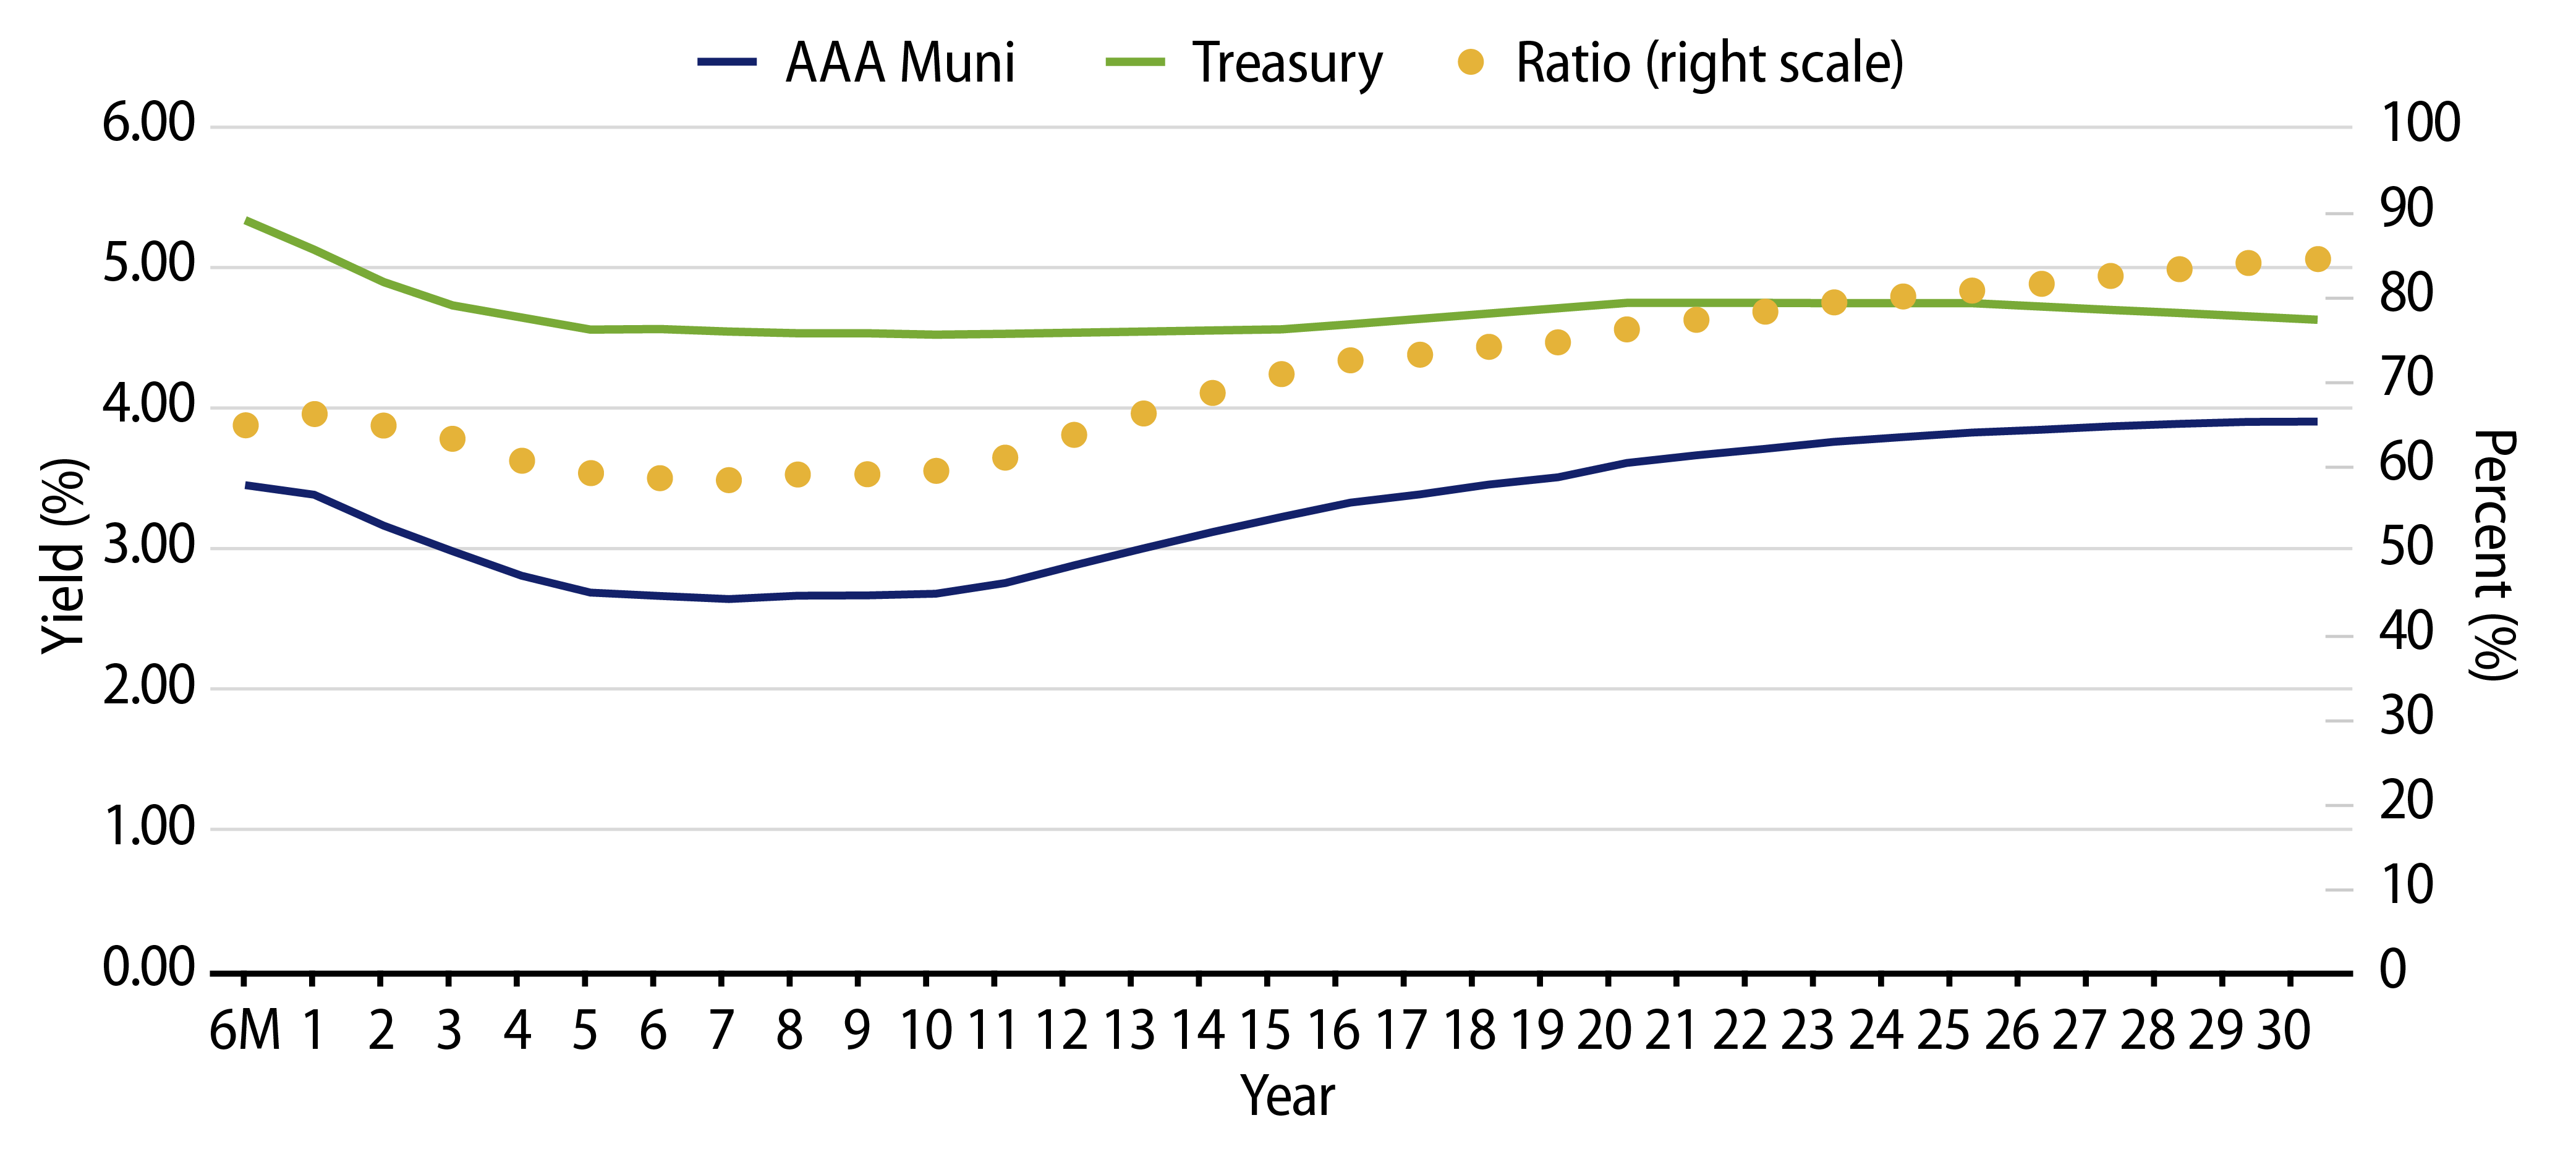
Theme #2: The inverted yield curve suggests less relative value in 5- and 10-year maturities.
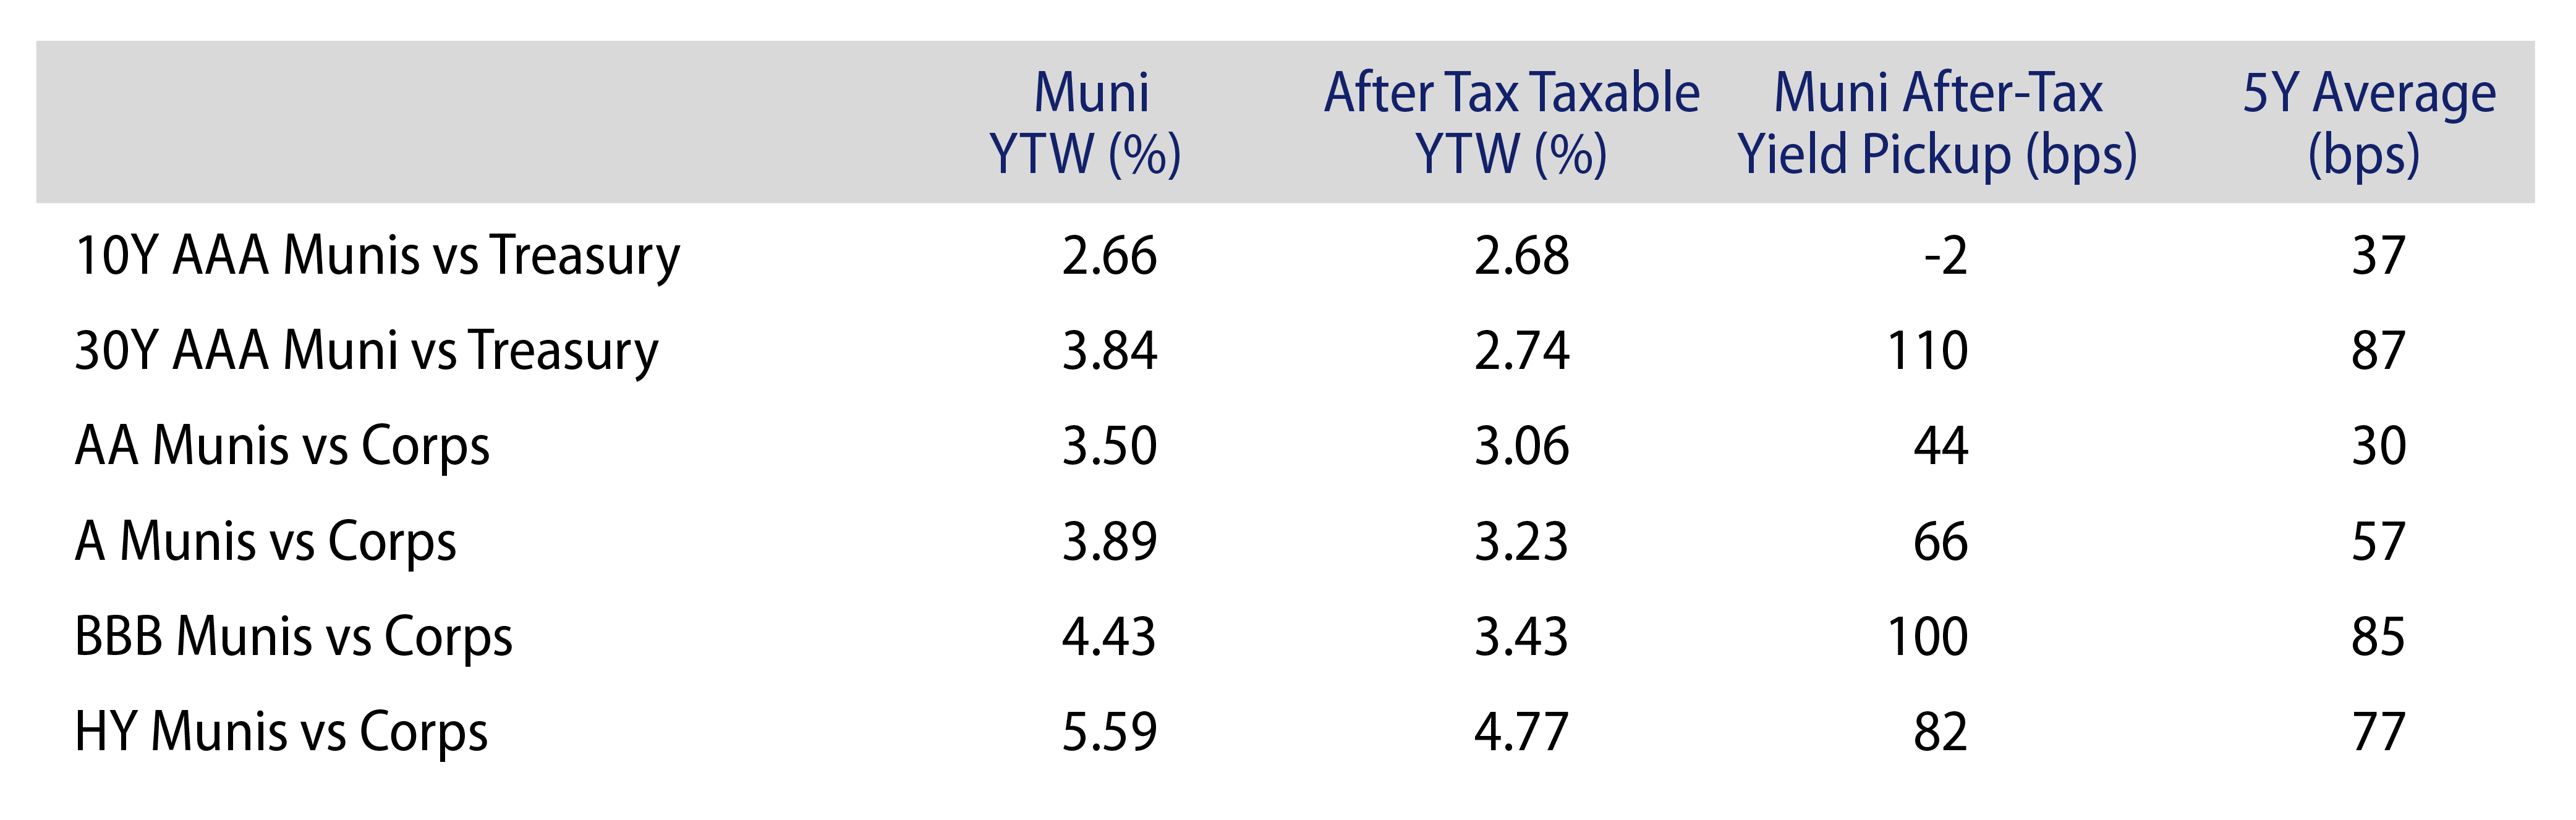
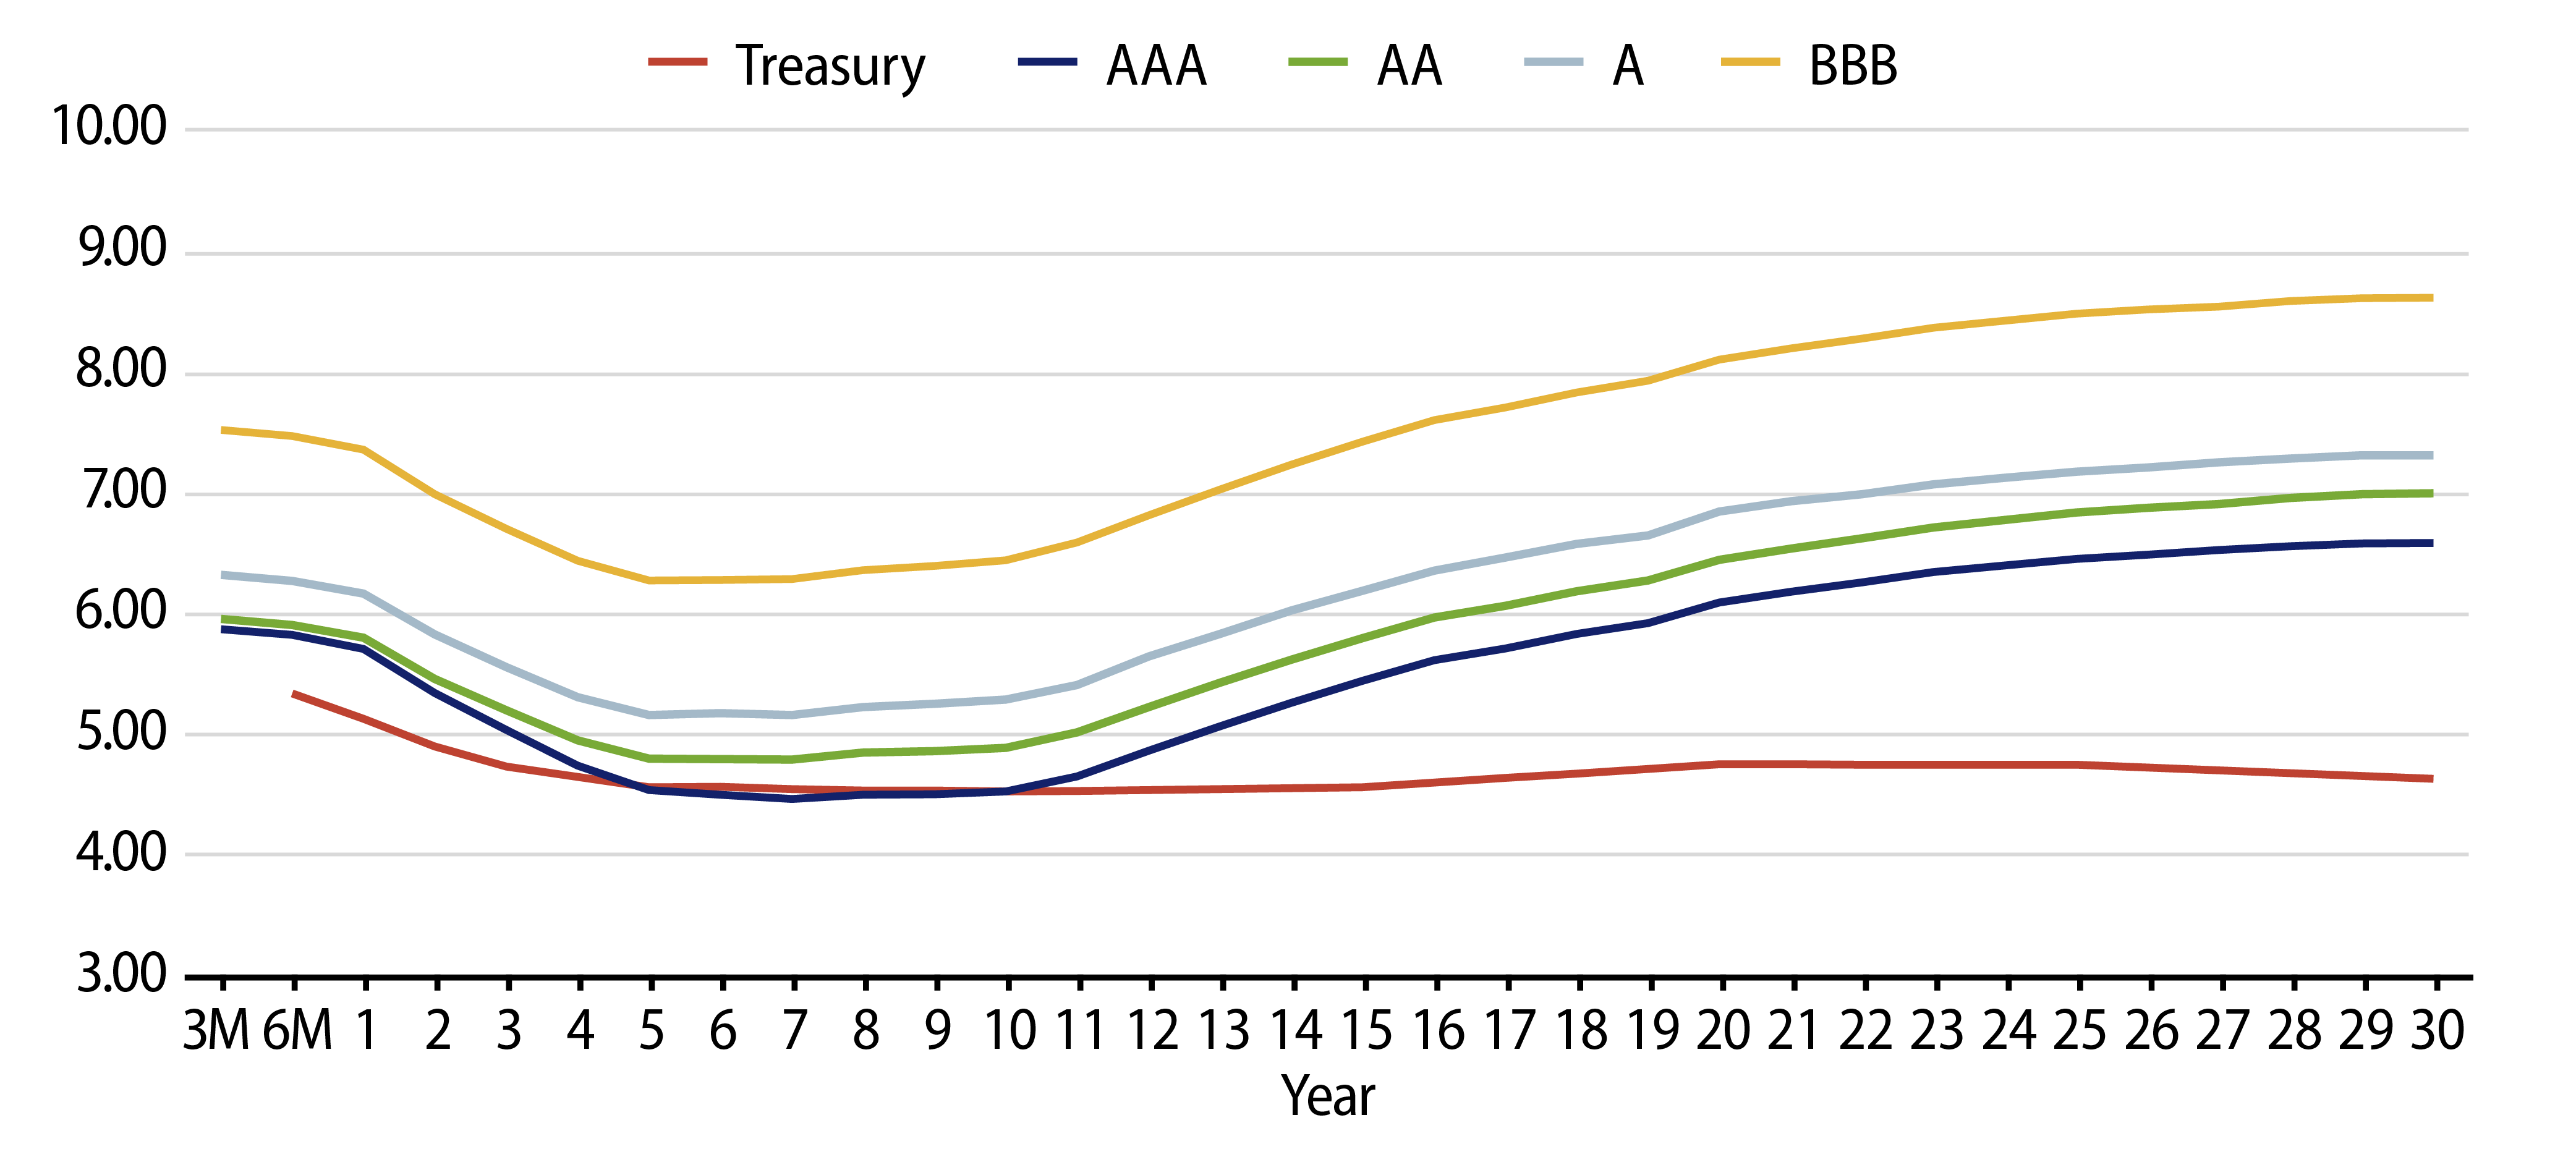
Theme #3: Munis offer attractive after-tax yield pickup versus long Treasuries and corporate credit.