skip navigation
Blog

Stay up to date on timely topics and market events. Subscribe to our Blog now.

MARKETS
08 April 2025

Weekly Municipal Monitor—Tax Season Technical Weakness

By Sam Weitzman

Stay up to date on timely topics and market events. Subscribe to our Blog now.

Macros, Markets and Munis

Municipals posted positive returns last week as Treasury yields fell over 20 basis points (bps) across the yield curve. Munis generally outperformed, particularly in 5- and 10-year maturities where yields moved over 30 bps lower. Market volatility and risk-off sentiment spiked following President Trump’s broad-based tariff announcement. From an economic data standpoint, nonfarm payrolls handily exceeded expectations, but the strong jobs report was muted relative to the longer-term growth concerns associated with tariff policies. Meanwhile, technicals remained challenged by elevated supply and fund outflows. This week we highlight traditionally challenged technicals observed during tax season.

Elevated Supply and Fund Outflows Persisted Ahead of Tax Day

Fund Flows (down $232 million): During the week ending April 2, weekly reporting municipal mutual funds recorded $232 million of net outflows, according to Lipper. Long-term funds recorded $364 million of outflows, intermediate funds recorded $44 million of outflows and high-yield funds recorded $96 million of outflows. Last week’s outflows marked a fourth consecutive week of net outflows amid the seasonal tax season weakness and led year-to-date (YTD) inflows lower to $10 billion.

Supply (YTD supply of $134 billion; up 34% YoY): The muni market recorded $13 billion of new-issue supply last week, nearly double the prior week’s issuance. YTD, the muni market has recorded $134 billion of new issuance, up 34% year-over-year (YoY). Tax-exempt and taxable issuance are up 33% and 45% respectively, though tax-exempt issuance has comprised the vast majority (95%) of YTD supply. This week’s calendar is expected to increase and remain elevated at $12 billion. The largest deals include $1.75 billion taxable New York City General Obligations and $1.5 billion tax-exempt New York City General Obligation transactions.

This Week in Munis: Tax Season Technical Weakness

The municipal market sold off in March and returned -1.69% while most taxable fixed-income sectors posted positive returns. Historically, the weeks leading up to the April 15 tax day have been challenging for the municipal market, often due to weaker supply and demand dynamics. From 2009 to 2024, the Bloomberg Muni Bond Index returned an average -0.17% during the month of March, the second lowest average return across months.

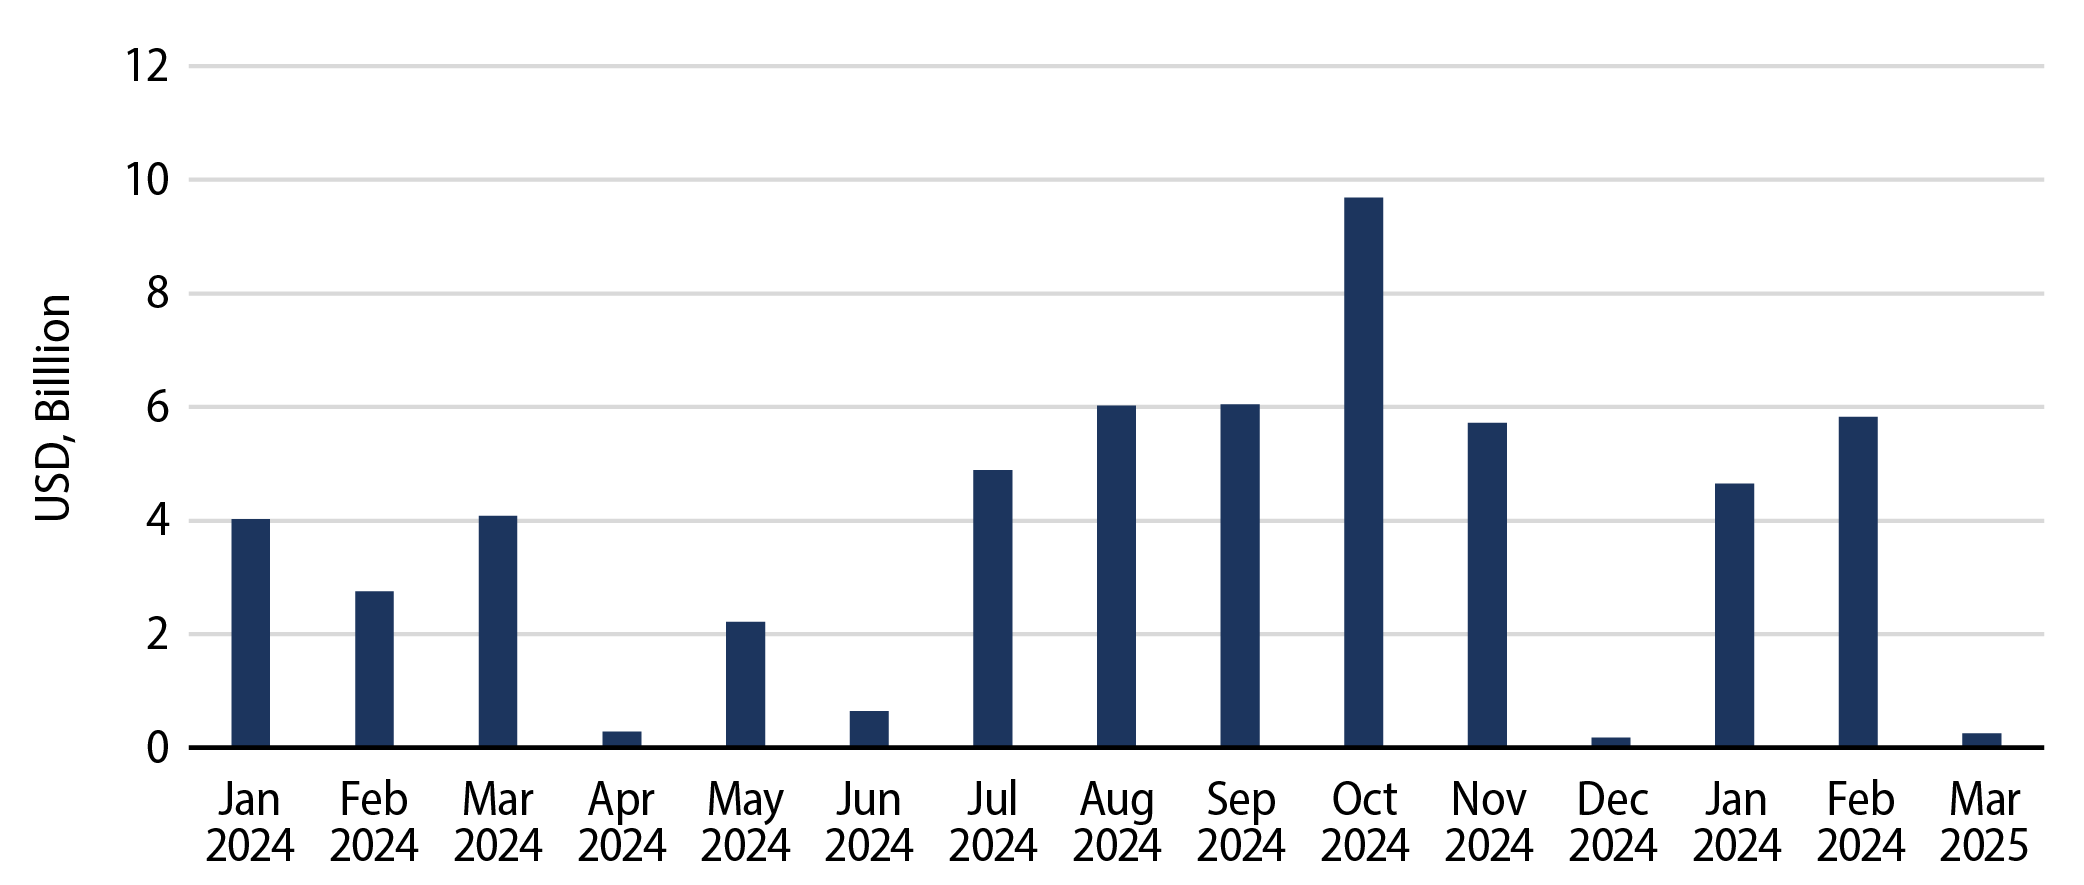
A key factor contributing to the weakened demand for municipal securities during March and April is the increasing selling activity by taxpayers that liquidate their municipal holdings to cover tax liabilities. This year, the demand for munis diminished after a period of consistent fund inflows since the start of 2024. According to Lipper, weekly and monthly reporting muni mutual funds recorded $1 billion in outflows during March. Additionally, the Investment Company Institute (ICI) weekly estimates indicated a significant drop in municipal fund inflows to $252 million in March, a sharp decline from the $4.6 billion and $5.8 billion of inflows recorded in January and February, respectively.

Exhibit 1: Municipal Mutual Fund Flows
Municipal Mutual Fund Flows
Source: ICI, Bloomberg, Western Asset. As of 26 Mar 25. Select the image to expand the view.

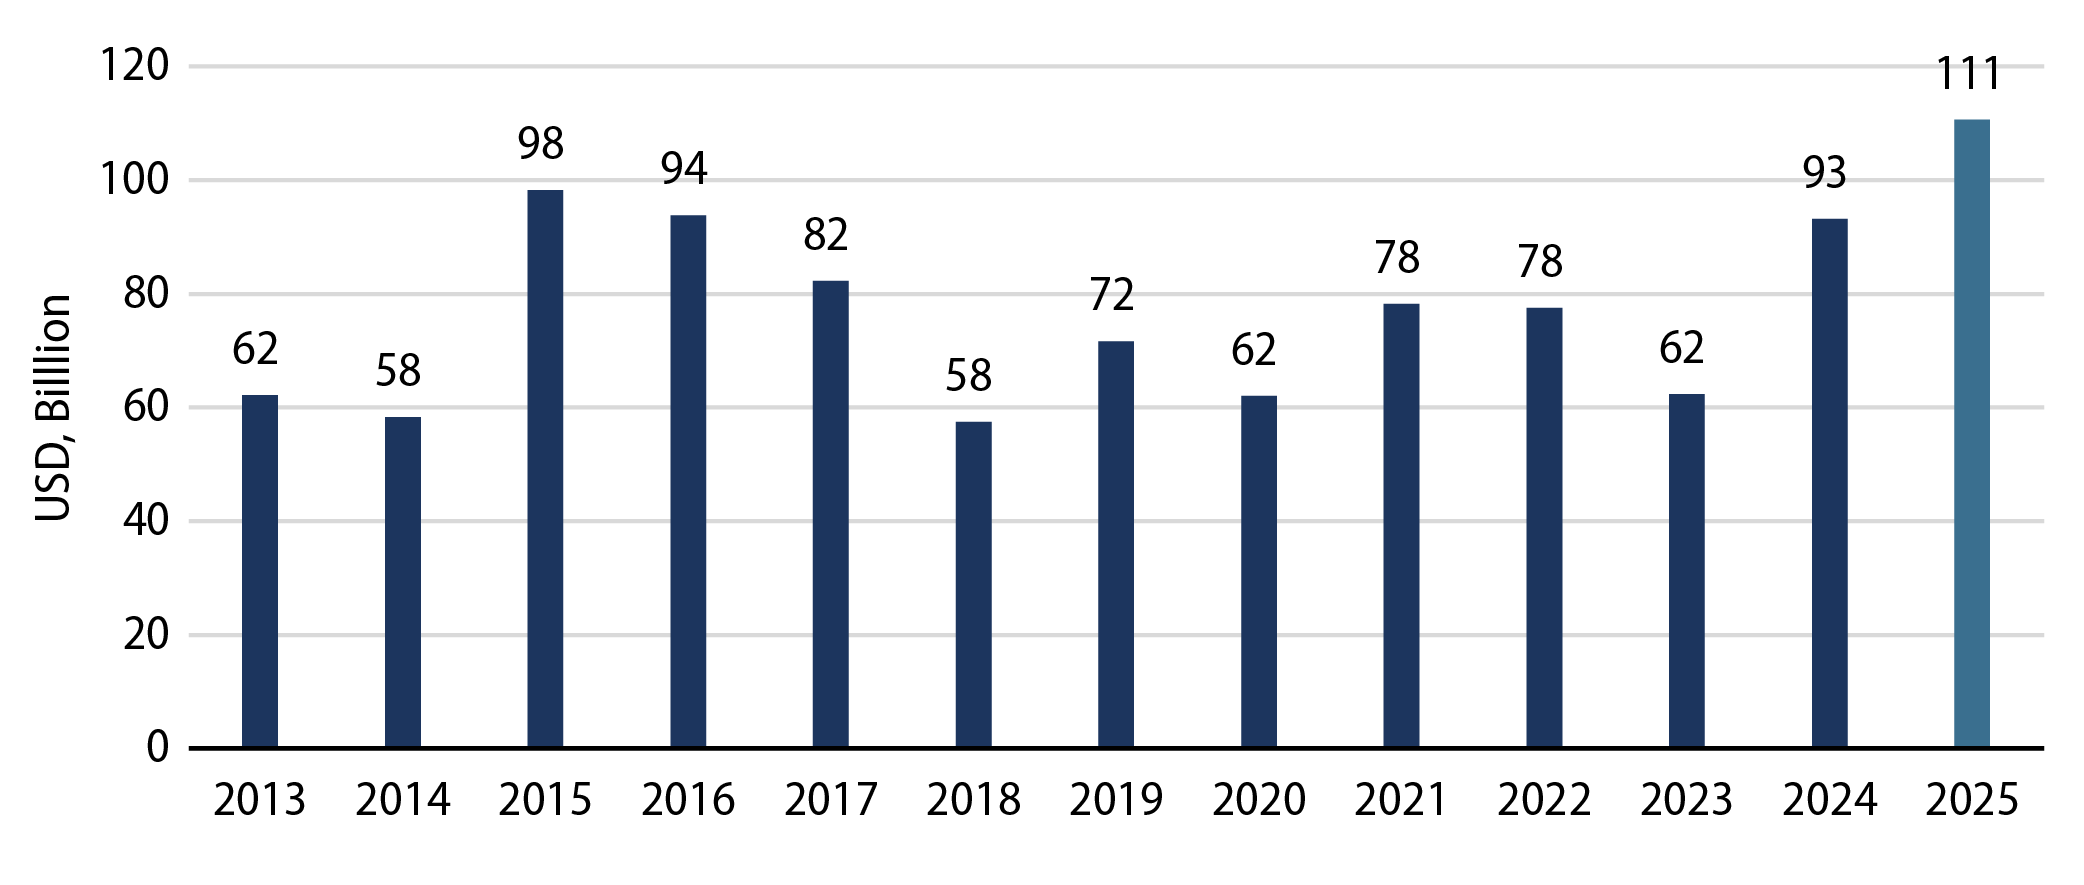
In addition to weaker demand conditions, municipal supply in March tends to be above average and weighs on technicals. March 2025 issuance reached $43 billion, up 15% from the prior year that ultimately represented a record year for muni issuance. The muni market has been dealing with a significant increase in supply throughout the year, with total issuance reaching $111 billion through the first quarter, a 19% increase compared to Q1 2024.

Exhibit 2: First-Quarter 2025 Tax-Exempt Muni Issuance
First-Quarter 2025 Tax-Exempt Muni Issuance
Source: Bloomberg, Western Asset. As of 31 Mar 25. Select the image to expand the view.

The sharp underperformance of the muni asset class in March has contributed to improved tax-exempt income and after-tax relative value opportunities. The Bloomberg Municipal Bond Index average yield-to-worst ended the year at 3.85%, up over 50 bps from the start of the year and equivalent to 6.50% on a taxable-equivalent basis when considering the highest federal income tax bracket. These improved tax-exempt income opportunities have contributed to better after-tax yield pickup versus taxable fixed-income alternatives. From our perspective, tax-exempt munis support a particularly attractive risk-adjusted value proposition considering the volatile market backdrop.

Municipal Credit Curves and Relative Value

Exhibit 3: Muni Credit Curves
Muni Credit Curves
Source: Bloomberg, Western Asset. As of 04 Apr 25. Bloomberg Valuation Service (BVAL) Municipal Credit Indices (AAA, AA, A, BBB, respectively) and US Sovereign Curves. Taxable-Equivalent Muni Credit Curves consider the top marginal effective tax rate of 40.8%. AA Muni is represented by the US General Obligation AA Muni BVAL Yield Curve. The BVAL curve is populated with pricing from uninsured AA General Obligation bonds. A Muni is represented by the US General Obligation A Muni BVAL Yield Curve. The BVAL curve is populated with pricing from uninsured A General Obligation bonds. BBB Muni is represented by the US General Obligation BBB Muni BVAL Yield Curve. The BVAL curve is populated with pricing from uninsured BBB General Obligation bonds. Indices are unmanaged and one cannot directly invest in them. They do not include fees, expenses or sales charges. Past performance is not an indicator or a guarantee of future results. Select the image to expand the view.
Exhibit 4: Taxable-Equivalent Muni Credit Curves
Taxable-Equivalent Muni Credit Curves
Source: Bloomberg, Western Asset. As of 04 Apr 25. Bloomberg Valuation Service (BVAL) Municipal Credit Indices (AAA, AA, A, BBB, respectively) and US Sovereign Curves. Taxable-Equivalent Muni Credit Curves consider the top marginal effective tax rate of 40.8%. AA Muni is represented by the US General Obligation AA Muni BVAL Yield Curve. The BVAL curve is populated with pricing from uninsured AA General Obligation bonds. A Muni is represented by the US General Obligation A Muni BVAL Yield Curve. The BVAL curve is populated with pricing from uninsured A General Obligation bonds. BBB Muni is represented by the US General Obligation BBB Muni BVAL Yield Curve. The BVAL curve is populated with pricing from uninsured BBB General Obligation bonds. Indices are unmanaged and one cannot directly invest in them. They do not include fees, expenses or sales charges. Past performance is not an indicator or a guarantee of future results. Select the image to expand the view.
Exhibit 5: AAA Munis vs. Treasuries
AAA Munis vs. Treasuries
Source: Muni Yields: Thomson Reuters MMD, Treasury Yields: Bloomberg. As of 04 Apr 25. Past performance is not a guarantee of future results. It is not possible to invest directly in an index. Select the image to expand the view.
Exhibit 6: Tax-Exempt and Taxable Muni Valuations
Tax-Exempt and Taxable Muni Valuations
Source: Bloomberg, Western Asset. As of 04 Apr 25. Yield-to-worst (YTW) is the lowest potential yield that can be received on a bond without the issuer actually defaulting. AAA, AA, A, BBB Corporate Indices; After-Tax Yield assumes a top effective tax rate of 40.8%. Taxable Muni Index Corporate comparable used is the Global Corporate Aggregate (ex. BBB) to better align credit quality and duration. Select the image to expand the view.

Western Asset Key Themes for Muni Investors

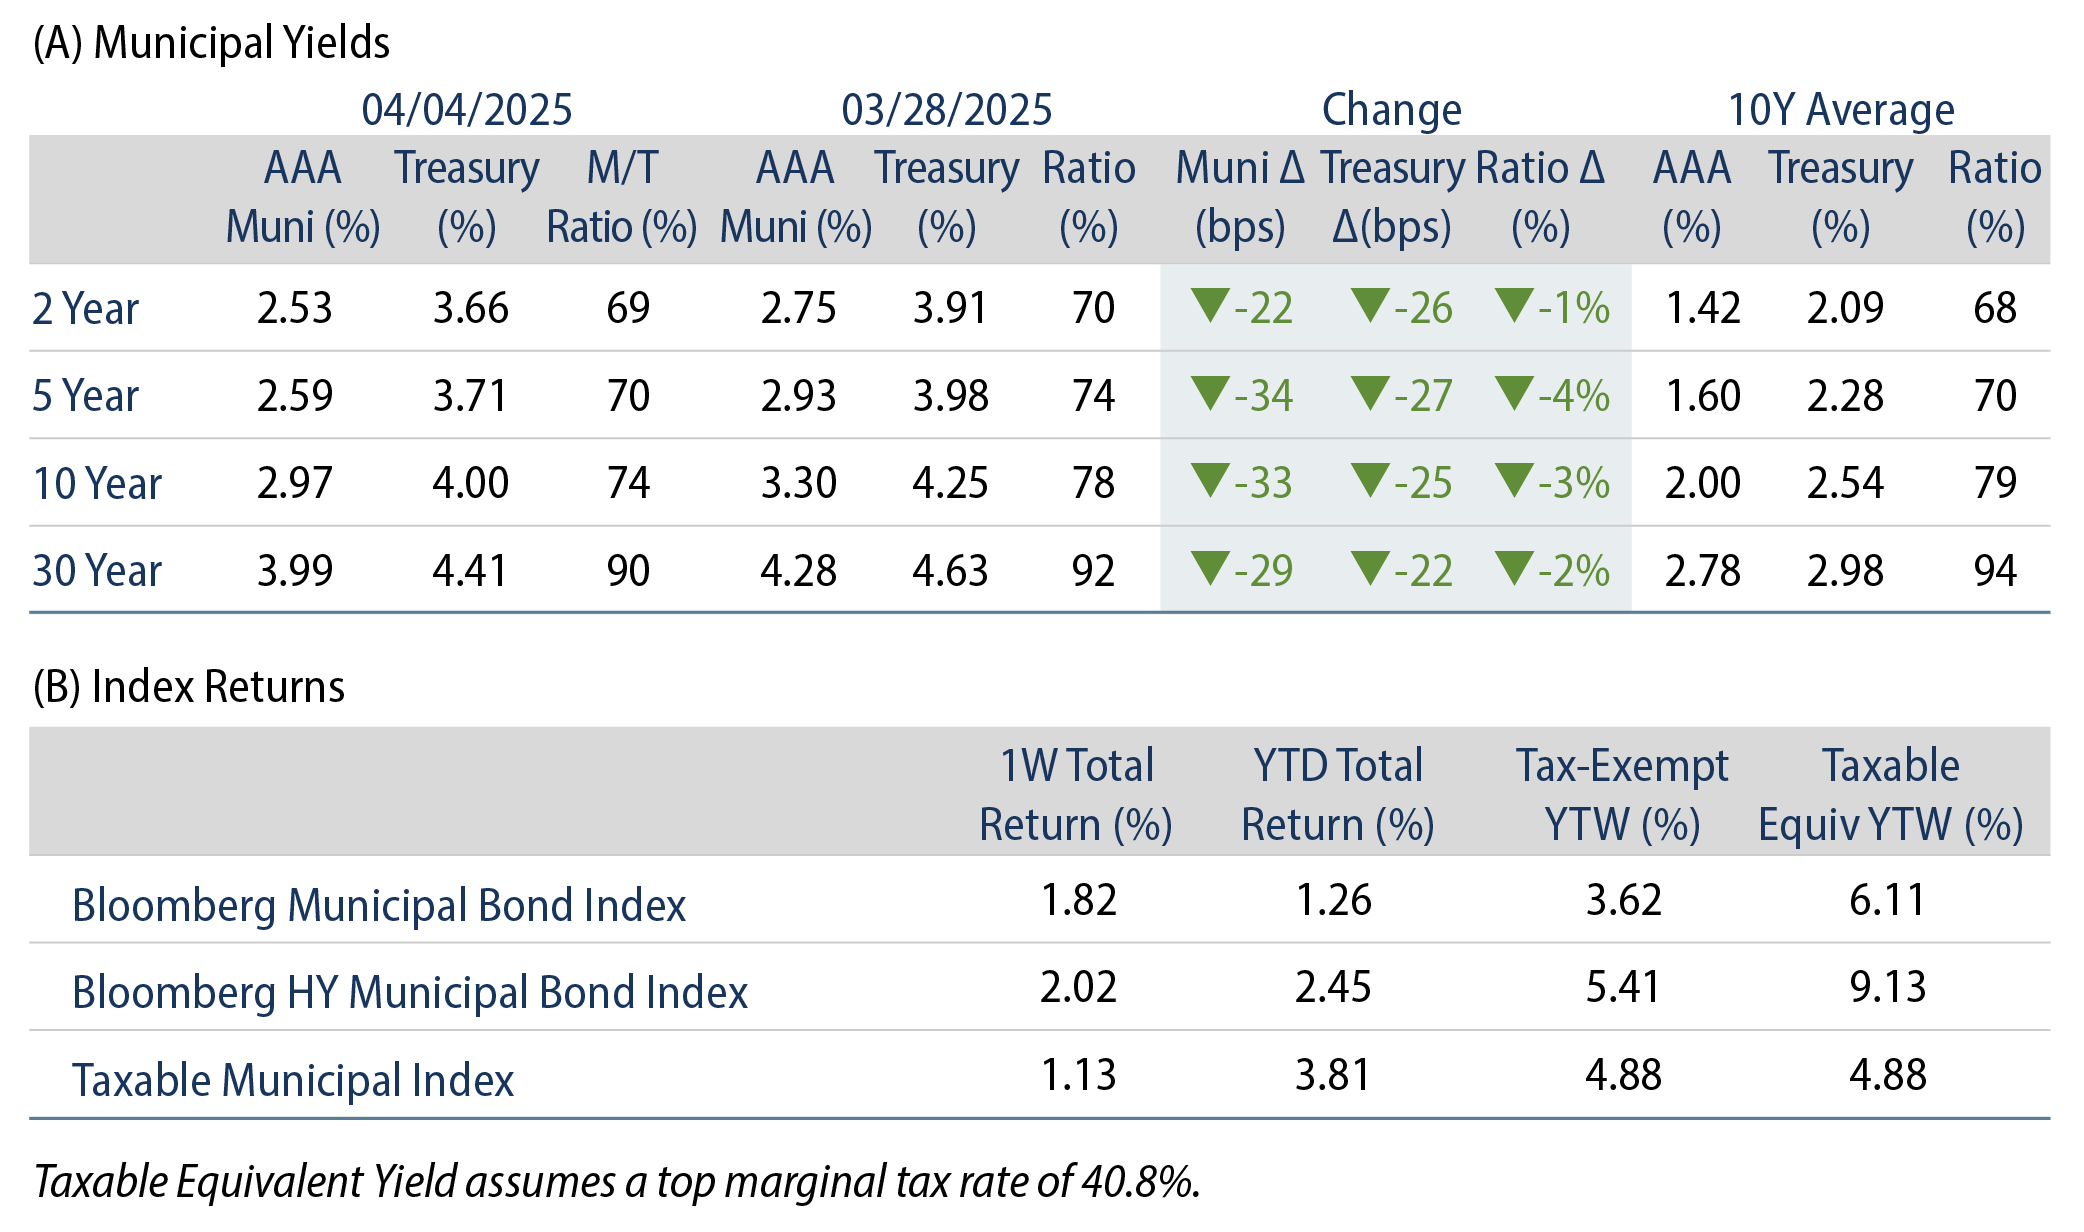
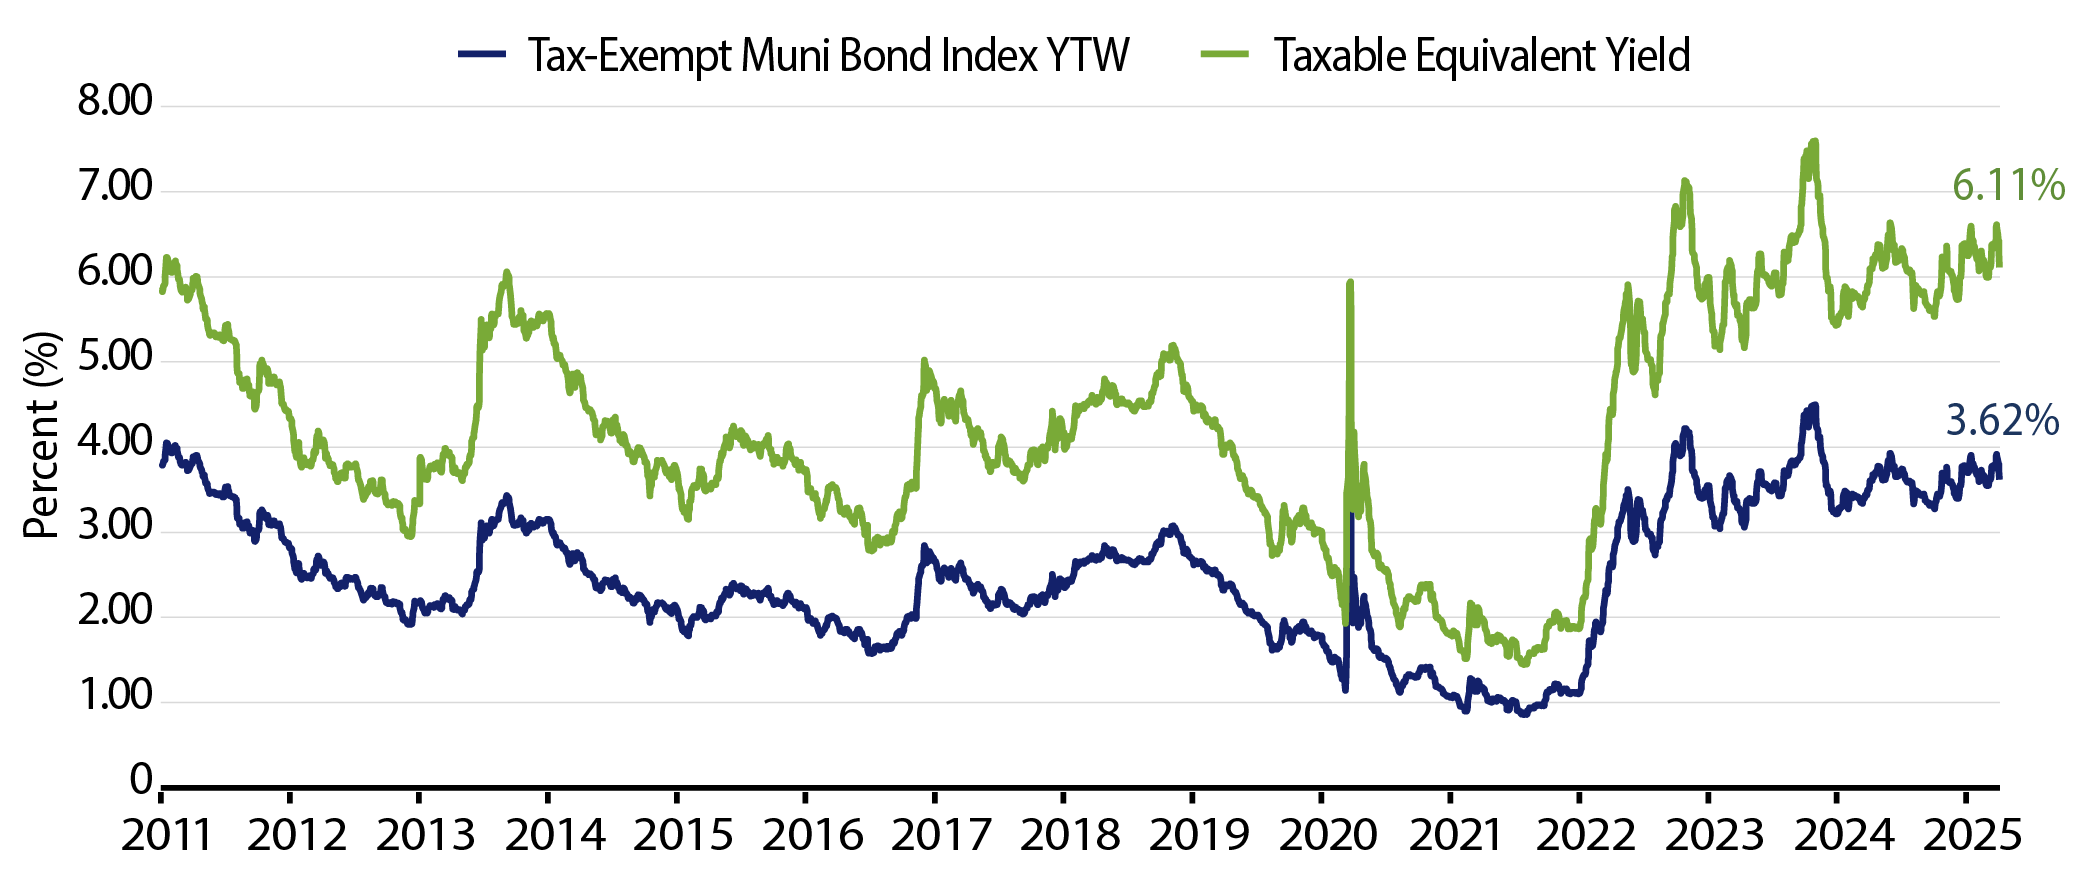
Theme #1: Municipal taxable-equivalent yields and income opportunities remain above decade averages.

Exhibit 7: Muni and Taxable-Equivalent Muni Yield-to-Worst
Muni and Taxable-Equivalent Muni Yield-to-Worst
Source: Bloomberg, Western Asset. As of 04 Apr 25. Bloomberg Municipal Bond Index yield considering highest marginal tax rate of 40.8%. Indexes are unmanaged and one cannot directly invest in them. They do not include fees, expenses or sales charges. Past performance is not an indicator or a guarantee of future results. Select the image to expand the view.

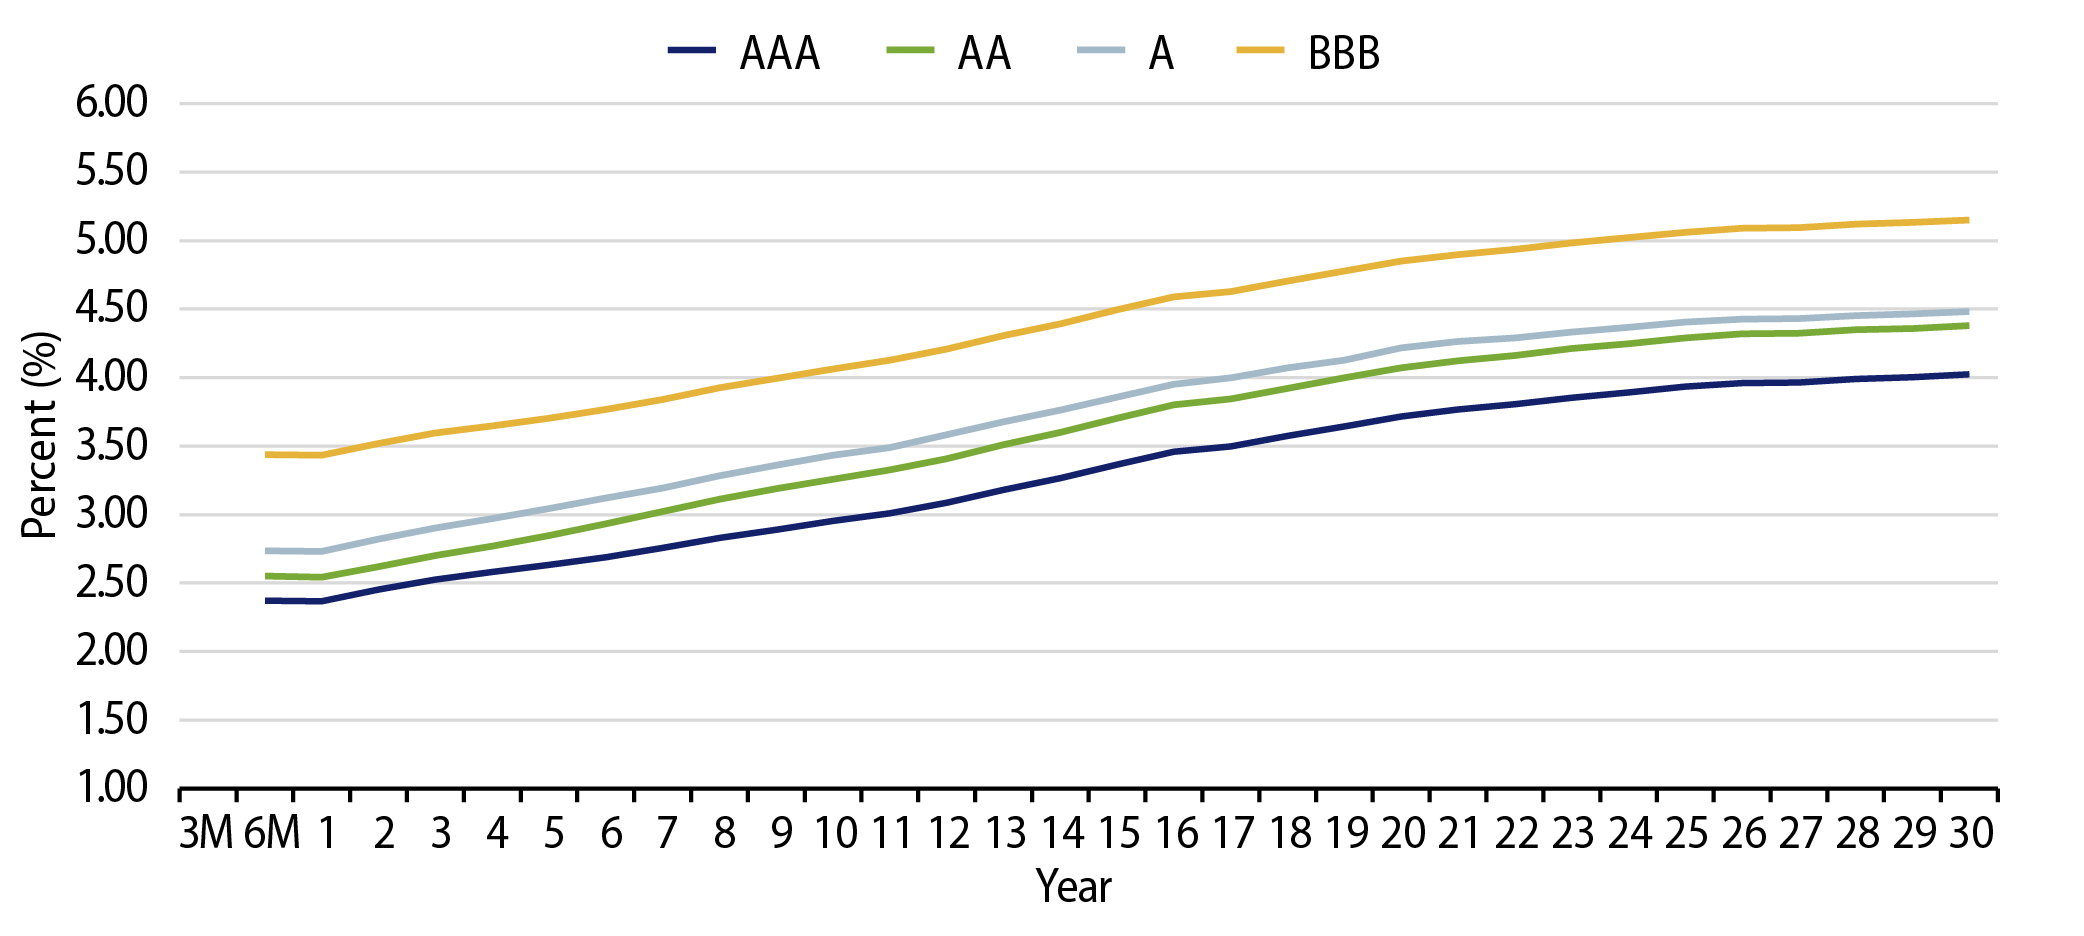
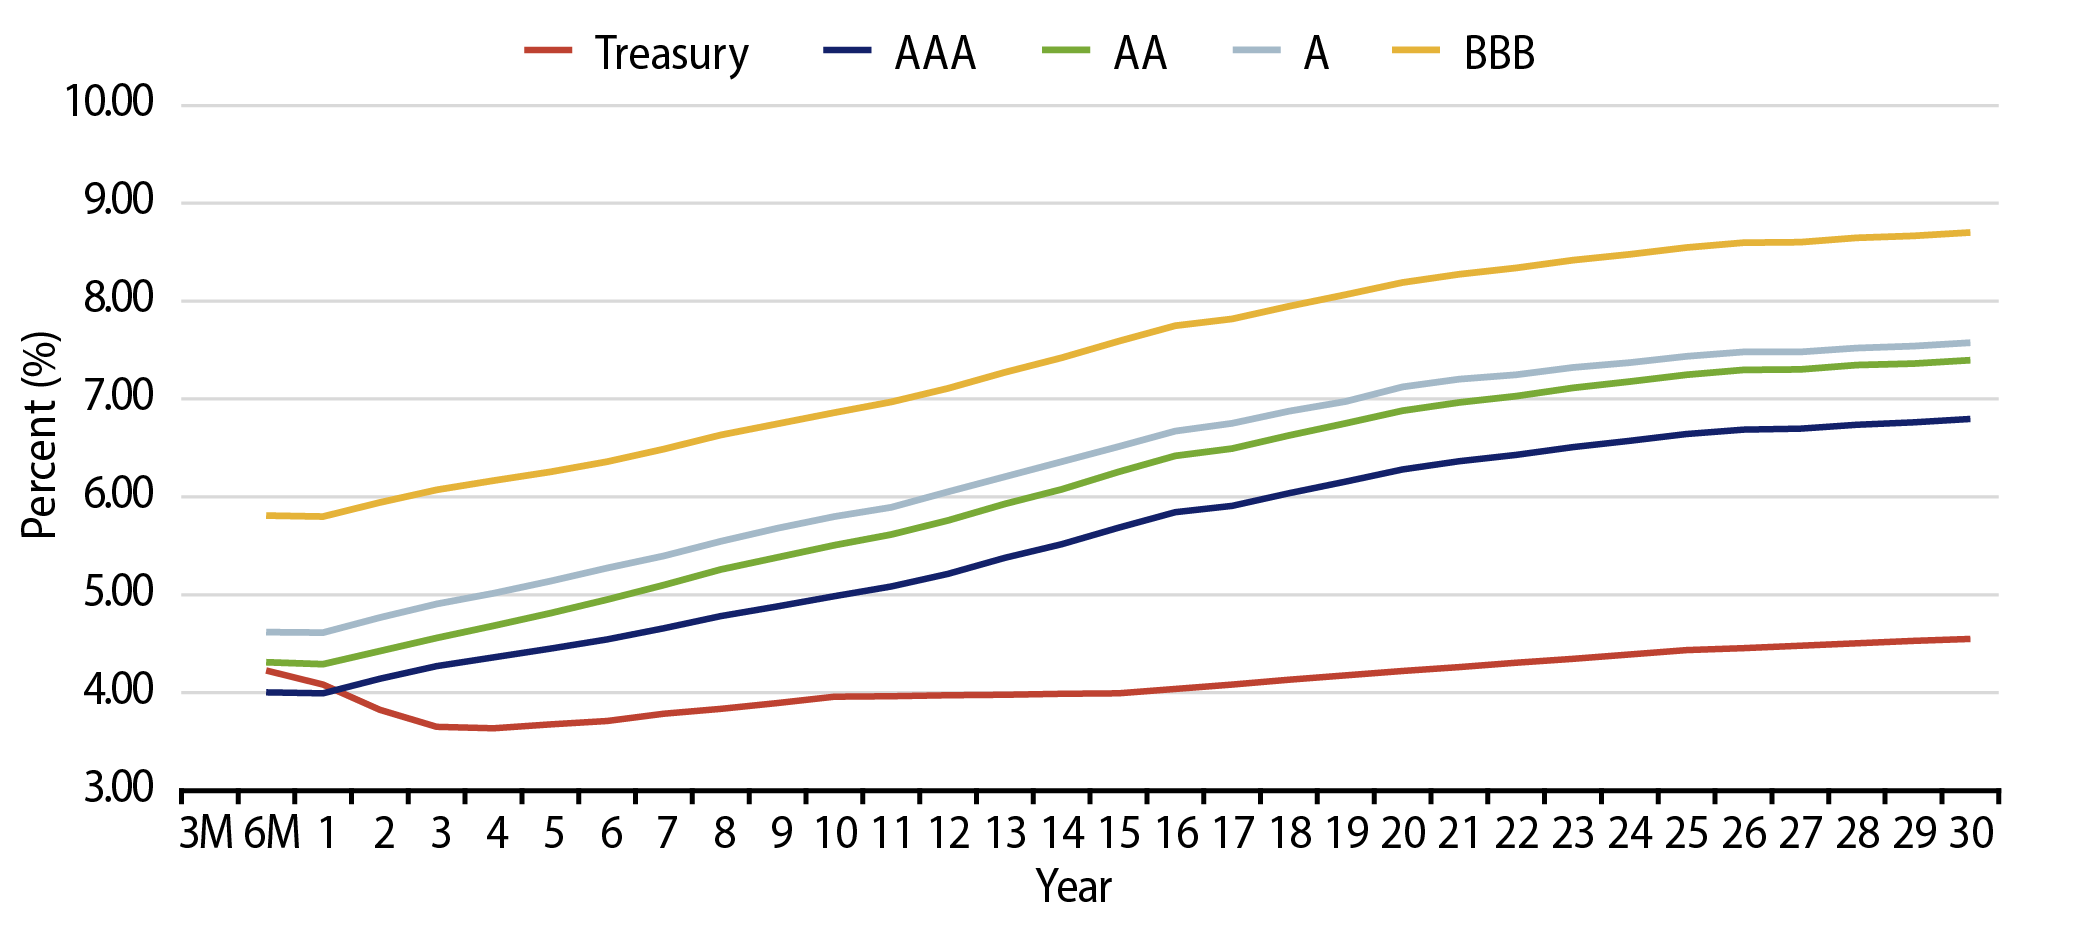
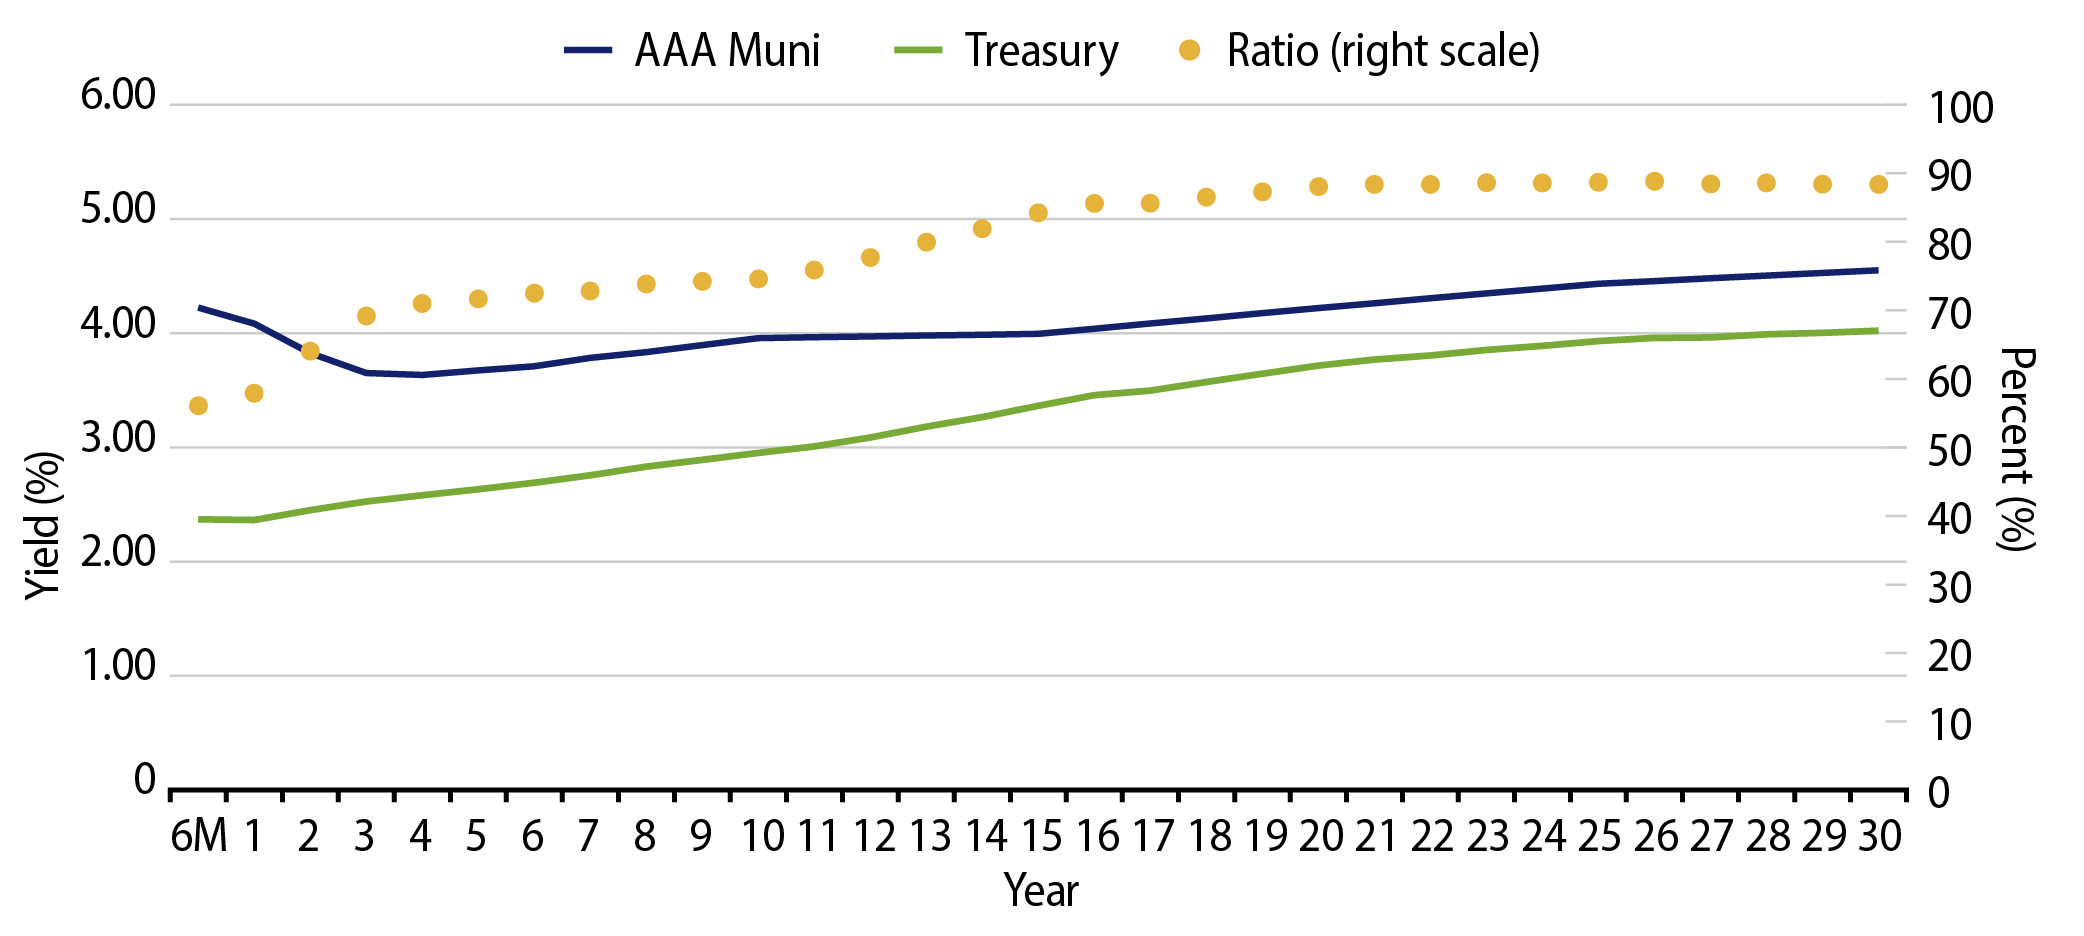
Theme #2: The muni curve has steepened, offering better value in intermediate and longer maturities.

Exhibit 8: AAA Municipal vs. Treasury Yield Curves
AAA Municipal vs. Treasury Yield Curves
Source: Bloomberg, Western Asset. As of 04 Apr 25. Bloomberg Valuation Service (BVAL) AAA Muni Curve and US On-/Off-the-Run Sovereign Curve. Indexes are unmanaged and one cannot directly invest in them. They do not include fees, expenses or sales charges. Past performance is not an indicator or a guarantee of future results. Select the image to expand the view.

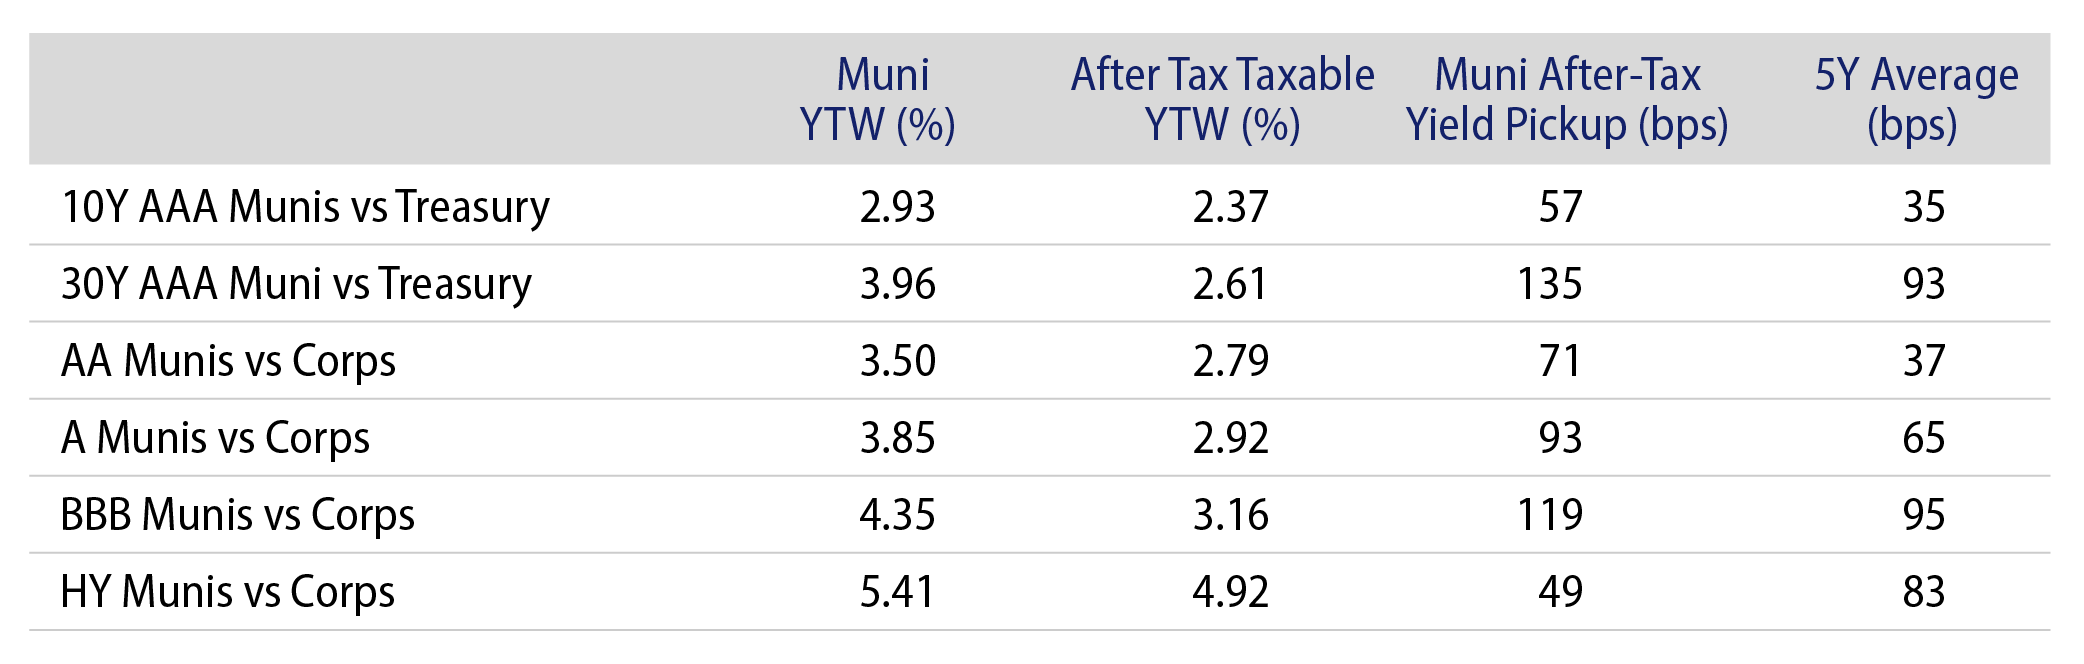
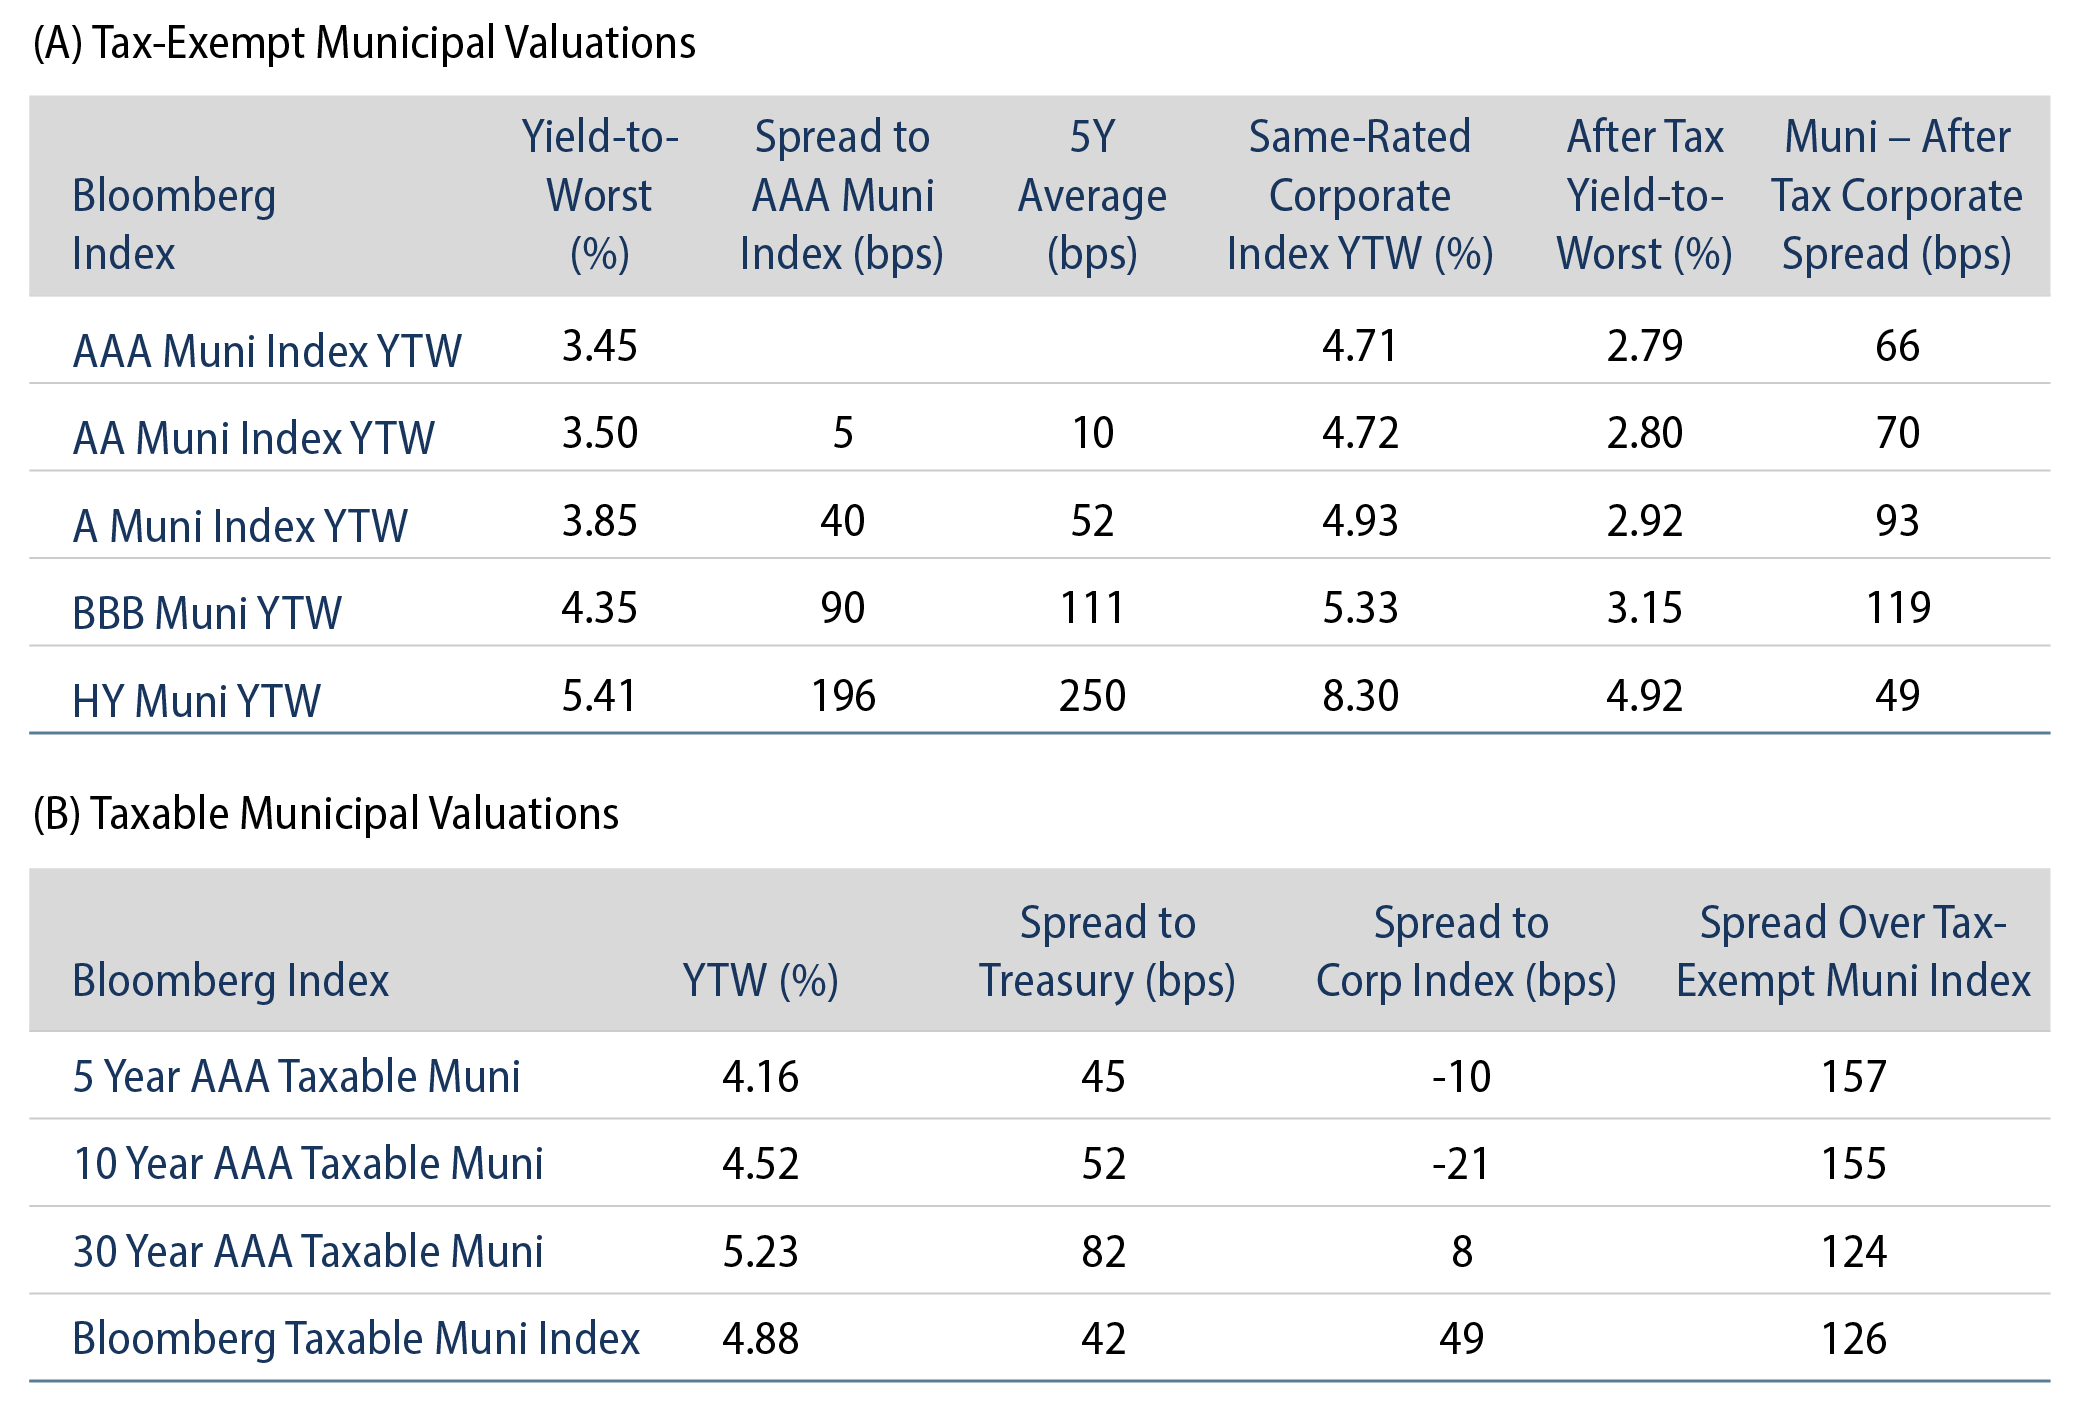
Theme #3: Munis offer attractive after-tax yield pickup versus longer-dated Treasuries and investment-grade corporate credit.

Exhibit 9: Municipal vs. Taxable Fixed-Income Yields by Quality
Municipal vs. Taxable Fixed-Income Yields by Quality
Source: Western Asset, Bloomberg. As 04 Apr 25. 10- and 30-Year comparison reflects Bloomberg Valuation Service (BVAL) AAA Muni Curve and US On-/Off-the-Run Sovereign Curve. AA Muni reflects the Bloomberg AA Muni Bond Index. A Muni reflects the Bloomberg A Muni Bond Index. BBB Muni reflects the Bloomberg BBB Muni Bond Index. HY Muni reflects the Bloomberg High Yield Muni Bond Index. AA Corp reflects the Bloomberg AA Corporate Bond Index. A Corp reflects the Bloomberg A Corporate Bond Index. BBB Corp reflects the Bloomberg BBB Corporate Bond Index. After-tax yield considers top marginal tax rate of 40.8%. Indexes are unmanaged and one cannot directly invest in them. They do not include fees, expenses or sales charges. Past performance is not an indicator or a guarantee of future results. Select the image to expand the view.

© Western Asset Management Company, LLC 2025. The information contained in these materials ("the materials") is intended for the exclusive use of the designated recipient ("the recipient"). This information is proprietary and confidential and may contain commercially sensitive information, and may not be copied, reproduced or republished, in whole or in part, without the prior written consent of Western Asset Management Company ("Western Asset").
Past performance does not predict future returns. These materials should not be deemed to be a prediction or projection of future performance. These materials are intended for investment professionals including professional clients, eligible counterparties, and qualified investors only.
These materials have been produced for illustrative and informational purposes only. These materials contain Western Asset's opinions and beliefs as of the date designated on the materials; these views are subject to change and may not reflect real-time market developments and investment views.
Third party data may be used throughout the materials, and this data is believed to be accurate to the best of Western Asset's knowledge at the time of publication, but cannot be guaranteed. These materials may also contain strategy or product awards or rankings from independent third parties or industry publications which are based on unbiased quantitative and/or qualitative information determined independently by each third party or publication. In some cases, Western Asset may subscribe to these third party's standard industry services or publications. These standard subscriptions and services are available to all asset managers and do not influence rankings or awards in any way.
Investment strategies or products discussed herein may involve a high degree of risk, including the loss of some or all capital. Investments in any products or strategies described in these materials may be volatile, and investors should have the financial ability and willingness to accept such risks.
Unless otherwise noted, investment performance contained in these materials is reflective of a strategy composite. All other strategy data and information included in these materials reflects a representative portfolio which is an account in the composite that Western Asset believes most closely reflects the current portfolio management style of the strategy. Performance is not a consideration in the selection of the representative portfolio. The characteristics of the representative portfolio shown may differ from other accounts in the composite. Information regarding the representative portfolio and the other accounts in the composite are available upon request. Statements in these materials should not be considered investment advice. References, either general or specific, to securities and/or issuers in the materials are for illustrative purposes only and are not intended to be, and should not be interpreted as, recommendation to purchase or sell such securities. Employees and/or clients of Western Asset may have a position in the securities or issuers mentioned.
These materials are not intended to provide, and should not be relied on for, accounting, legal, tax, investment or other advice. The recipient should consult its own counsel, accountant, investment, tax, and any other advisers for this advice, including economic risks and merits, related to making an investment with Western Asset. The recipient is responsible for observing the applicable laws and regulations of their country of residence.
Founded in 1971, Western Asset Management Company is a global fixed-income investment manager with offices in Pasadena, New York, London, Singapore, Tokyo, Melbourne, São Paulo, Hong Kong, and Zürich. Western Asset is a wholly owned subsidiary of Franklin Resources, Inc. but operates autonomously. Western Asset is comprised of six legal entities across the globe, each with distinct regional registrations: Western Asset Management Company, LLC, a registered Investment Adviser with the Securities and Exchange Commission; Western Asset Management Company Ltda. is regulated by Comissão de Valores Mobiliários; Western Asset Management Company Pty Ltd ABN 41 117 767 923 is the holder of the Australian Financial Services License 303160; Western Asset Management Company Pte. Ltd. Co. Reg. No. 200007692R is a holder of a Capital Markets Services License for fund management and regulated by the Monetary Authority of Singapore; Western Asset Management Company Ltd, a registered Financial Instruments Business Operator and regulated by the Financial Services Agency of Japan; and Western Asset Management Company Limited is authorised and regulated by the Financial Conduct Authority ("FCA") (FRN 145930). This communication is intended for distribution to Professional Clients only if deemed to be a financial promotion in the UK as defined by the FCA. This communication may also be intended for certain EEA countries where Western Asset has been granted permission to do so. For the current list of the approved EEA countries please contact Western Asset at +44 (0)20 7422 3000.