Macros, Markets and Munis
Municipals rallied last week and outperformed Treasuries. Markets remained focused on geopolitical developments, particularly around President Trump’s Tuesday evening deadline for Iran related to the Strait of Hormuz. Sentiment improved later in the week as the US and Iran agreed to engage in negotiations over the weekend, supporting a modest risk-on tone. On the economic data front, the Consumer Price Index (CPI) rose to 3.3% year-over-year (YoY) from 2.5% previously, indicating a re-acceleration in headline inflation, while core CPI came in slightly below expectations. All told, Treasuries moved 3 to 4 basis points (bps) lower in short and intermediate maturities. High-grade municipal yields outperformed, moving 10 to 13 bps lower across the curve. Meanwhile, muni demand continued to improve, extending year-to-date (YTD) inflows. As Tax Day approaches this week, we touch on key tax policy measures that could influence muni valuations.
Muni Mutual Funds Sustain Strong Demand
Fund Flows ($866 million of net outflows): During the week ending April 8, weekly reporting municipal mutual funds recorded $866 million of net inflows, according to Lipper. Long-term and intermediate categories recorded $232 million and $667 million of inflows, respectively. The short-term category recorded $105 million of outflows. Last week’s inflows bring YTD inflows to $28 billion.
Supply (YTD supply of $144 billion; up 12% YoY): The muni market recorded $10 billion of new-issue supply last week, up 56% from the prior week. YTD new-issue supply of $144 billion is 12% higher than the prior year, with tax-exempt issuance up 13% YoY and taxable issuance up 4%, respectively. This week’s calendar is expected to increase to $18 billion, the highest level of the year. The largest deals include $2.3 billion New York City general obligation and $1.5 billion State of Hawaii transactions.
This Week in Munis: Tax Policy in Focus
While the One Big Beautiful Bill Act provided greater stability for future individual tax rates, most notably by permanently reducing the top federal marginal rate to 37%, several state and local developments are emerging as we approach this year’s Tax Day on April 15 that could influence both individual tax policy and municipal valuations. One of the most notable developments comes from Washington state, where on March 30, 2026, the governor signed into law new income tax legislation previously passed by the state legislature.
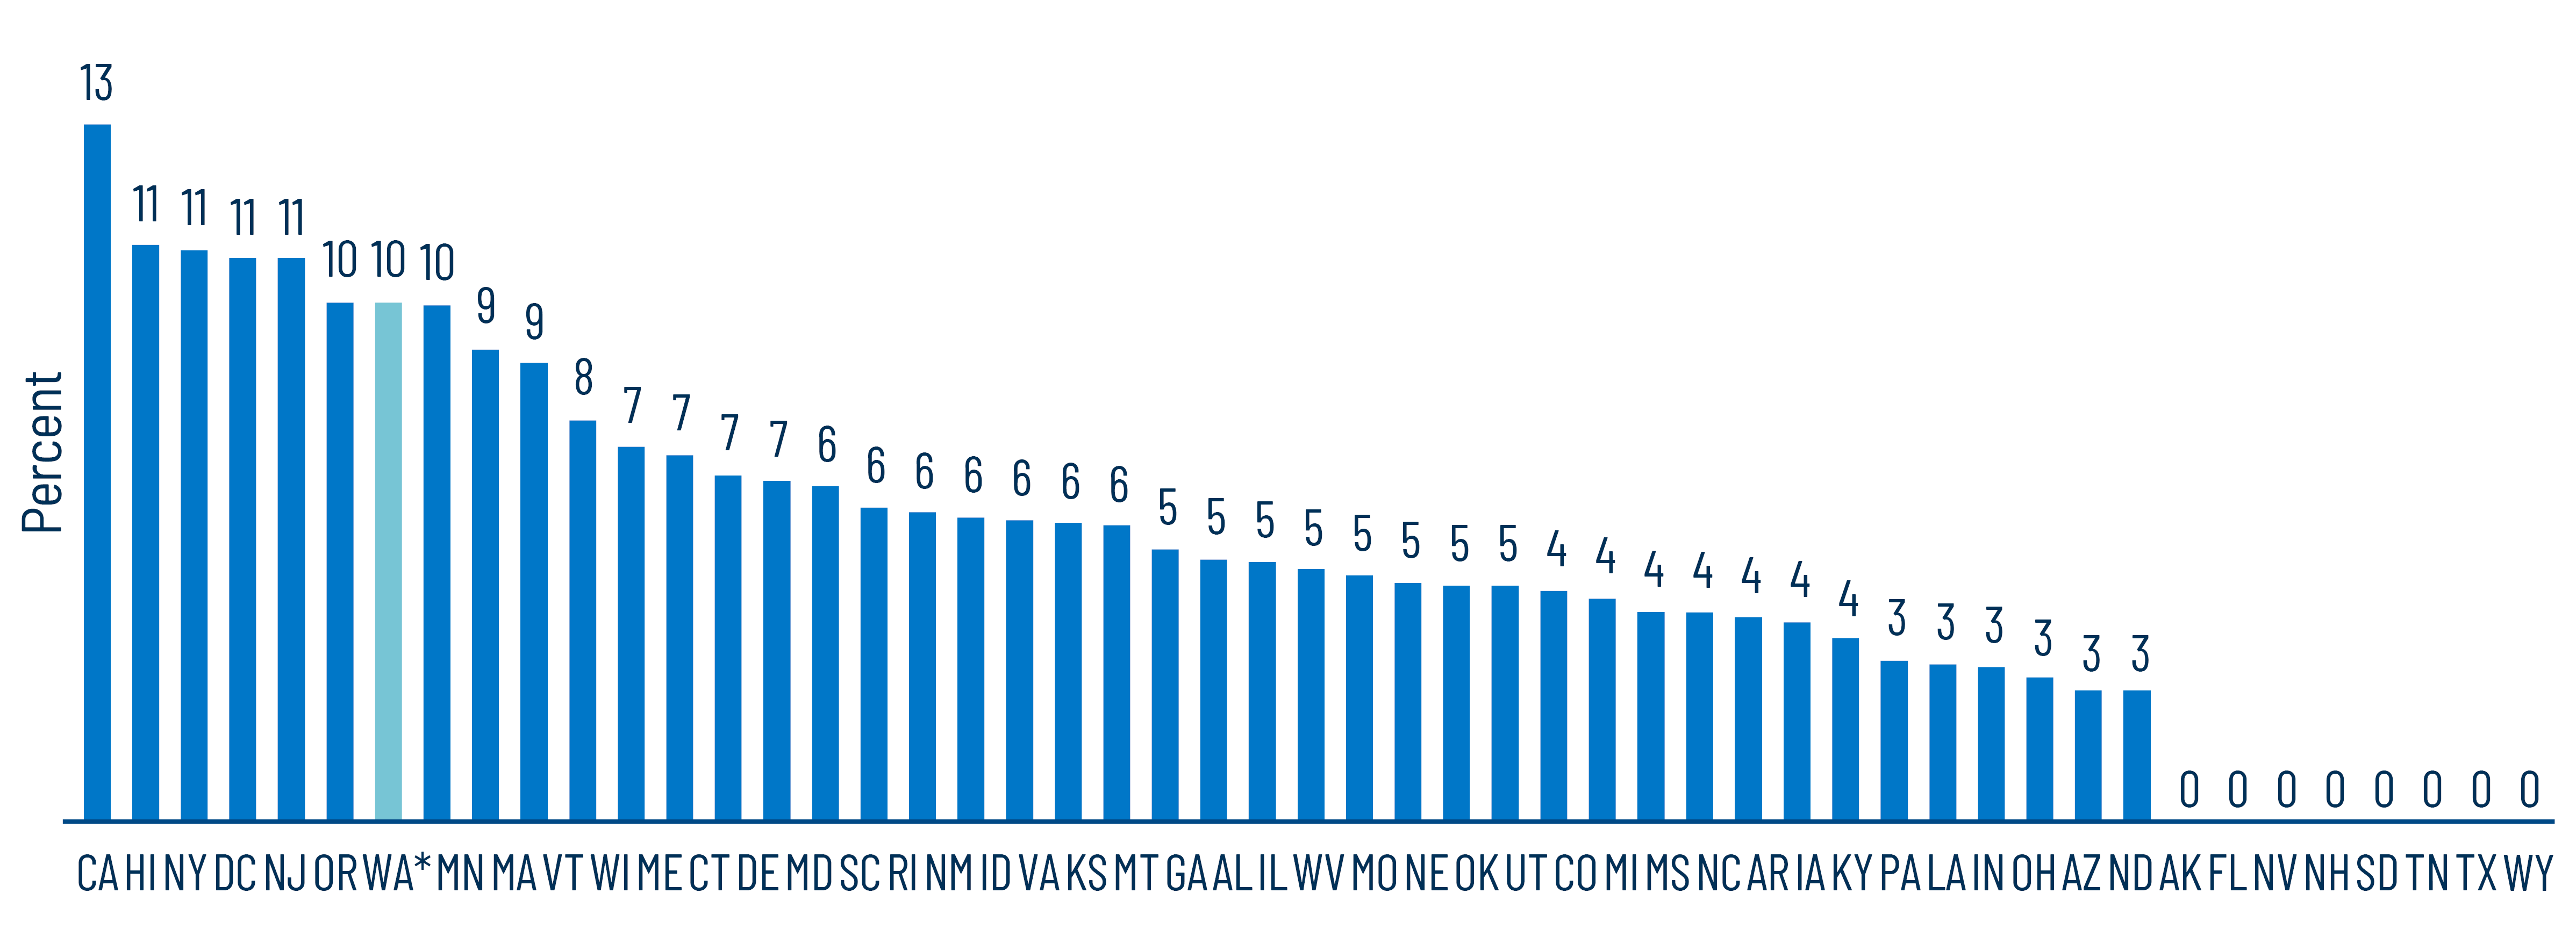
The legislation introduces a 9.9% tax on income above $1 million beginning in 2028, marking a significant shift for a state that has historically imposed no income tax across all income levels. This “millionaire’s tax” would align Washington with neighboring Oregon’s top rate and place it among the highest-tax states nationally. Despite its enactment, the law is expected to face constitutional challenges.
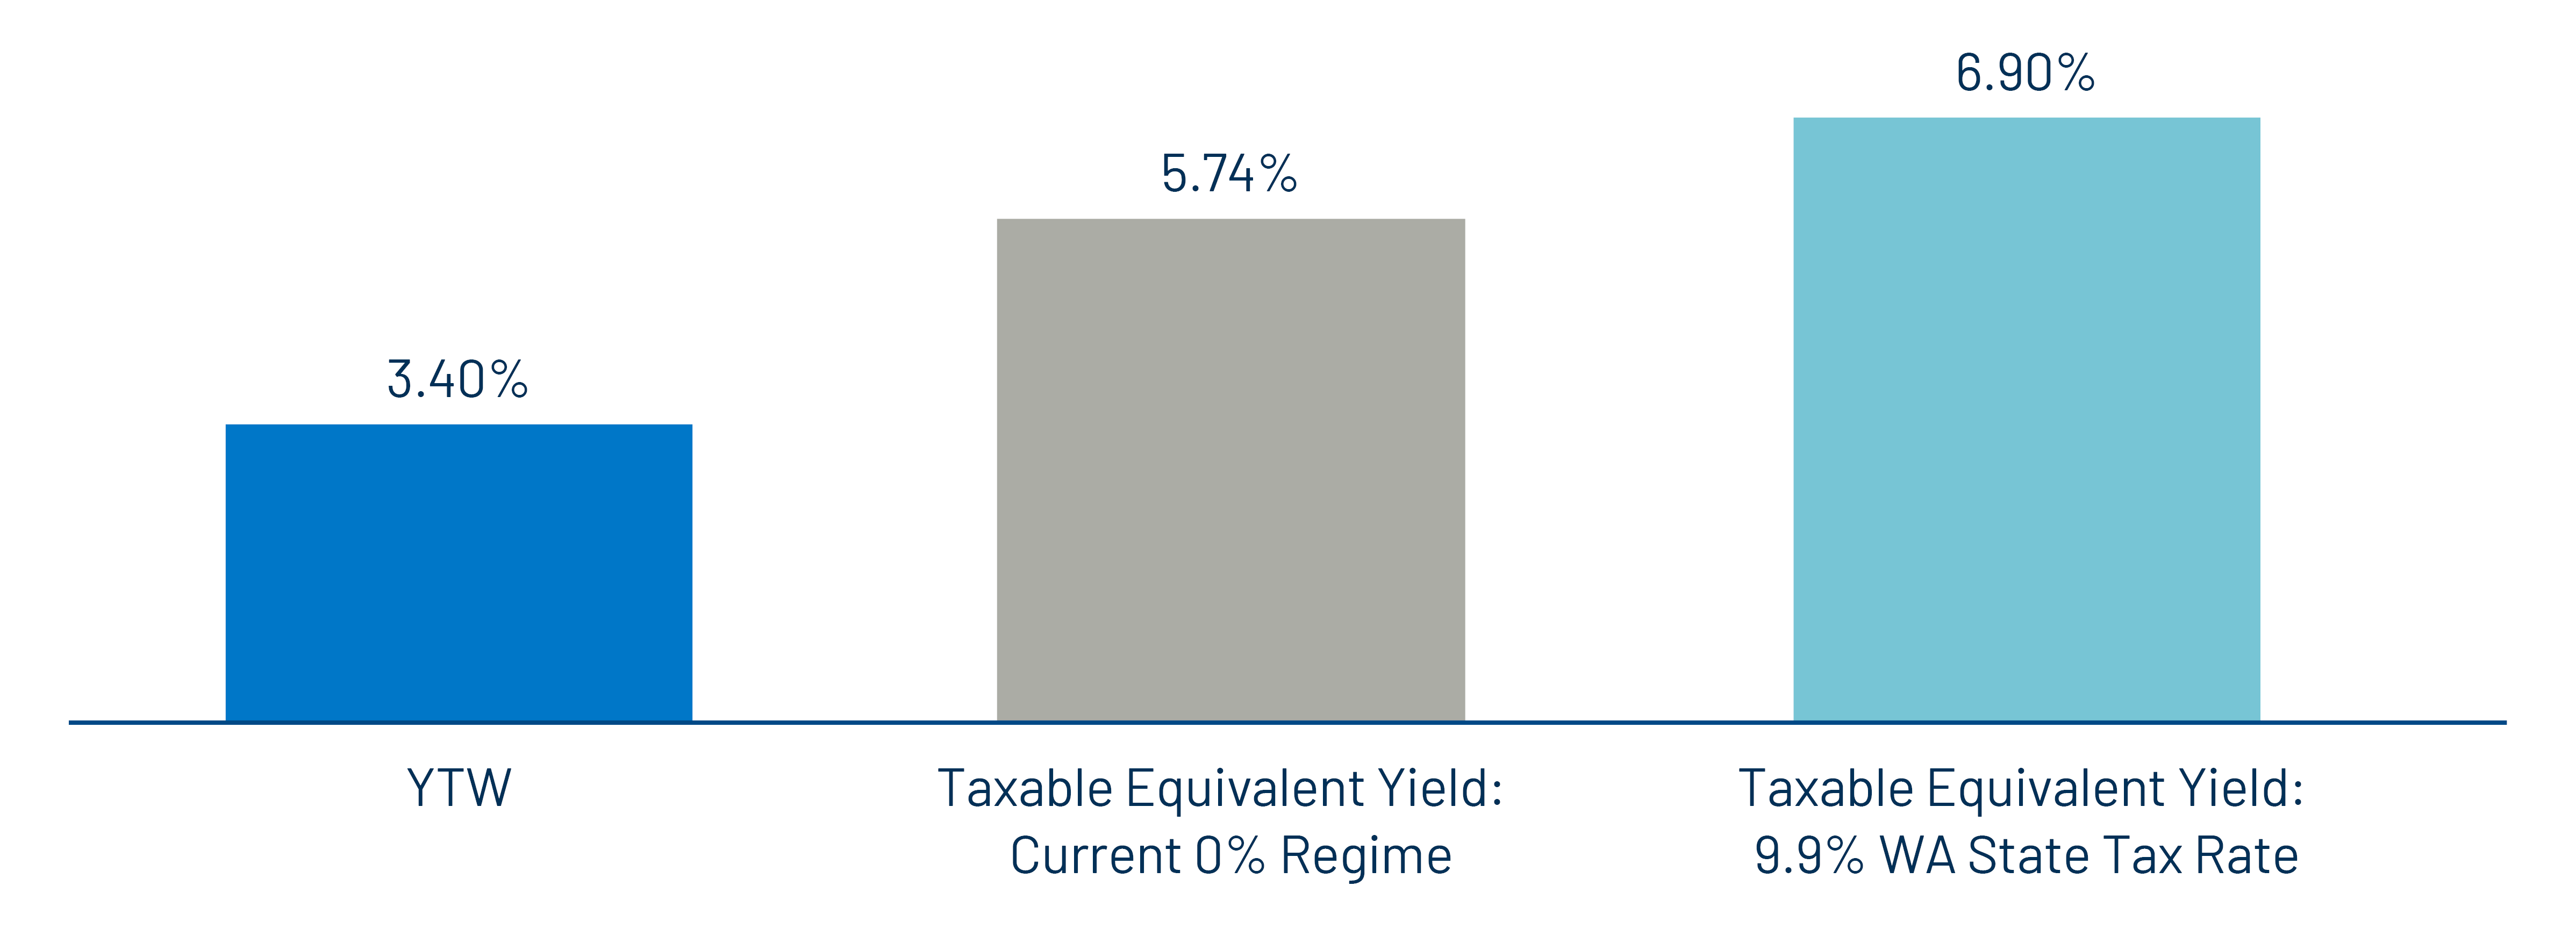
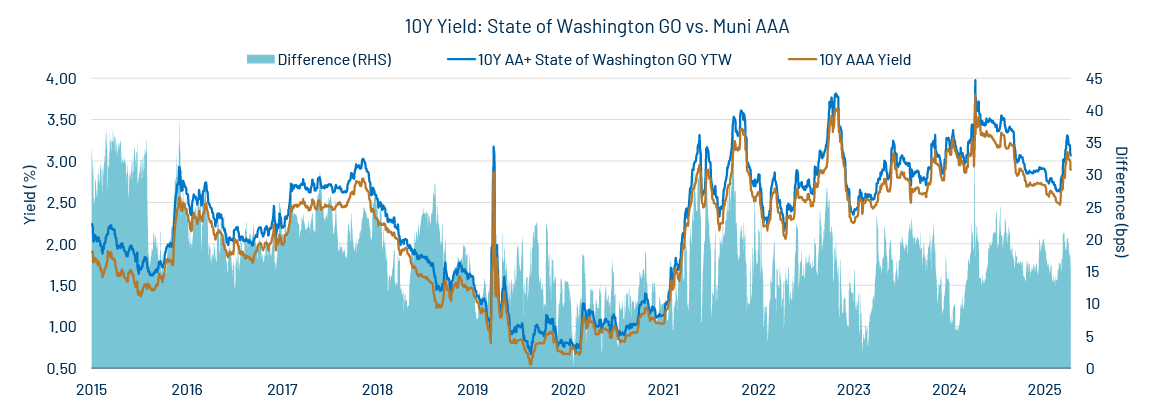
If implemented, the legislation carries meaningful implications for municipal valuations. A 9.9% marginal tax rate for high earners in the state would increase the taxable-equivalent yield on Washington municipal securities from approximately 5.74% to 6.90% on average, an improvement of 116 bps. This increase should support stronger in-state demand, likely putting downward pressure on yields for Washington issuers. Historically, Washington municipal bonds have traded at higher yields than comparable national securities due to the limited value of in-state tax exemption and weaker local demand. These dynamics could reverse, with yields and spreads potentially compressing below national averages. Western Asset believes this environment may benefit active national investment managers through potential price appreciation associated with these lower yields, while Washington-based investors may have an opportunity to capture relatively attractive tax-exempt income levels today before they potentially decline over time as these dynamics unfold.
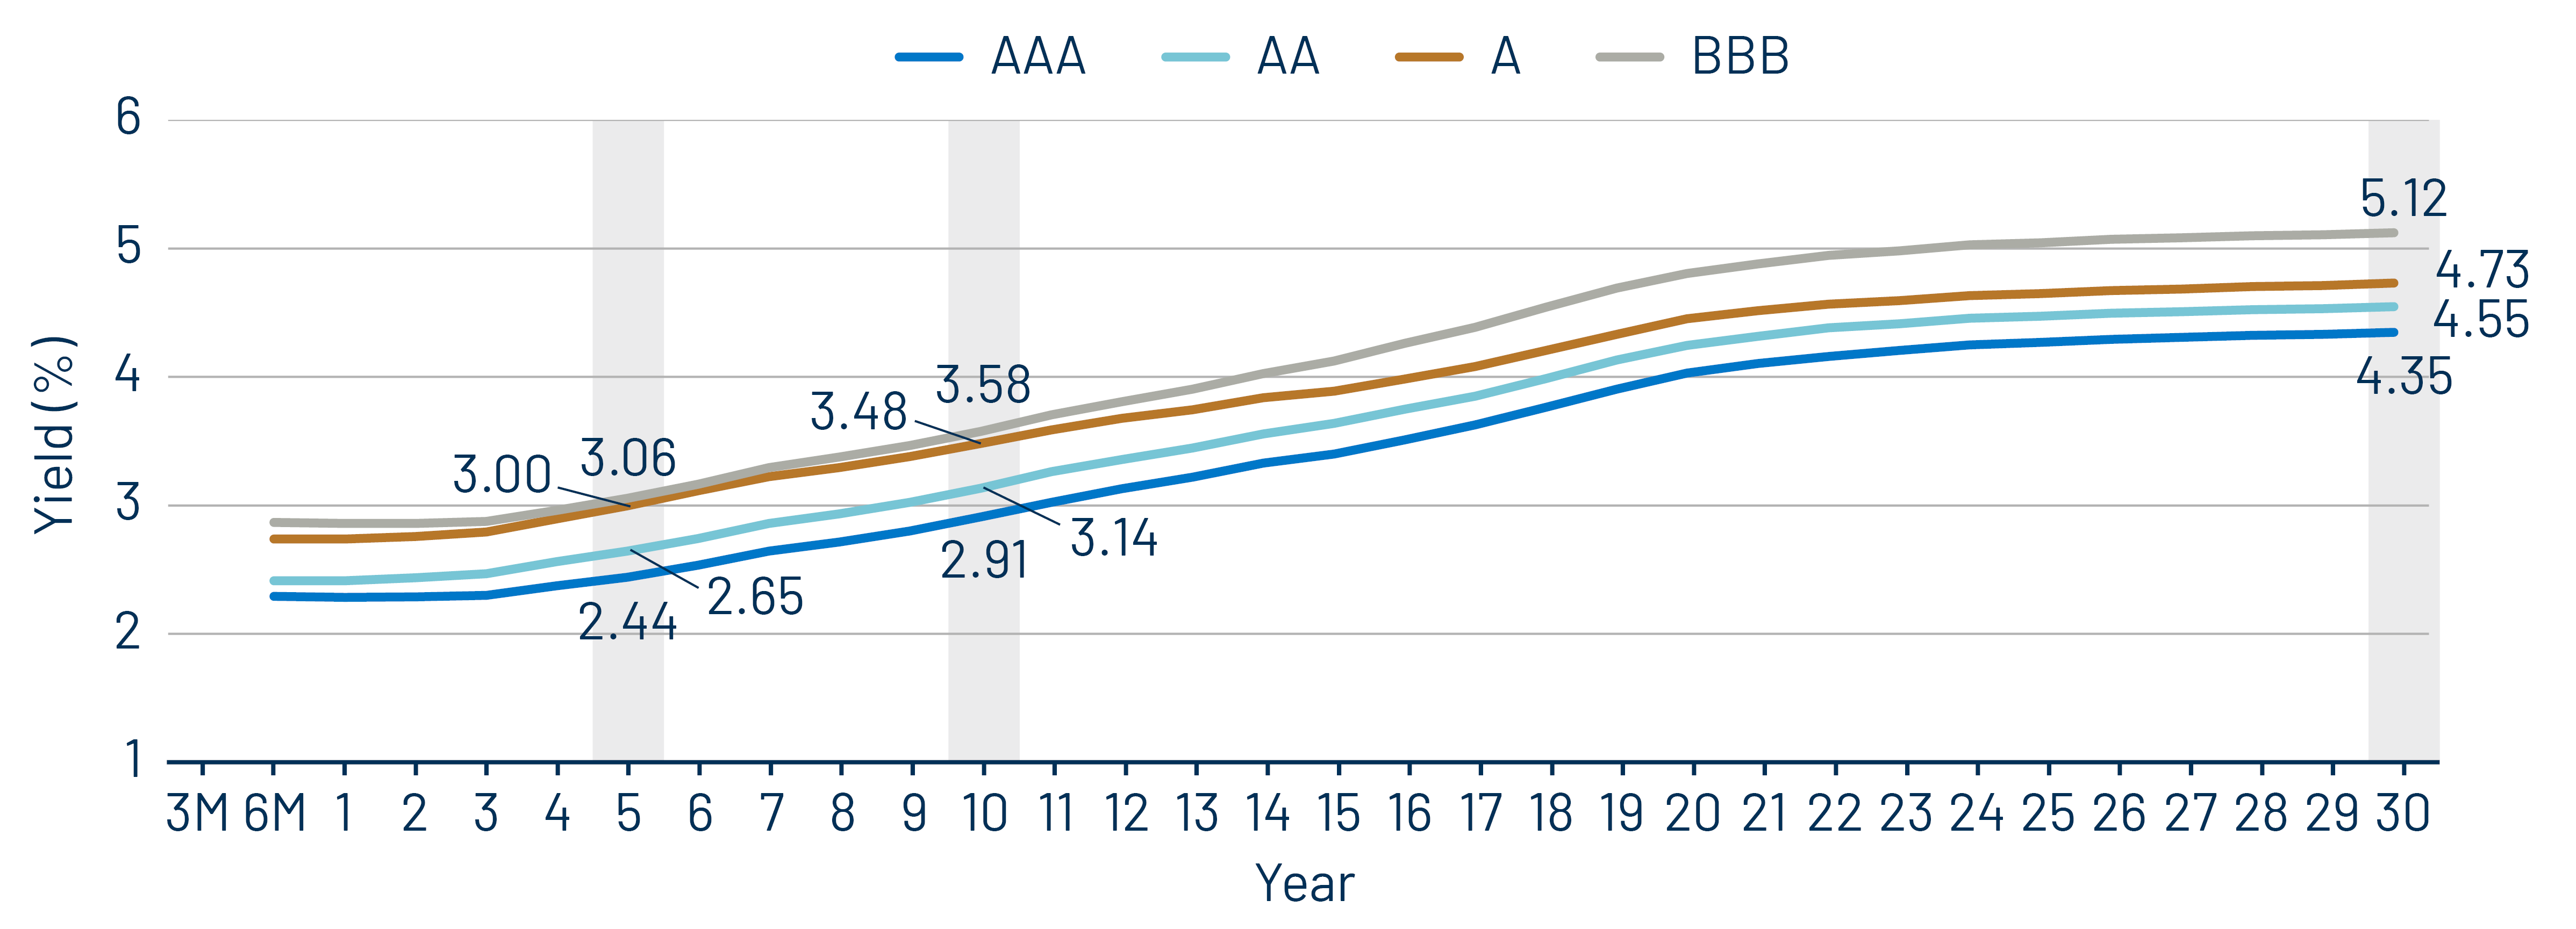
Municipal Credit Curves and Relative Value
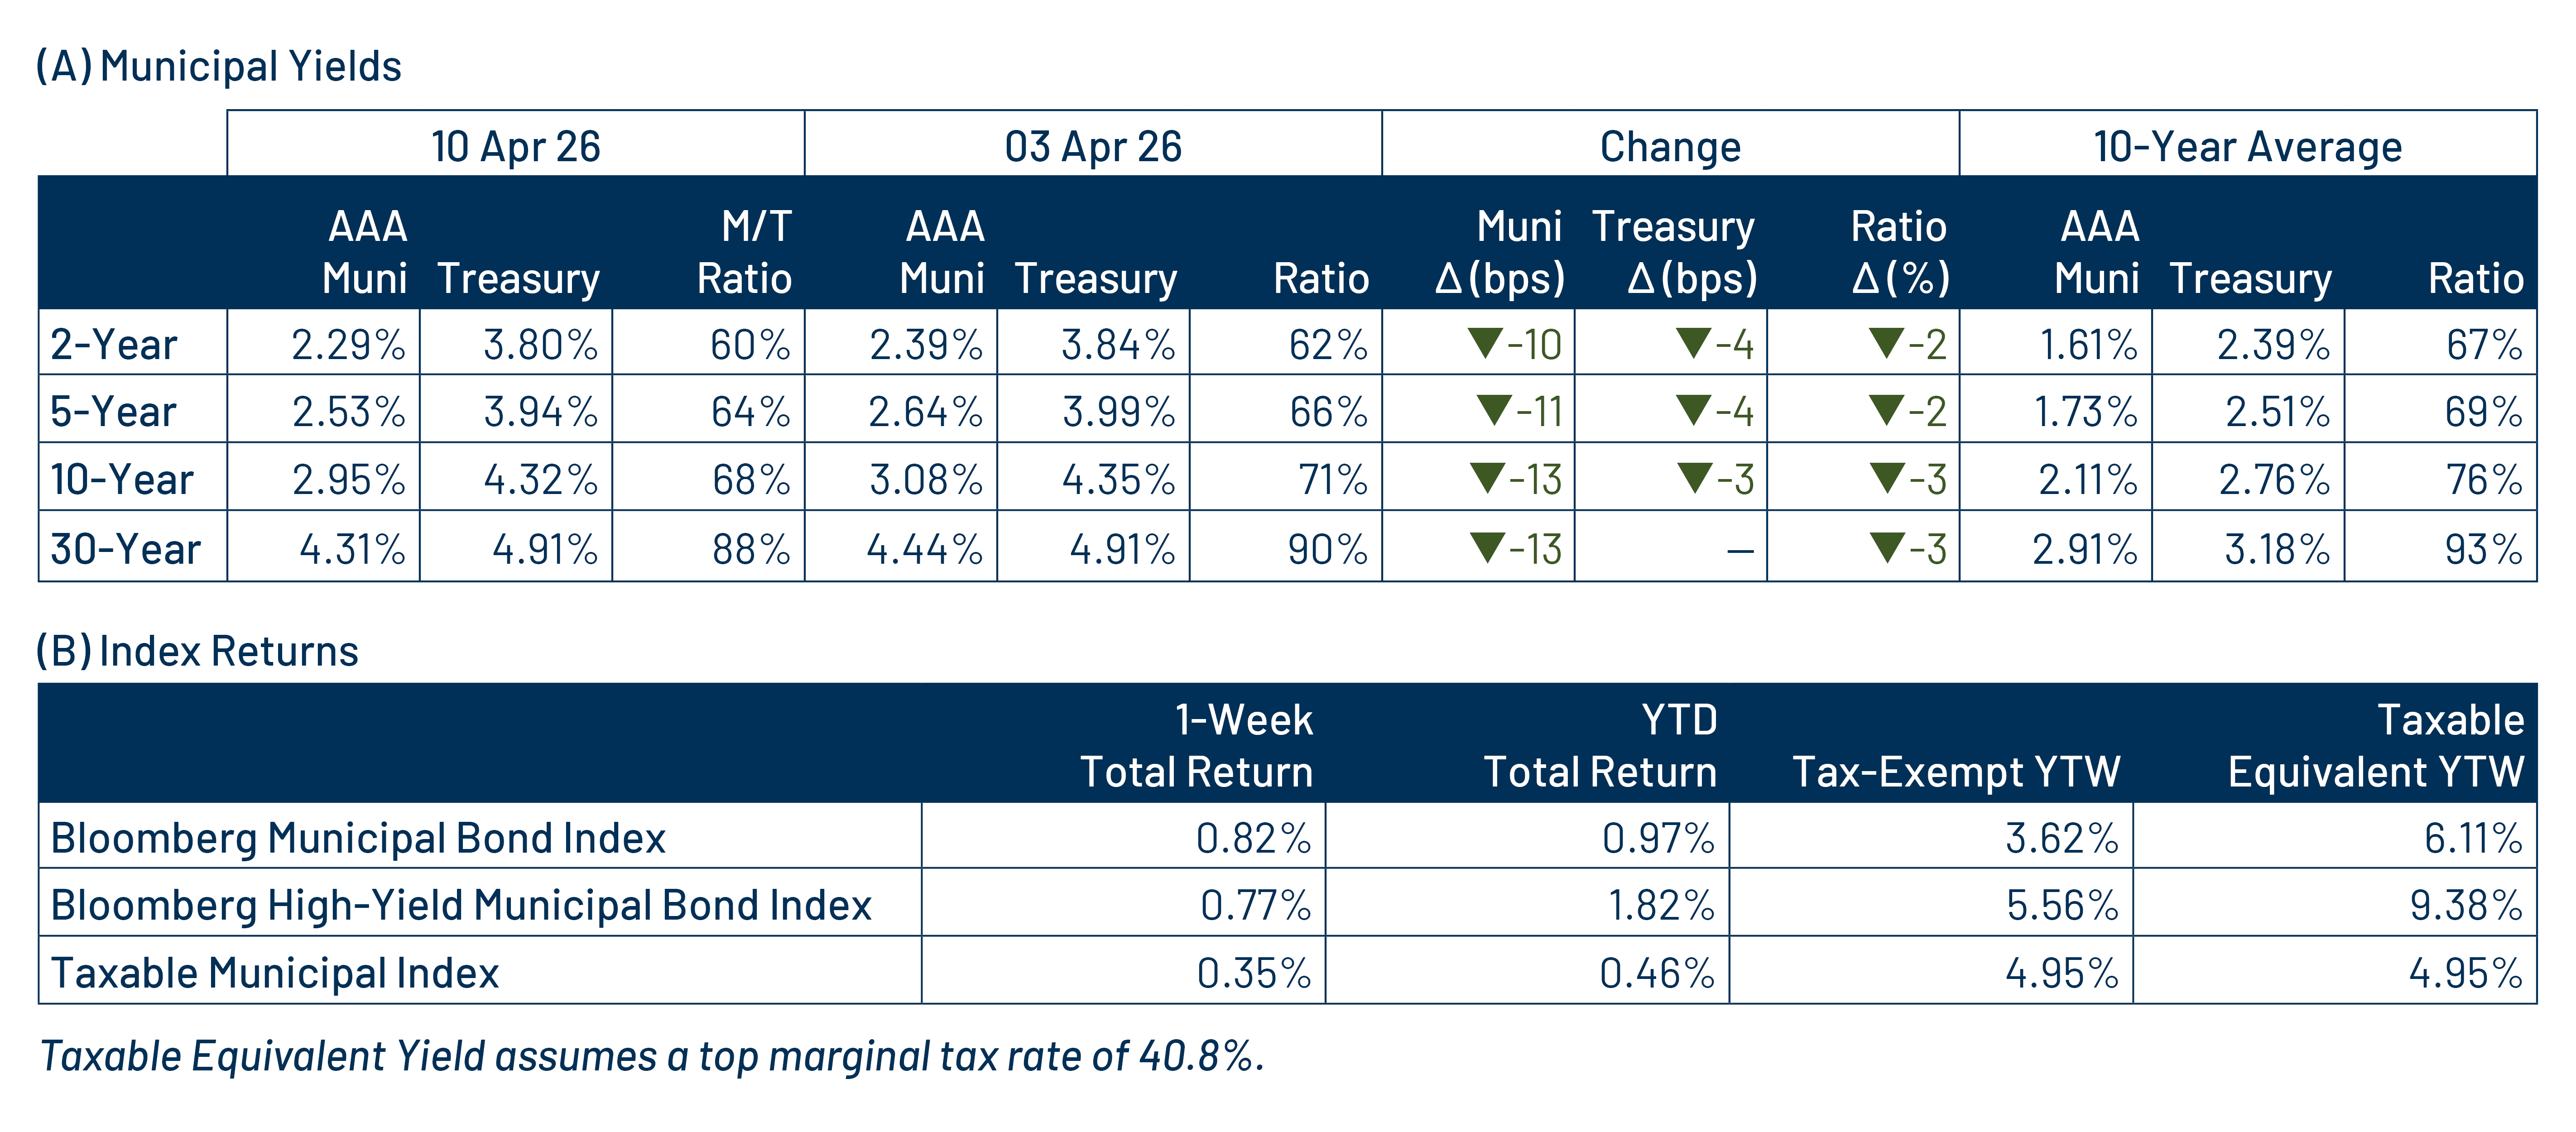
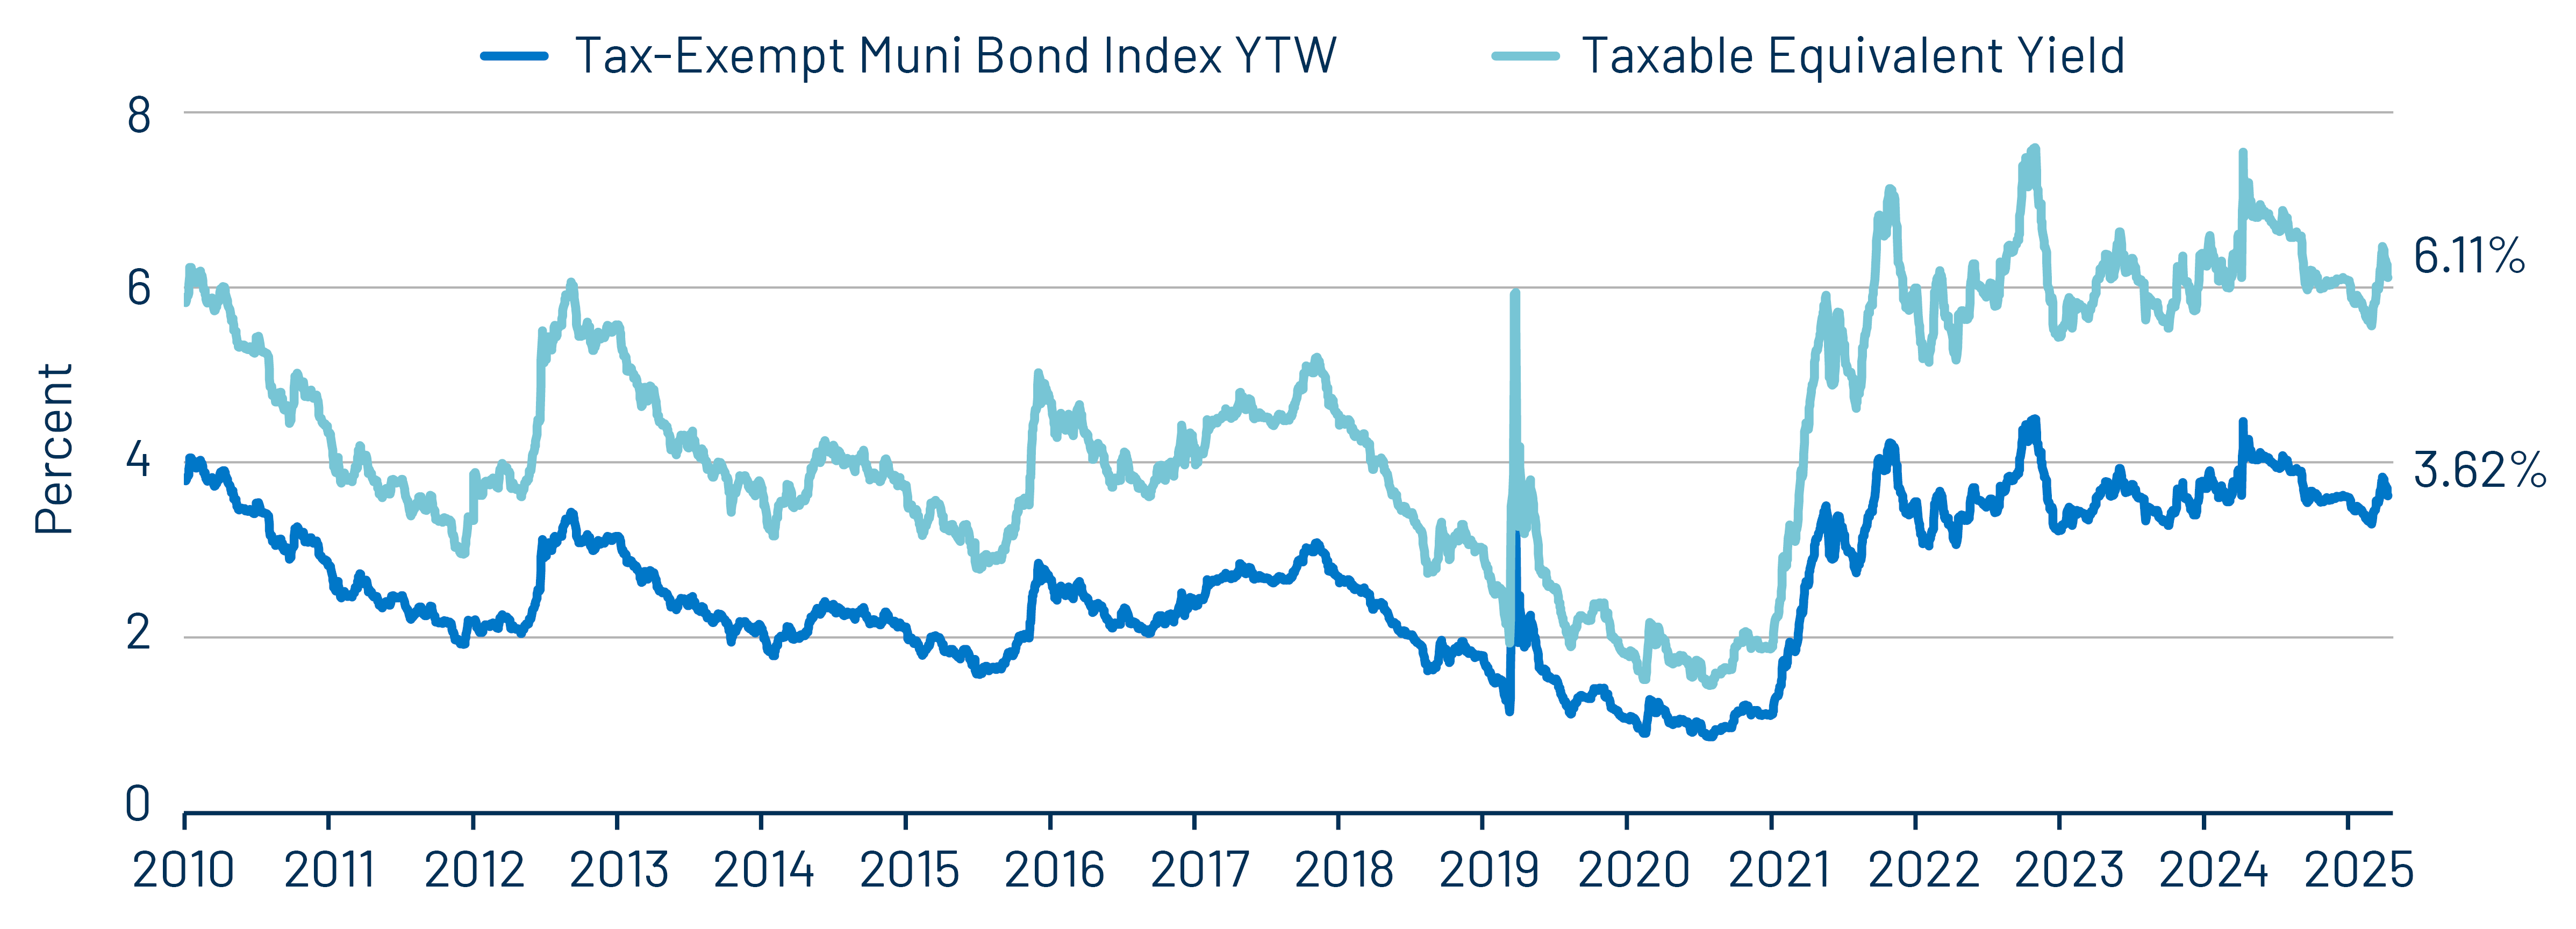
Theme #1: Municipal taxable-equivalent yields moved lower from recent highs, but remain above historical averages.
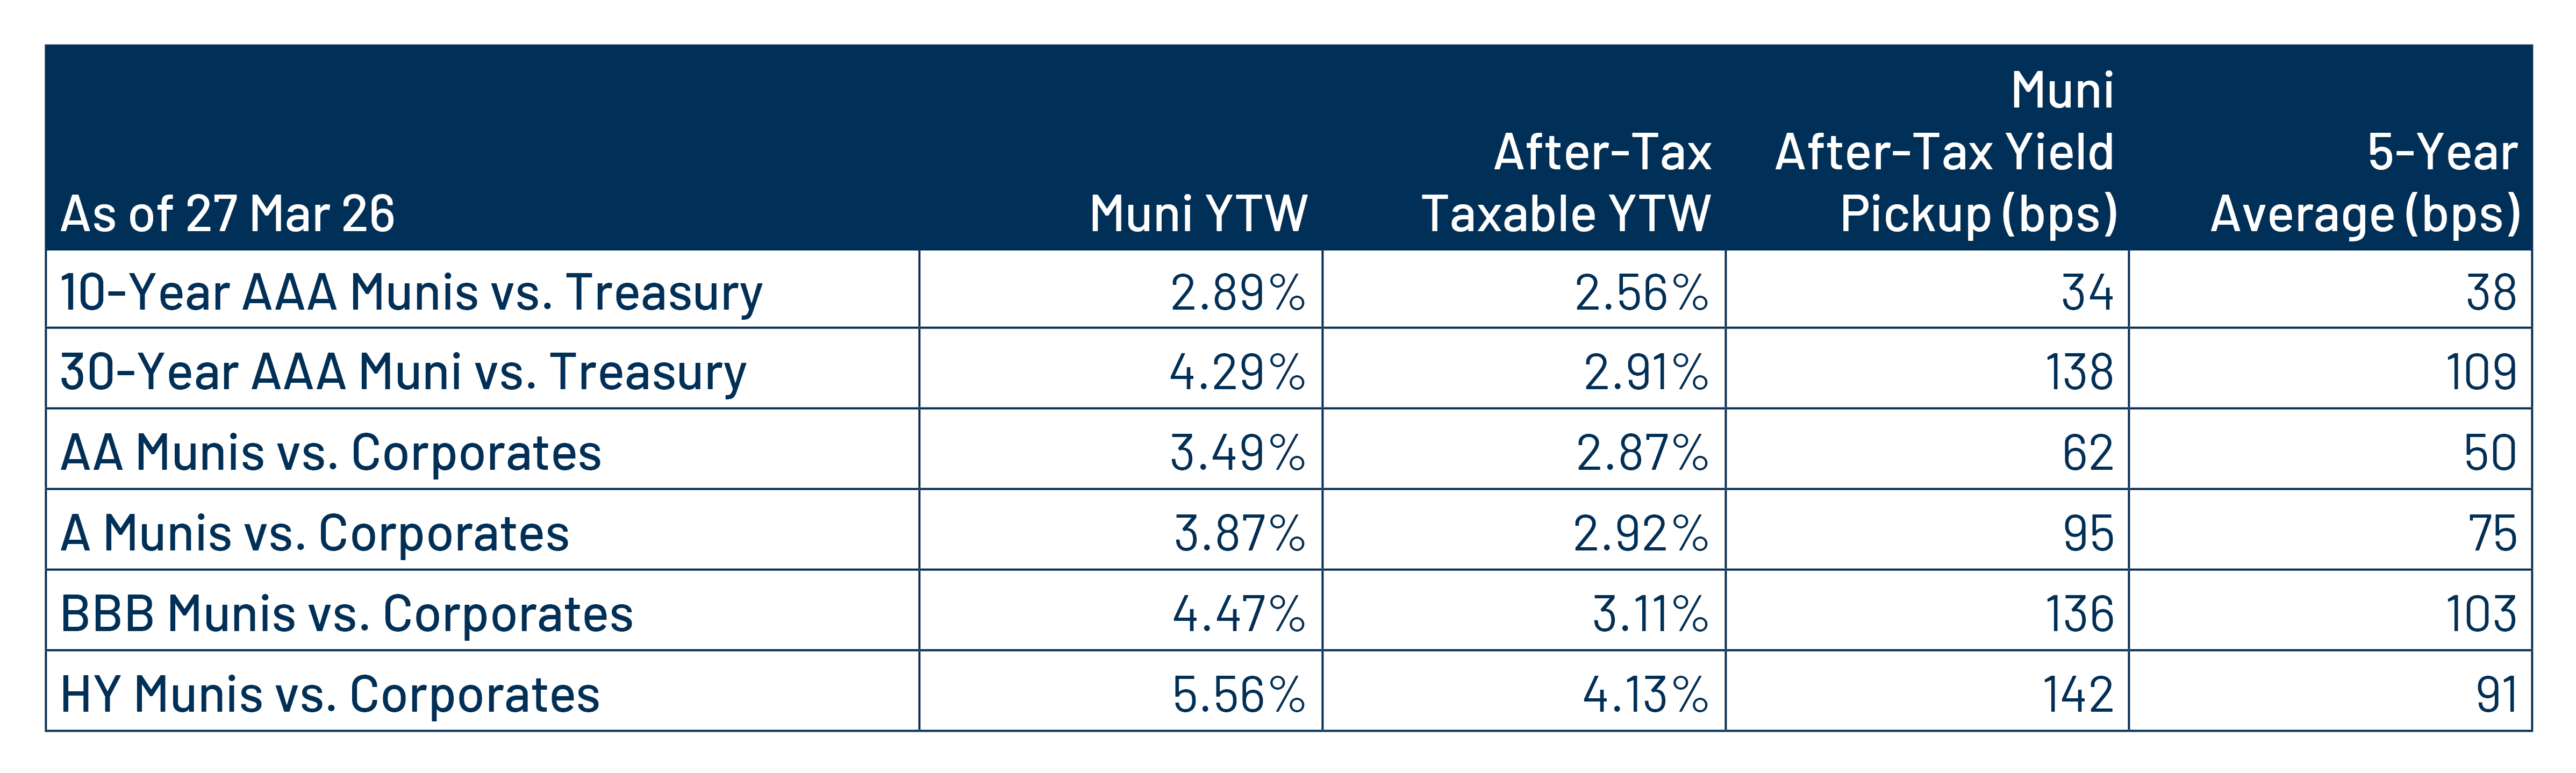
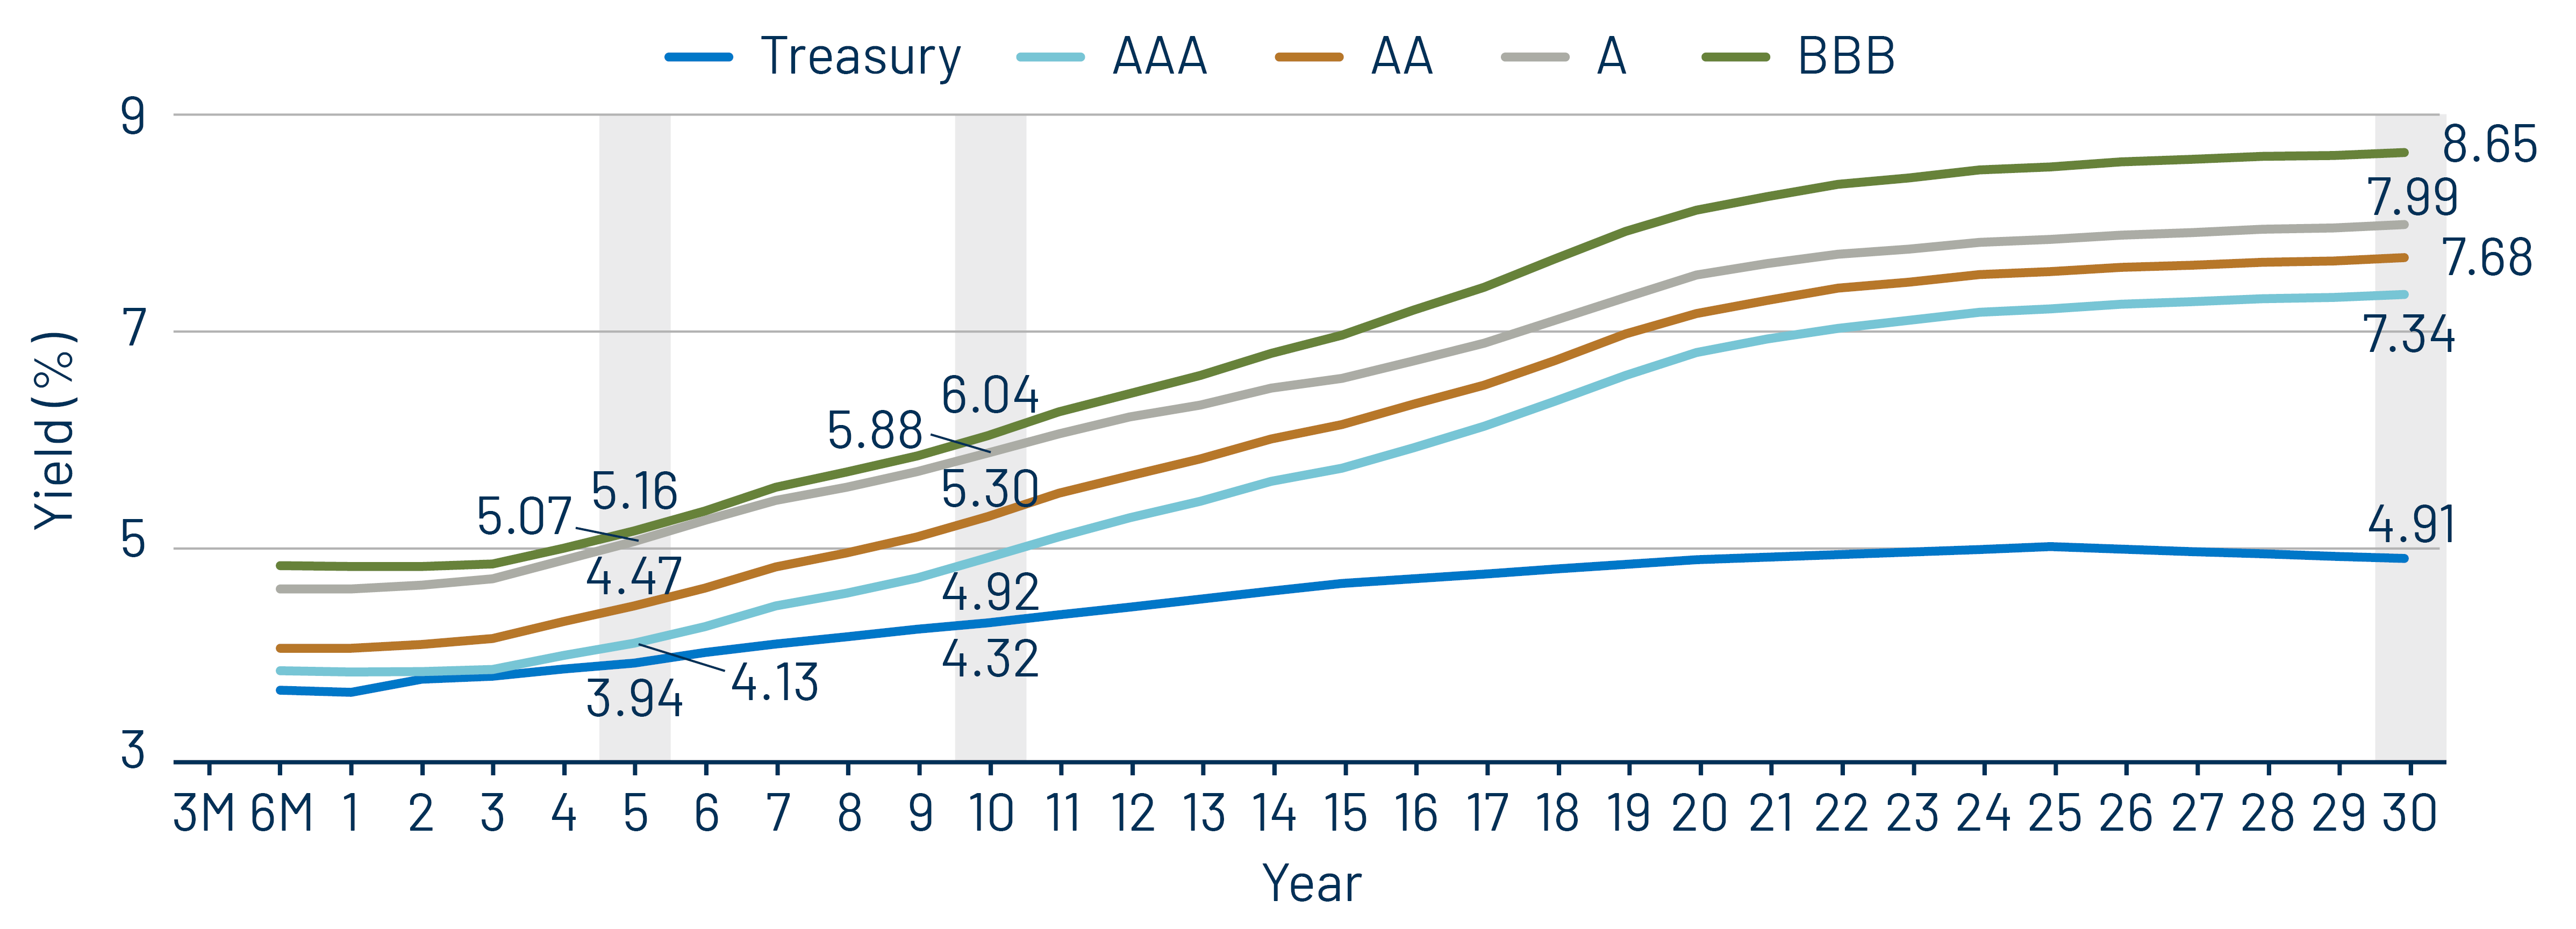
Theme #2: Munis offer attractive after-tax yield pickup vs. longer-duration and lower-quality taxable alternatives.
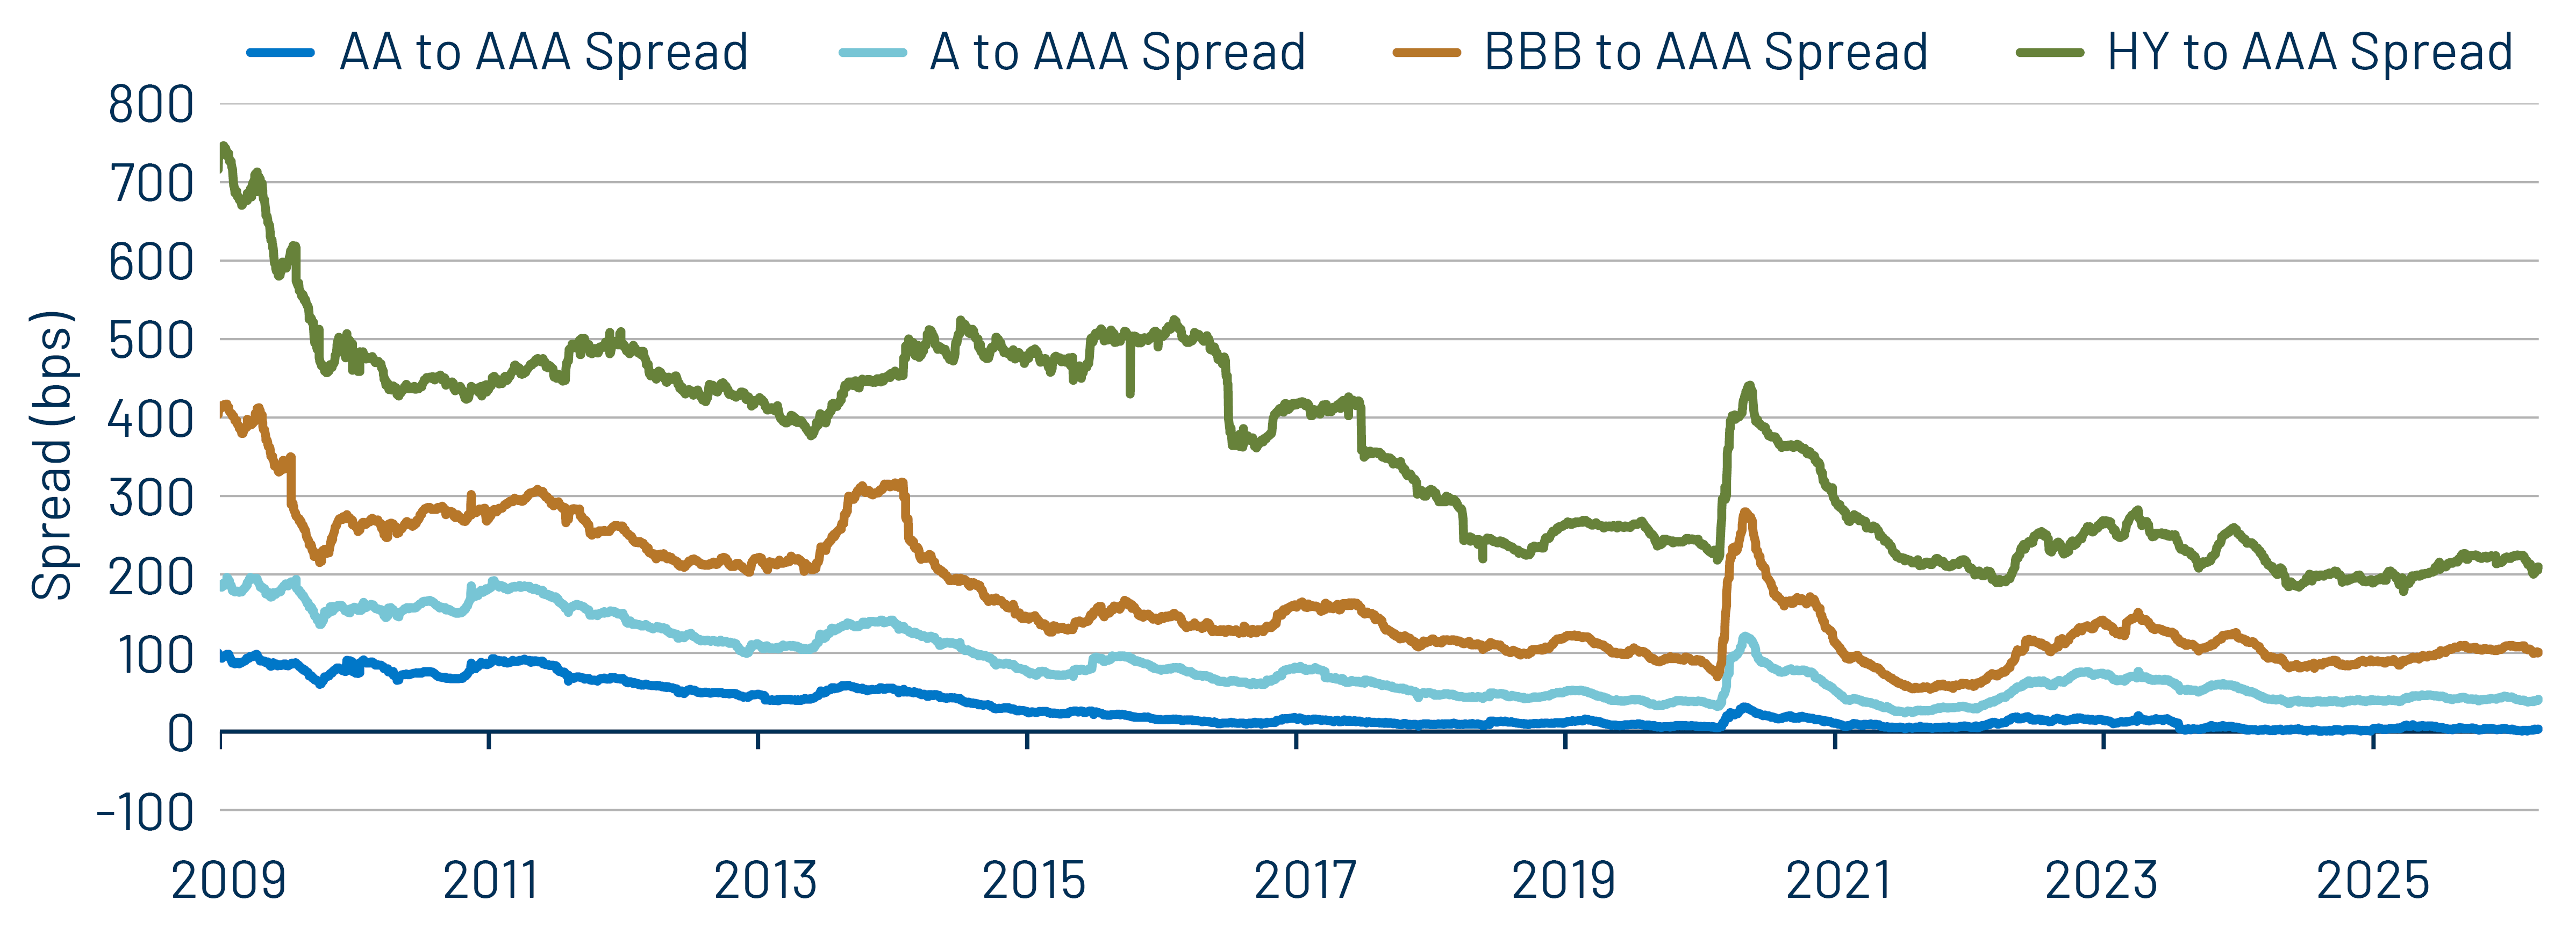
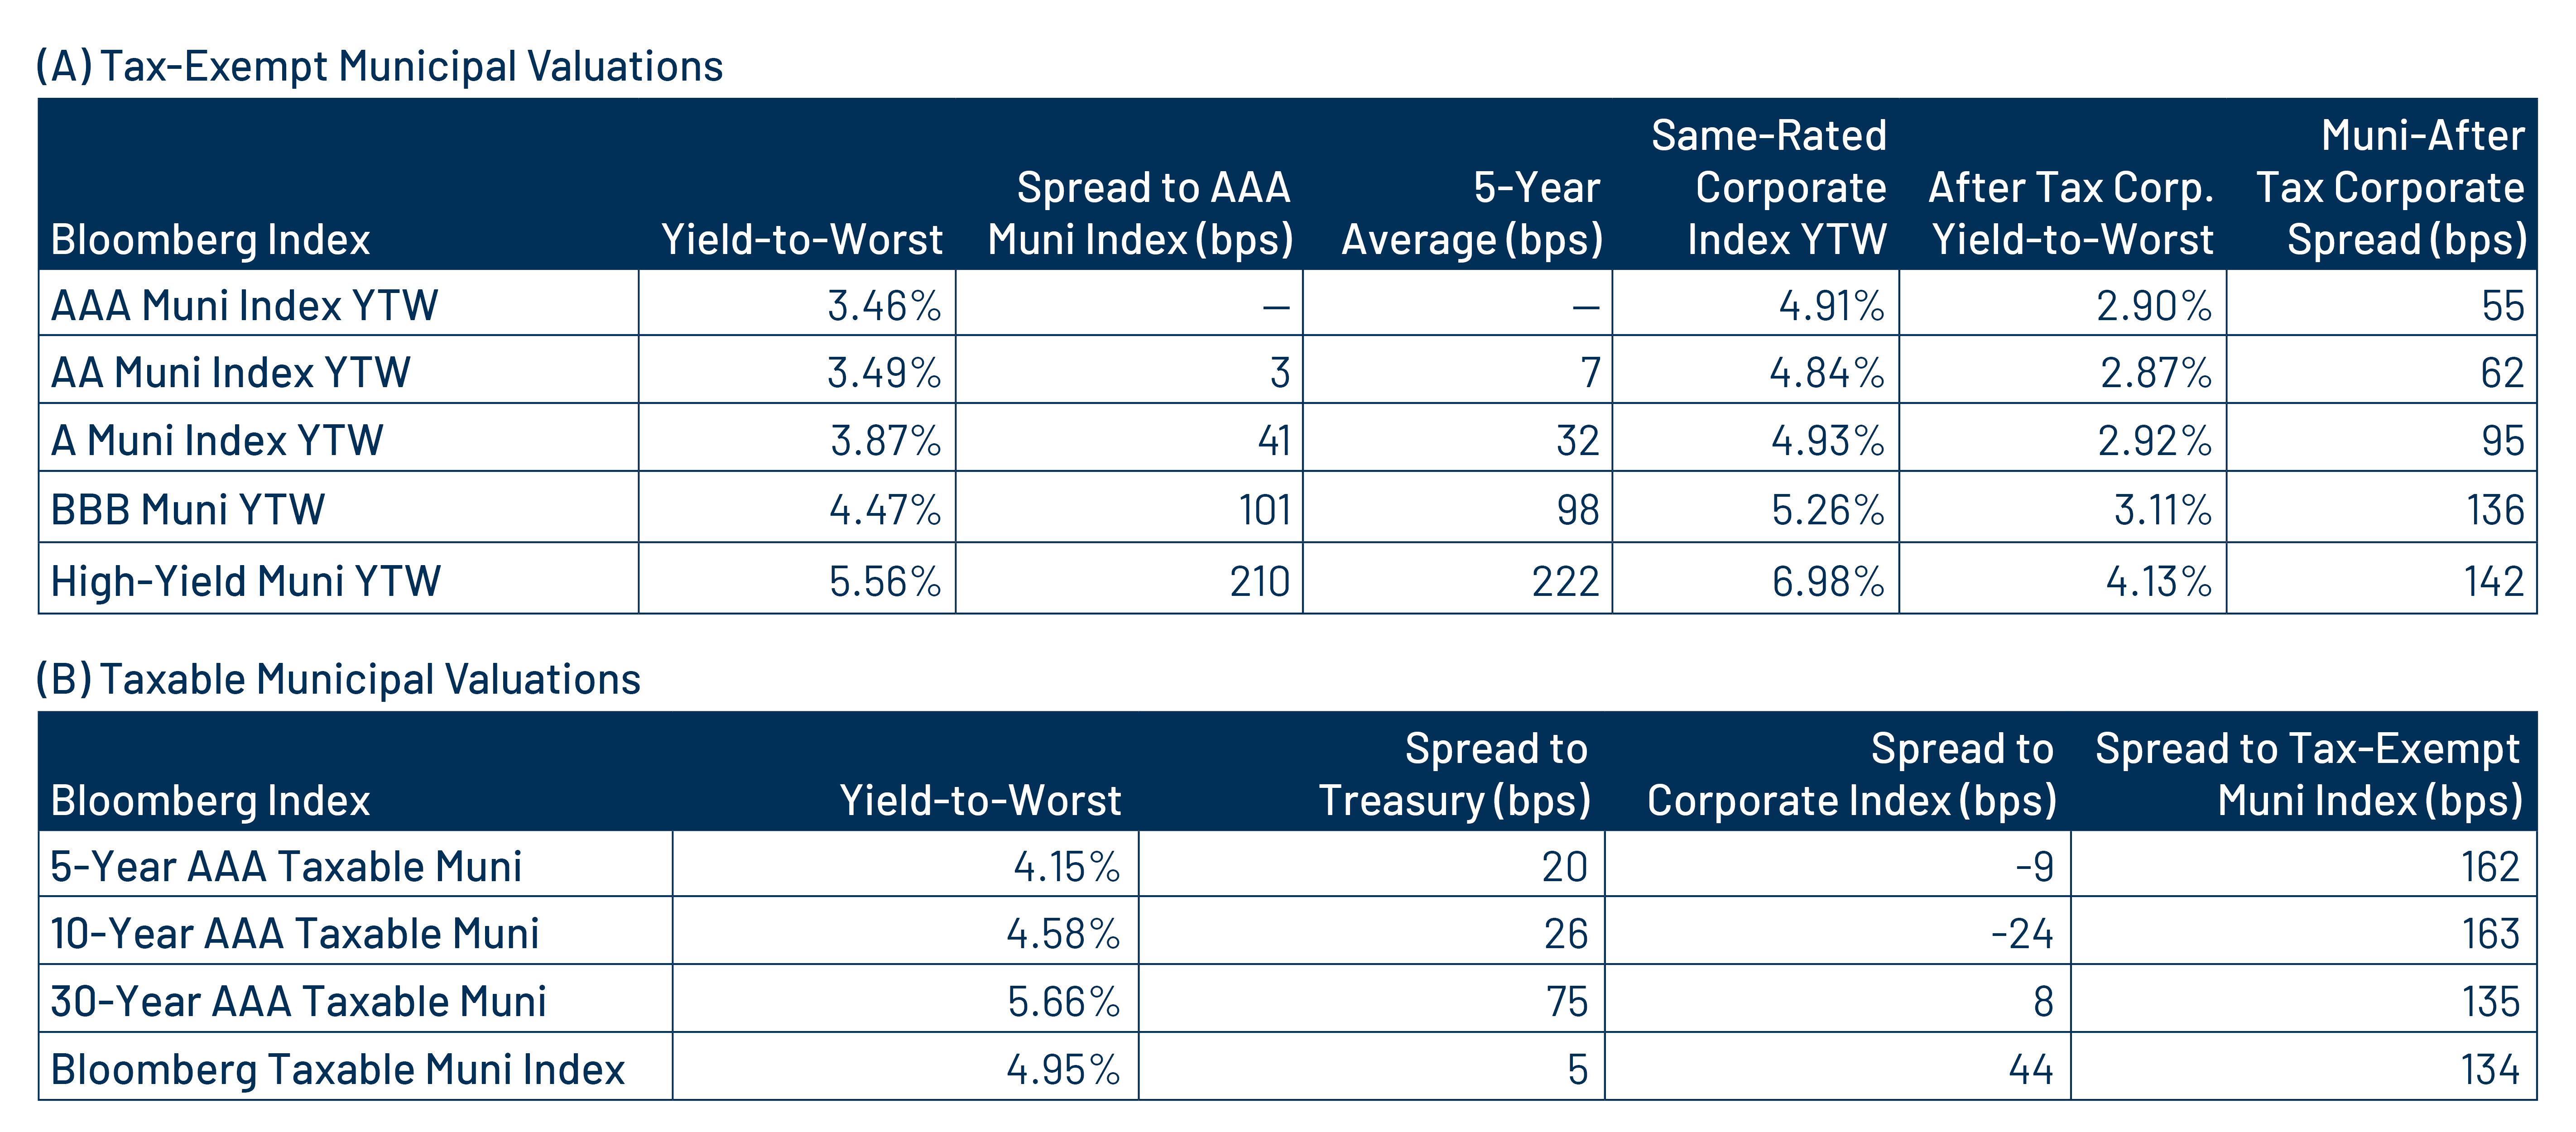
Theme #3: Historically tight municipal credit spreads underscore the importance of credit selection.