skip navigation
Western Asset Management Company
Blog

Stay up to date on timely topics and market events. Subscribe to our Blog now.

MARKETS
21 July 2026

Weekly Municipal Monitor—Summer Technicals

By Sam Weitzman

Stay up to date on timely topics and market events. Subscribe to our Blog now.

Macros, Markets and Munis

Municipals posted negative returns last week and underperformed Treasuries as geopolitical developments remained in focus with the US moving to reinstate a blockade of the Strait of Hormuz. Meanwhile, inflation data helped ease market concerns, with headline Consumer Price Index (CPI) declining 0.4% month-over-month, well below expectations and marking the largest decline in more than six years. Core CPI also decelerated over the month, remaining unchanged and below expectations. Treasury yields moved lower across most maturities with a steepening bias. Munis sold off 6-11 basis points across the curve, pressured by heavy supply and tight headline valuations. Supply remained elevated amid steady demand. This week we touch on summer technical dynamics.

Supply and Demand Remained Elevated Last Week

Fund Flows ($1.4 billion of net inflows): During the week ending July 15, weekly reporting municipal mutual funds recorded $1.4 billion of net inflows, in line with the prior week and marking the 13th consecutive week of inflows, according to Lipper. The intermediate-term category led demand with $596 million of inflows. The long-term category recorded $467 million of inflows and the short-term category reported $293 million of inflows. Last week’s inflows bring year-to-date (YTD) inflows to $58 billion.

Supply (YTD supply of $328 billion; up 12% YoY): The muni market recorded $13 billion of new-issue supply last week, 22% above the prior week’s level. YTD new-issue supply of $328 billion is 11% higher than the prior record-issuance year, with tax-exempt issuance up 12% year-over-year (YoY) and taxable issuance up 1%. This week’s calendar is expected to remain steady at $13 billion. Largest deals include $1.5 billion New York City Transitional Finance Authority and $944 million San Antonio Airport System transactions.

This Week in Munis: Summer Technicals

Municipal performance has historically strengthened during the summer months, supported by favorable supply-demand technicals that include seasonal coupon and maturity reinvestment, lighter net issuance and a rebound in demand following spring tax-season reallocations. Over the past decade, May, June and July have generally ranked among the strongest average return months for the Bloomberg Municipal Bond Index. While this year’s technical backdrop differs from historical norms given elevated issuance, municipal performance has remained resilient. From Memorial Day through July 17, the Bloomberg Municipal Bond Index returned 1.19%, outperforming both the Bloomberg U.S. Treasury Index (0.69%) and the Bloomberg U.S. Corporate Index (-0.53%). That outperformance is notable given that municipal supply remains on pace for a third consecutive record year.
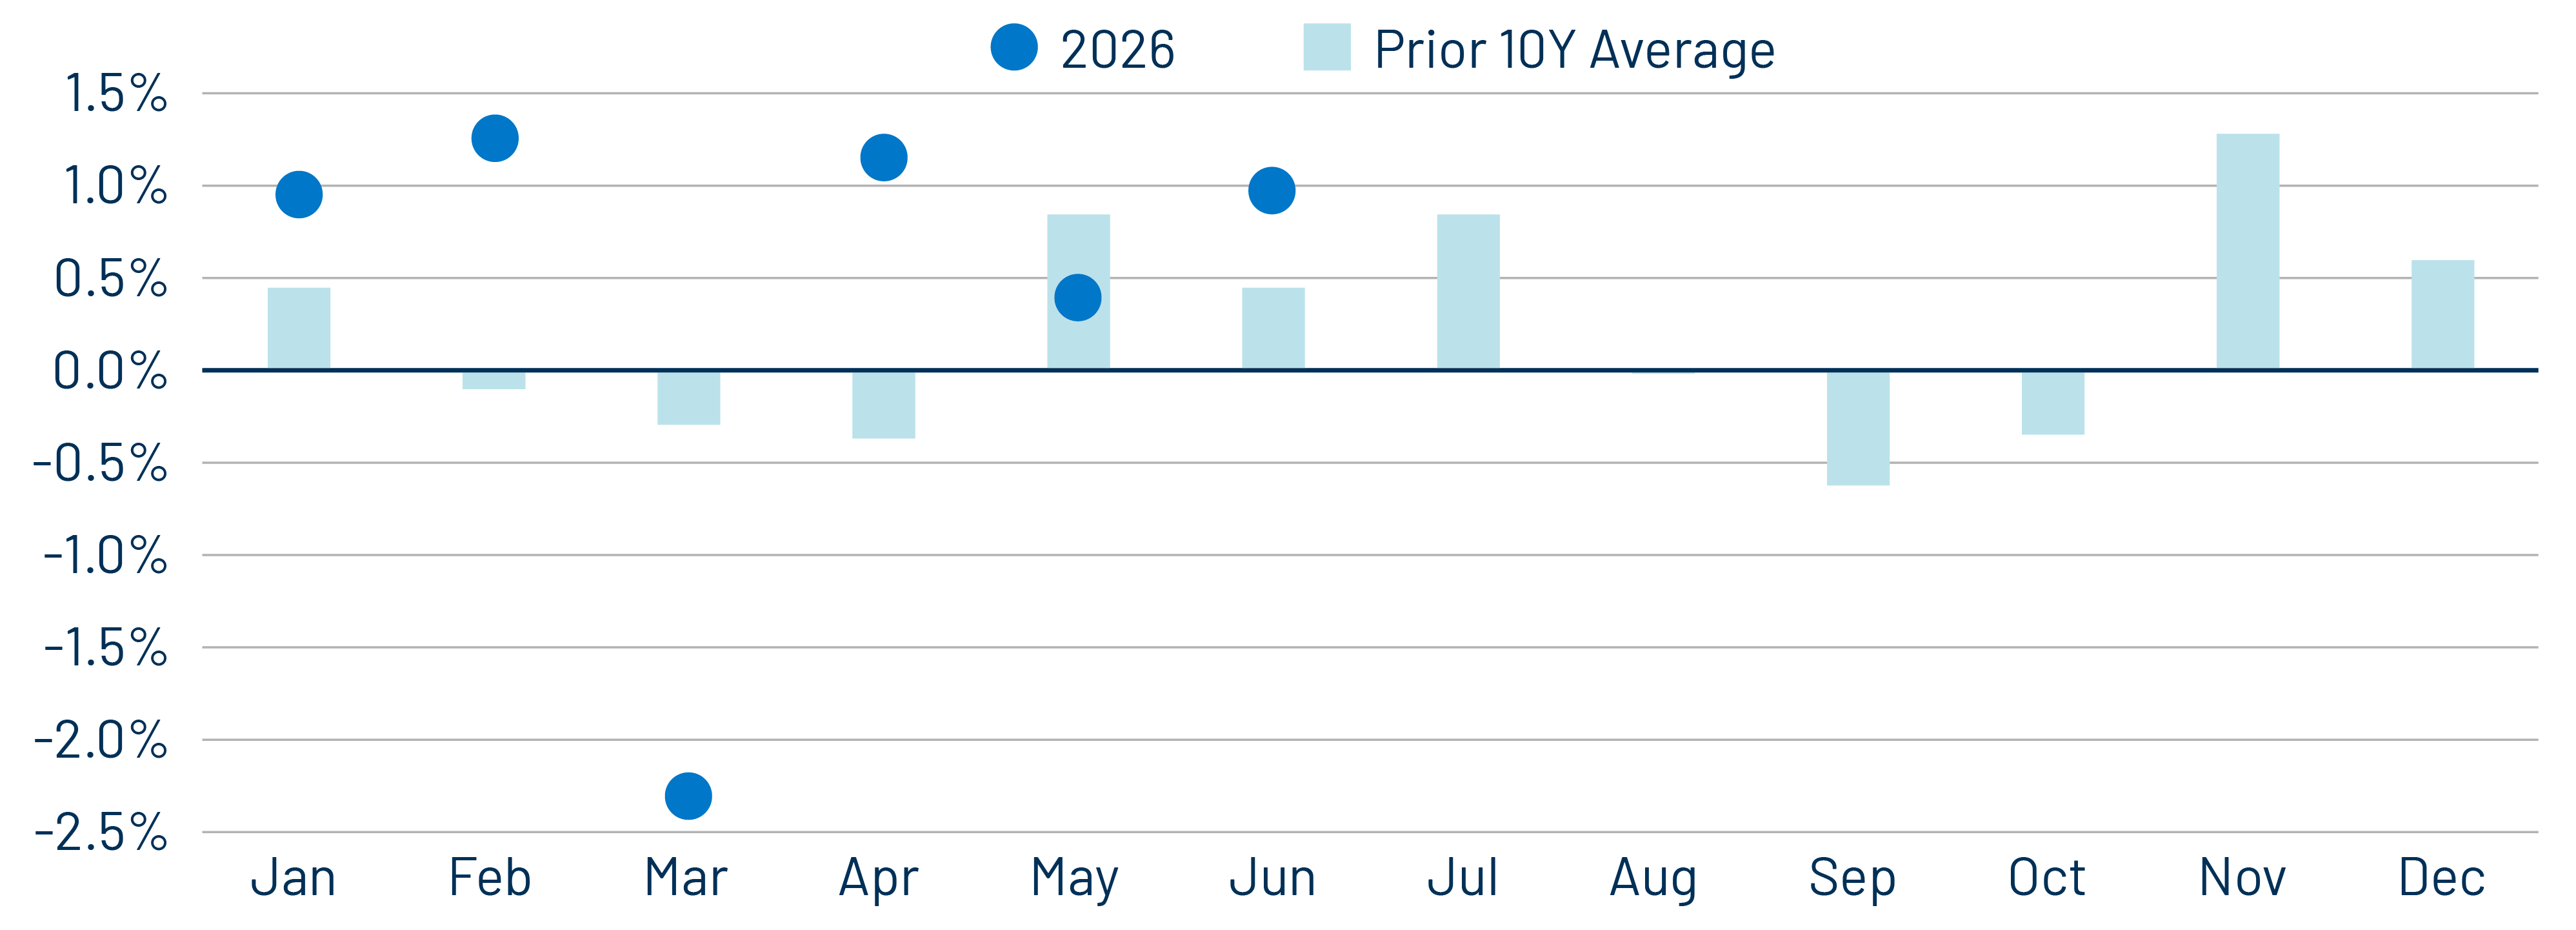
Exhibit 1: 10-Year Average Muni Monthly Returns vs. 2026
10-Year Average Muni Monthly Returns vs. 2026
Source: Bloomberg, Western Asset. As of 30 Jun 26. Select the image to expand the view.

Supply trends have historically supported municipal performance during the summer months. While gross issuance is often strong in June, elevated coupon payments, maturities and called bonds can meaningfully reduce net supply through the summer reinvestment period. From 2015 through 2023, the municipal market recorded negative net supply, on average, from June through September. As issuance rebounded in 2024 and 2025, the market shifted back to positive net supply, although summer issuance still represented one of the lighter seasonal periods in those years. In 2026, supply has remained elevated relative to prior record-year levels, resulting in positive net supply and a continued departure from the historical summer pattern.
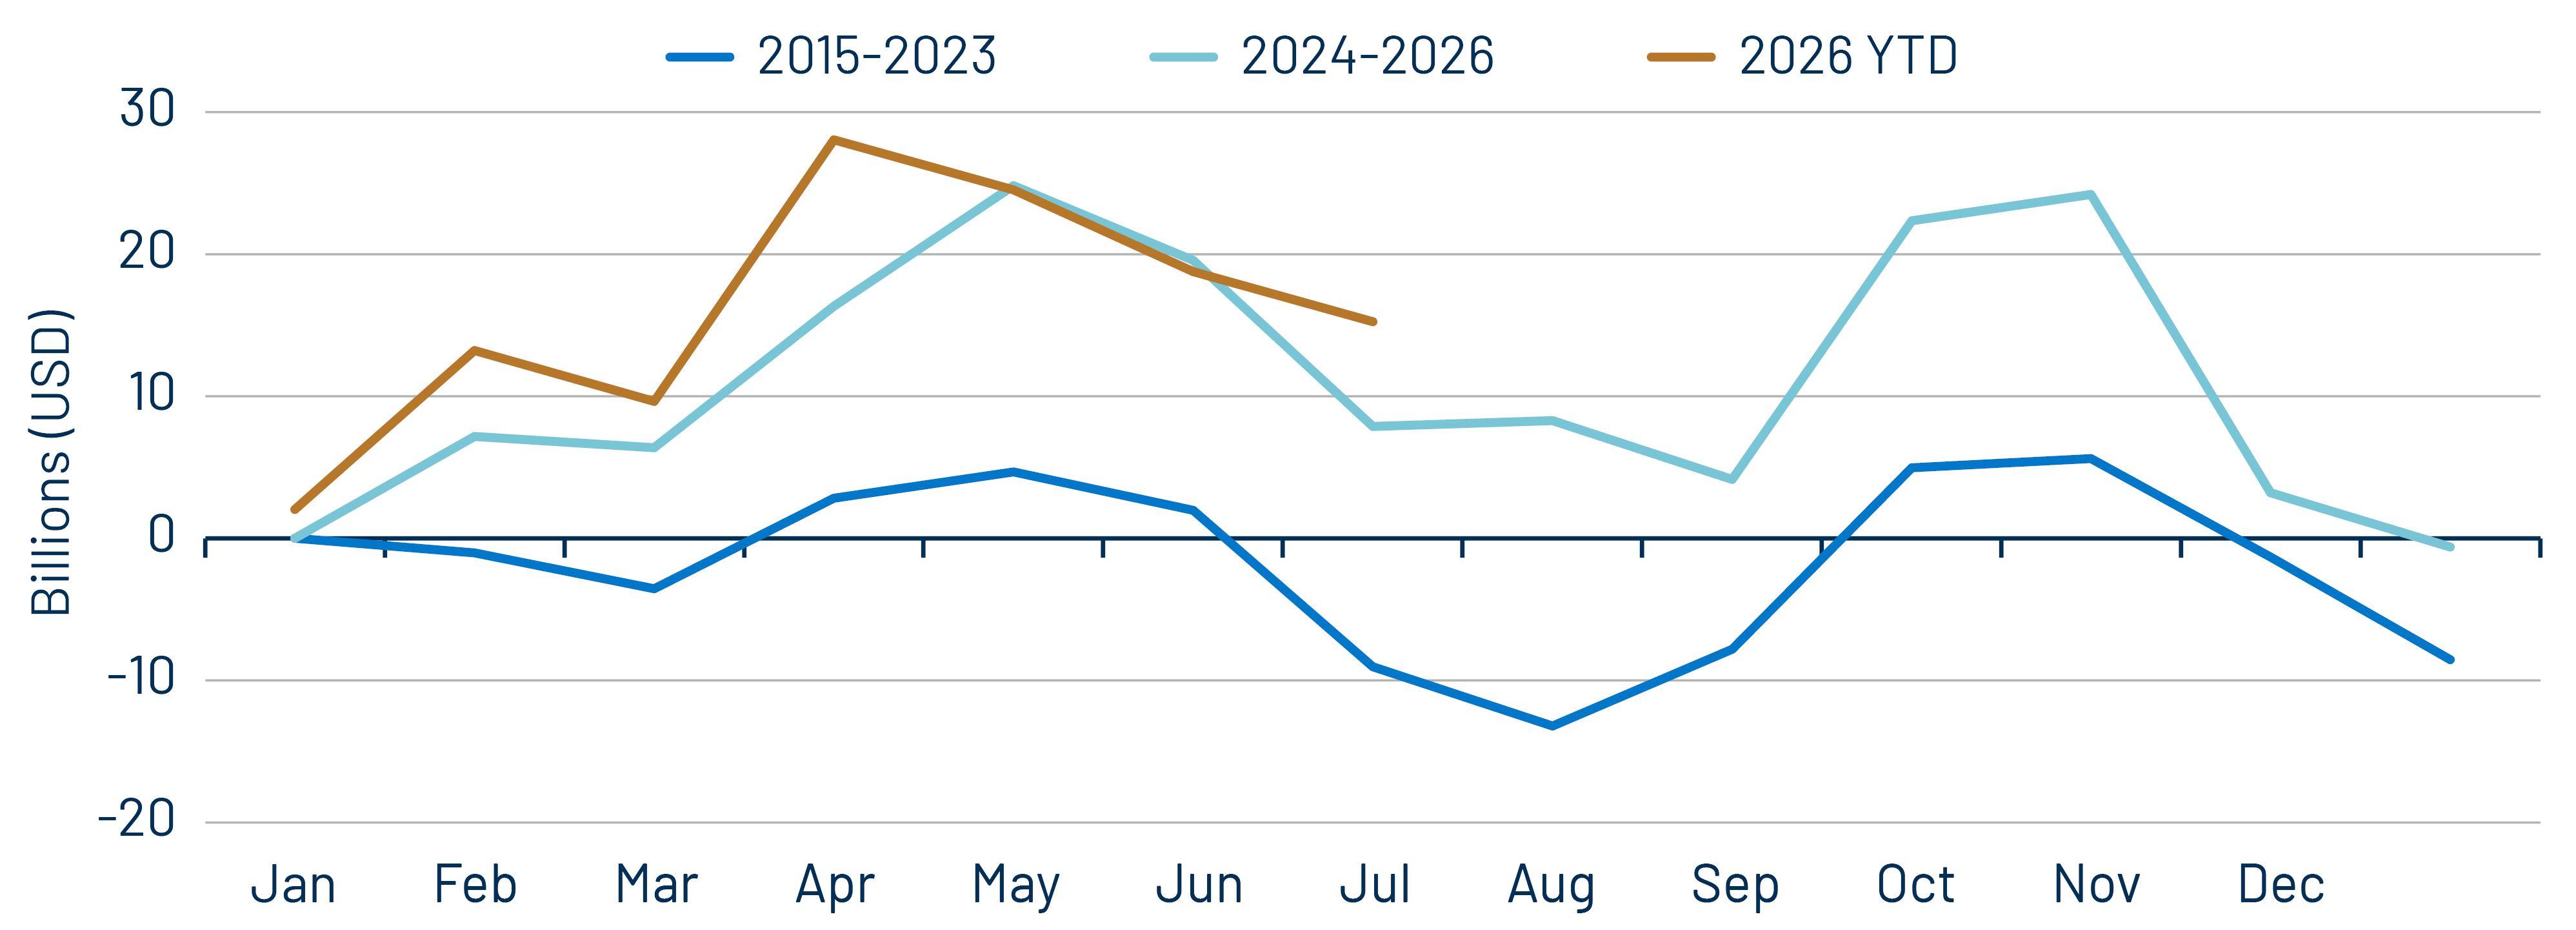
Exhibit 2: Tax-Exempt Net Supply Trends
Tax-Exempt Net Supply Trends
Source: Bloomberg, Western Asset. As of 30 Jun 26. Select the image to expand the view.

Strong municipal performance despite elevated supply underscores the strength of demand observed this year. According to ICI and Lipper data, YTD municipal fund inflows of $64 billion represent the second-highest calendar-year total on record and bring cumulative municipal fund inflows since January 2024 to $172 billion, approaching prior record inflow-cycle levels. In addition, separately managed account (SMA) demand remains robust and persistent. According to Cerulli Associates’ 2Q26 SMA Report, managed municipal SMA assets increased $65 billion during the first quarter of 2026, nearly double the increase in municipal mutual fund assets over the same period.
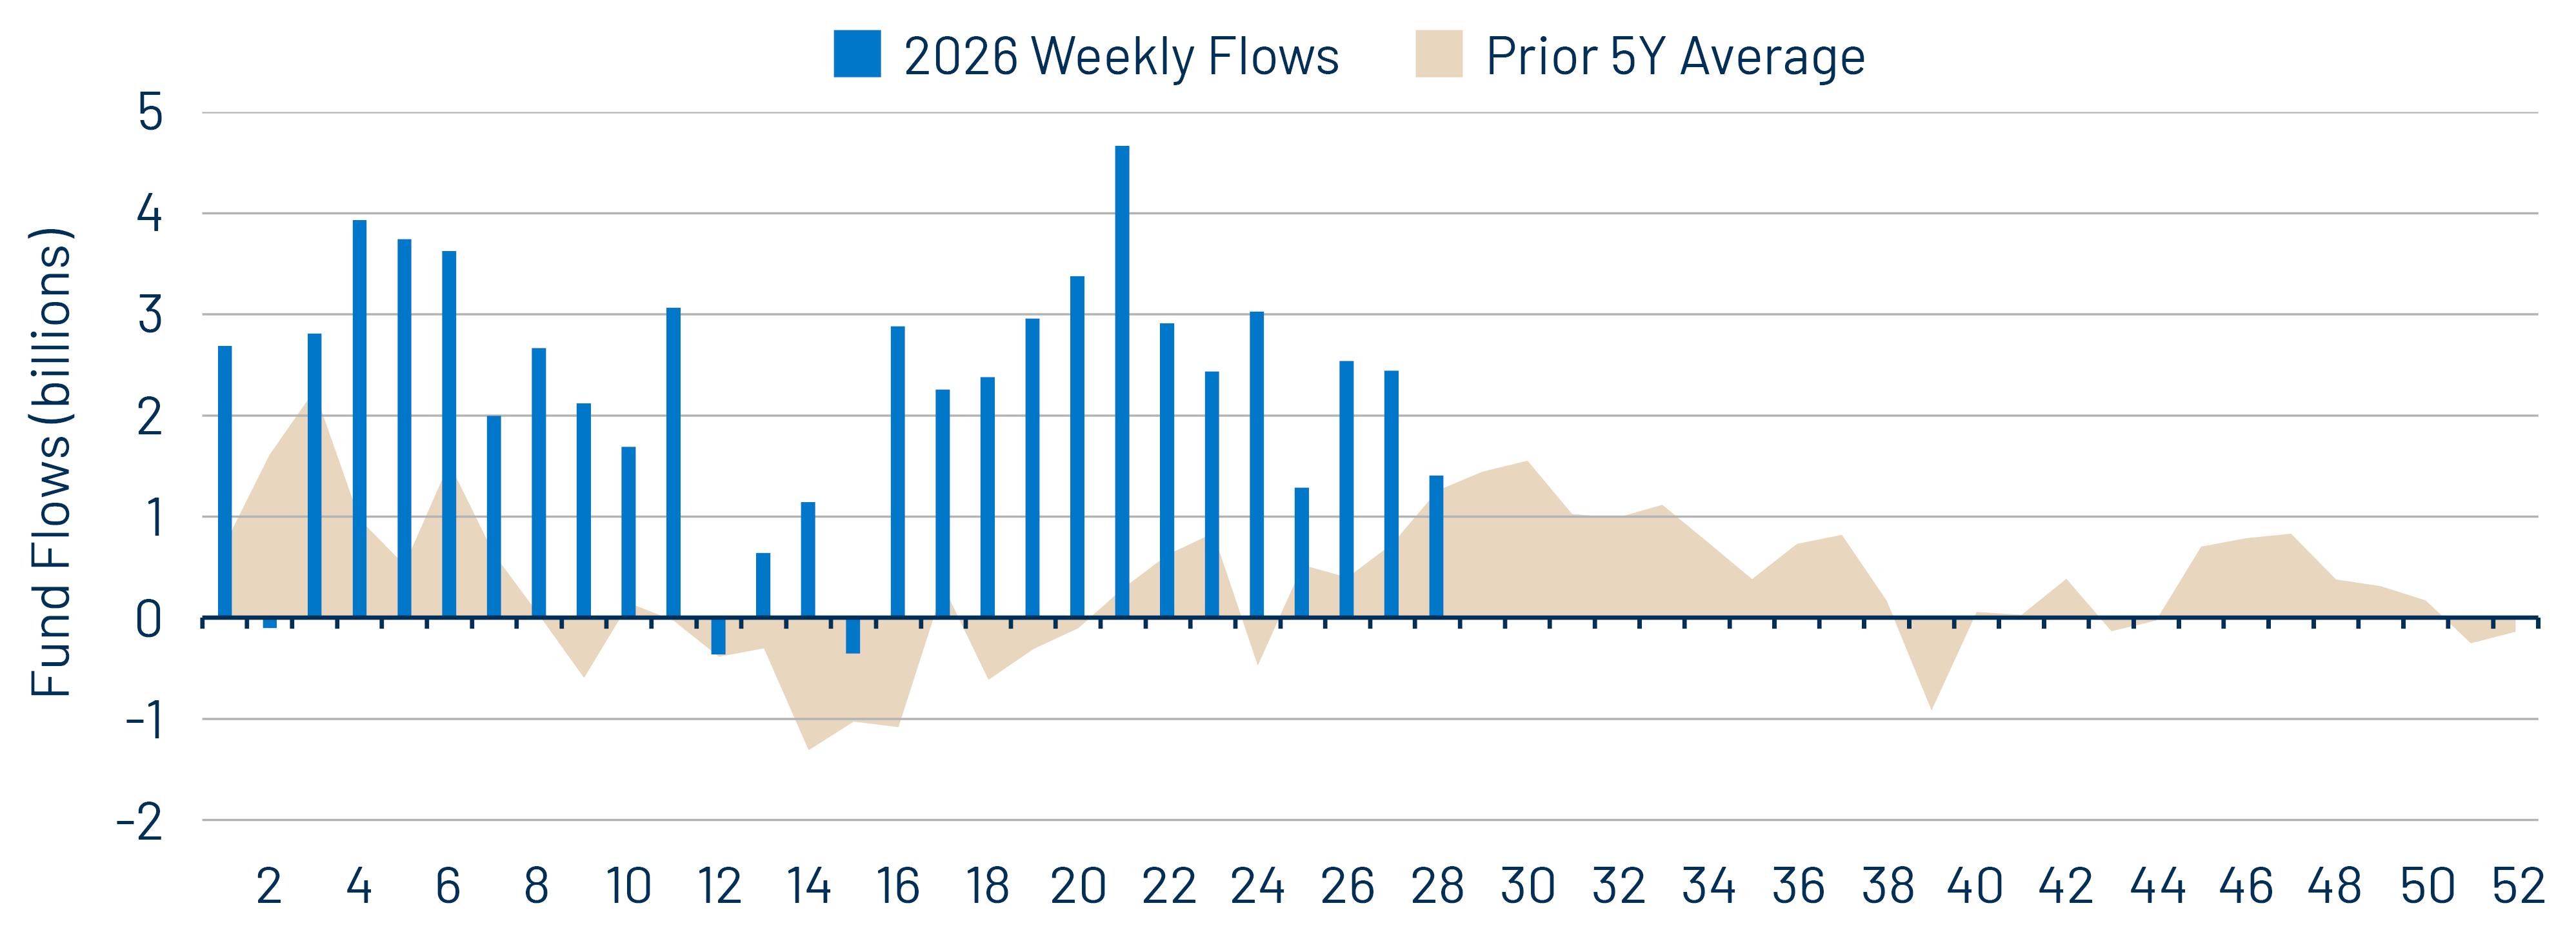
Exhibit 3: Municipal Demand Has Maintained an Above-Average Pace
Municipal Demand Has Maintained an Above-Average Pace
Source: ICI (weeks prior to 15 Jul 26), Lipper (week of 15 Jul 26), Western Asset. As of 15 Jul 26. Select the image to expand the view.

Continued demand from both mutual funds and SMAs should remain supportive of municipal market technicals despite elevated supply levels. While municipals have outperformed other fixed-income sectors so far this year, our view is that elevated issuance should continue to create attractive opportunities for active investors. Periodic increases in supply may create temporary price dislocations, but we believe those episodes are more likely to present attractive entry points than undermine the broader technical backdrop.

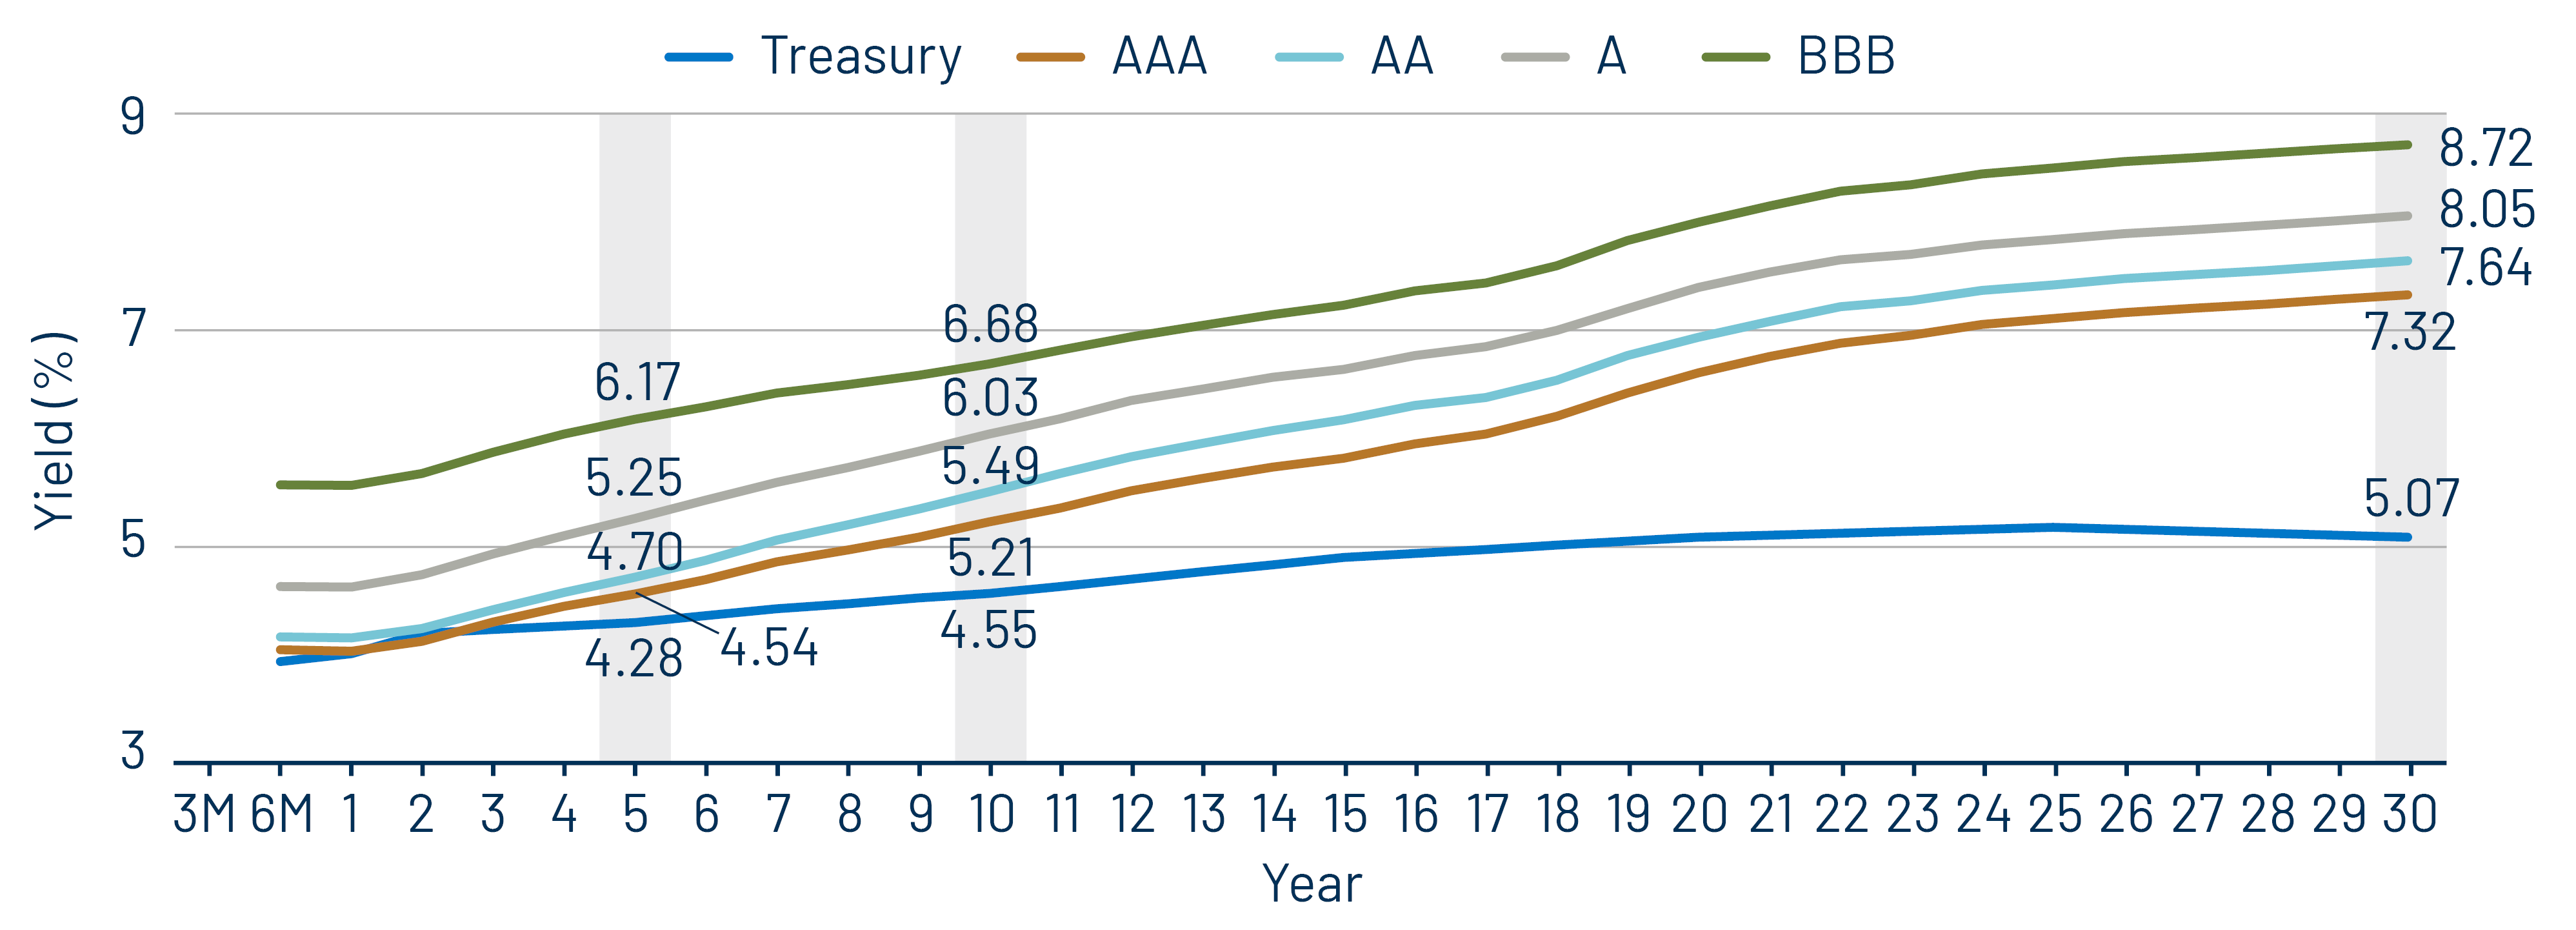
Municipal Credit Curves and Relative Value
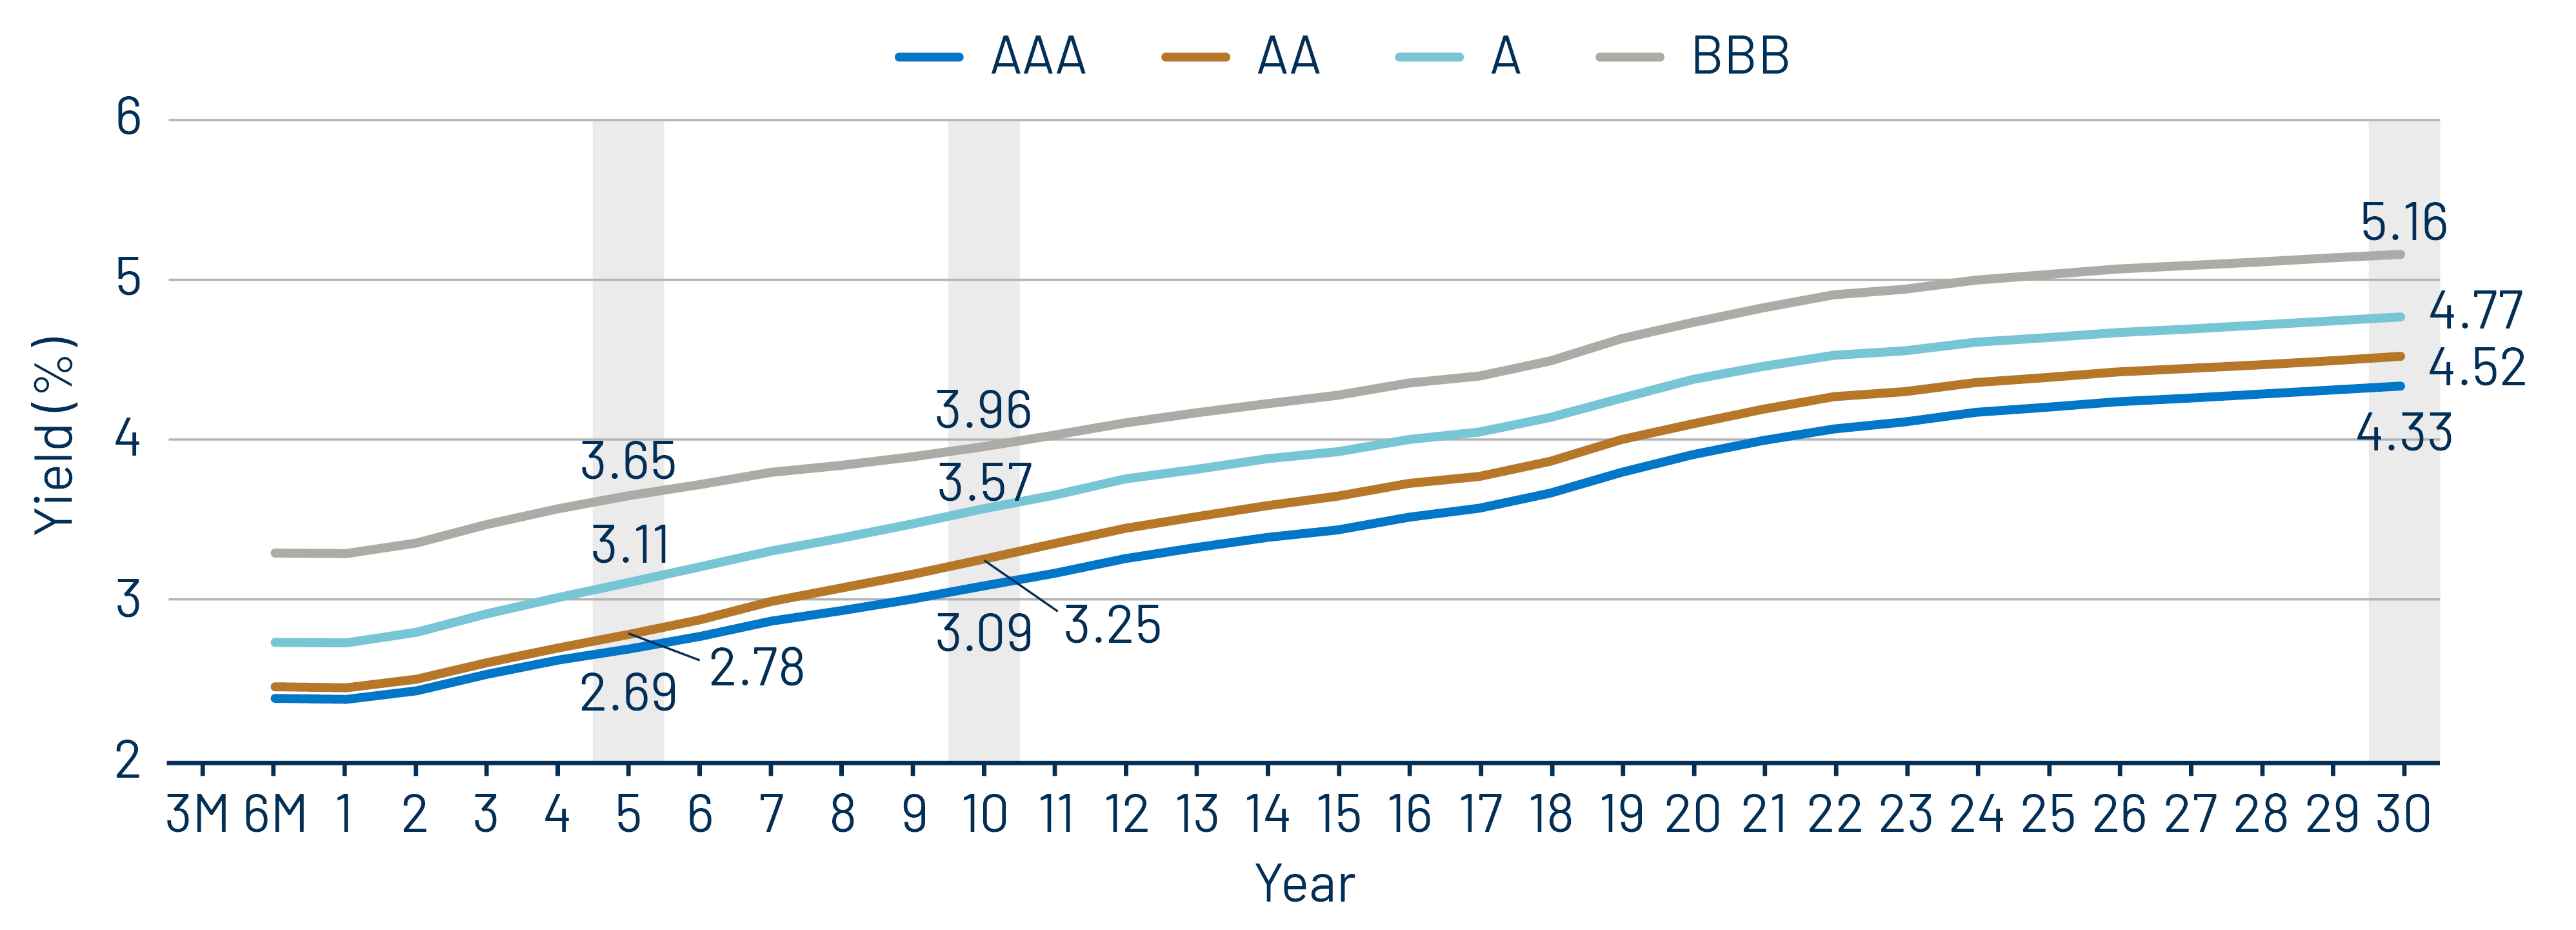
Exhibit 4: Muni Credit Curves
Muni Credit Curves
Source: Bloomberg, Western Asset. As of 17 Jul 26. Bloomberg Valuation Service (BVAL) Municipal Credit Indices (AAA, AA, A, BBB, respectively) and US Sovereign Curves. Taxable-Equivalent Muni Credit Curves consider the top marginal effective tax rate of 40.8%. AA Muni is represented by the US General Obligation AA Muni BVAL Yield Curve. The BVAL curve is populated with pricing from uninsured AA General Obligation bonds. A Muni is represented by the US General Obligation A Muni BVAL Yield Curve. The BVAL curve is populated with pricing from uninsured A General Obligation bonds. BBB Muni is represented by the US General Obligation BBB Muni BVAL Yield Curve. The BVAL curve is populated with pricing from uninsured BBB General Obligation bonds. Indices are unmanaged and one cannot directly invest in them. They do not include fees, expenses or sales charges. Past performance is not an indicator or a guarantee of future results. Select the image to expand the view.
Exhibit 5: Taxable-Equivalent Muni Credit Curves
Taxable-Equivalent Muni Credit Curves
Source: Bloomberg, Western Asset. As of 17 Jul 26. Bloomberg Valuation Service (BVAL) Municipal Credit Indices (AAA, AA, A, BBB, respectively) and US Sovereign Curves. Taxable-Equivalent Muni Credit Curves consider the top marginal effective tax rate of 40.8%. AA Muni is represented by the US General Obligation AA Muni BVAL Yield Curve. The BVAL curve is populated with pricing from uninsured AA General Obligation bonds. A Muni is represented by the US General Obligation A Muni BVAL Yield Curve. The BVAL curve is populated with pricing from uninsured A General Obligation bonds. BBB Muni is represented by the US General Obligation BBB Muni BVAL Yield Curve. The BVAL curve is populated with pricing from uninsured BBB General Obligation bonds. Indices are unmanaged and one cannot directly invest in them. They do not include fees, expenses or sales charges. Past performance is not an indicator or a guarantee of future results. Select the image to expand the view.
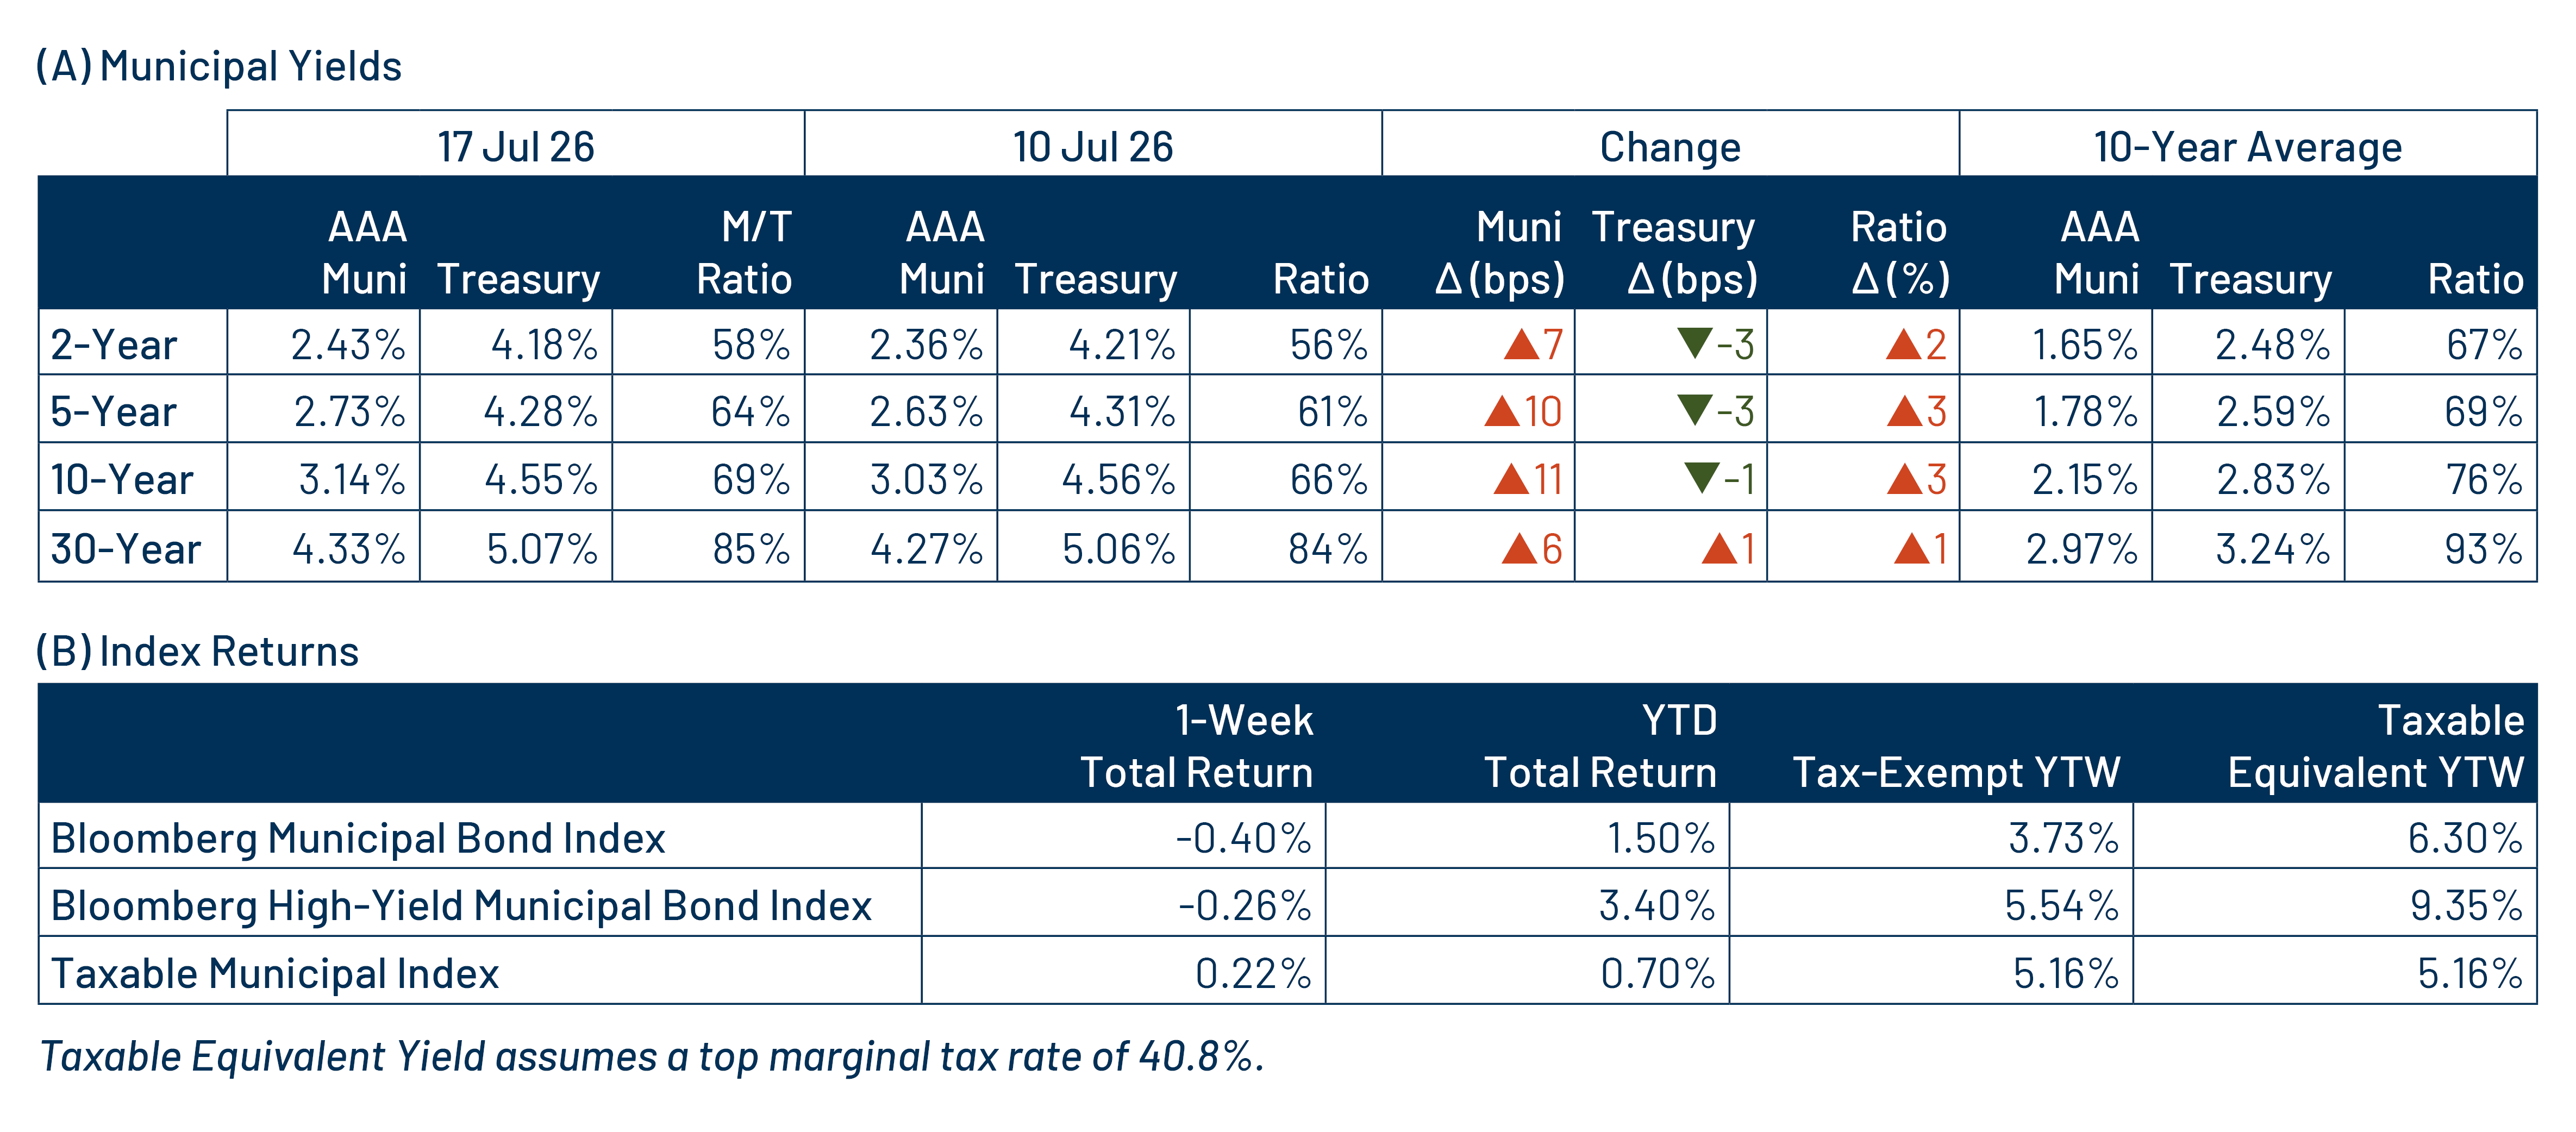
Exhibit 6: AAA Munis vs. Treasuries
AAA Munis vs. Treasuries
Source: Muni Yields: Thomson Reuters MMD, Treasury Yields: Bloomberg. As of 17 Jul 26. Past performance is not a guarantee of future results. It is not possible to invest directly in an index. Select the image to expand the view.
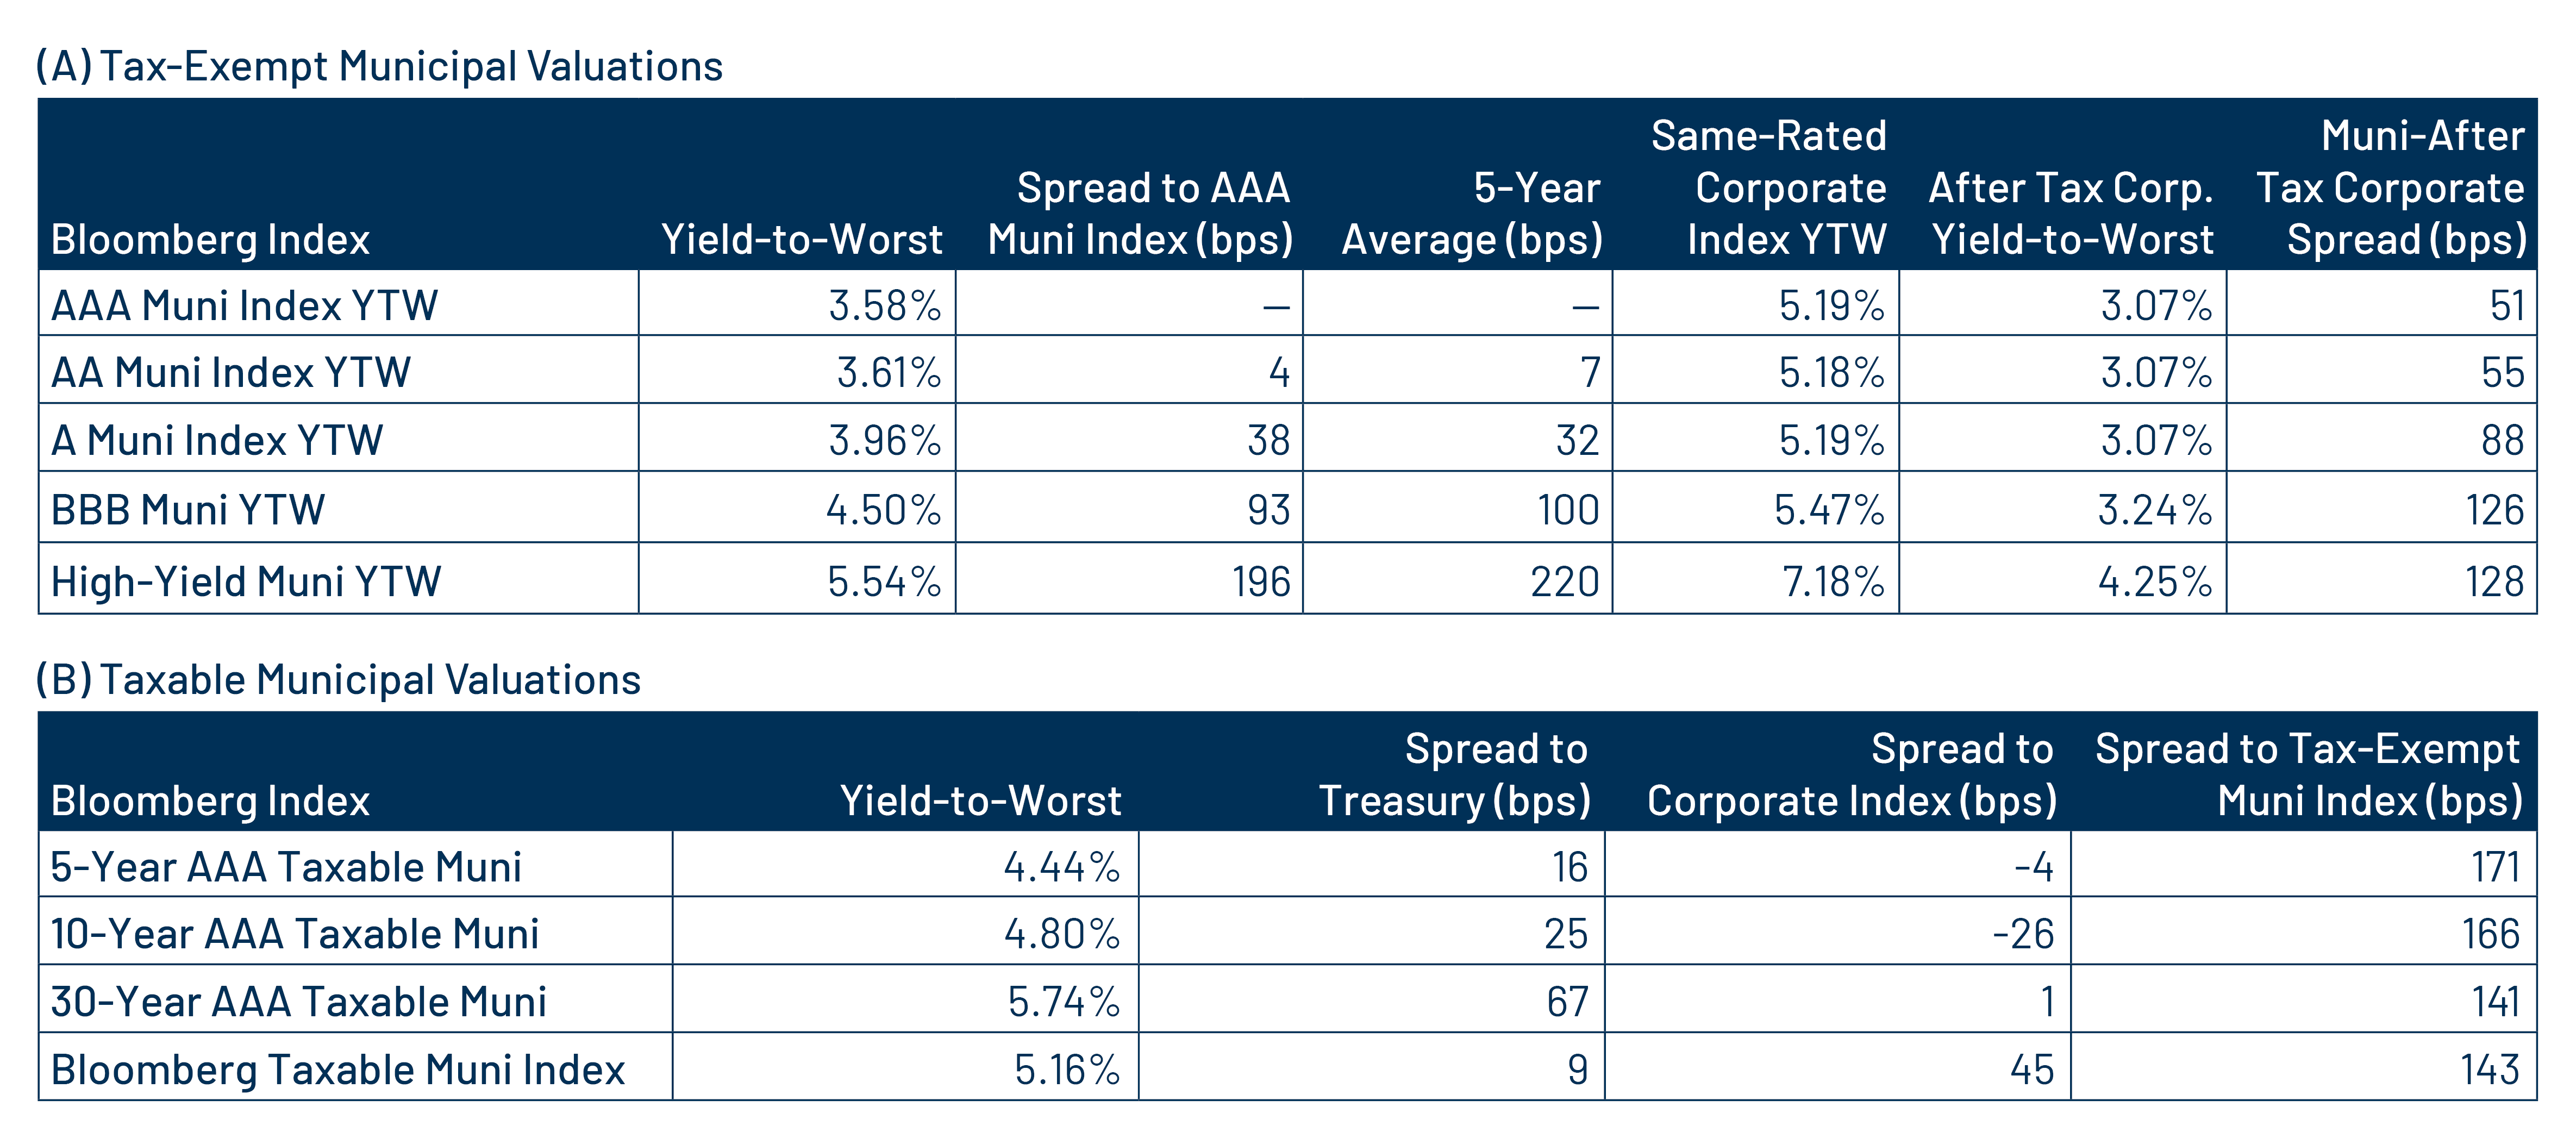
Exhibit 7: Tax-Exempt and Taxable Muni Valuations
Tax-Exempt and Taxable Muni Valuations
Source: Bloomberg, Western Asset. As of 17 Jul 26. Yield-to-worst (YTW) is the lowest potential yield that can be received on a bond without the issuer actually defaulting. AAA, AA, A, BBB Corporate Indices; After-Tax Yield assumes a top effective tax rate of 40.8%. Taxable Muni Index Corporate comparable used is the Global Corporate Aggregate (ex. BBB) to better align credit quality and duration. Select the image to expand the view.

Western Asset Key Themes for Muni Investors

Theme 1: Municipal taxable-equivalent yields remain elevated relative to historical averages.
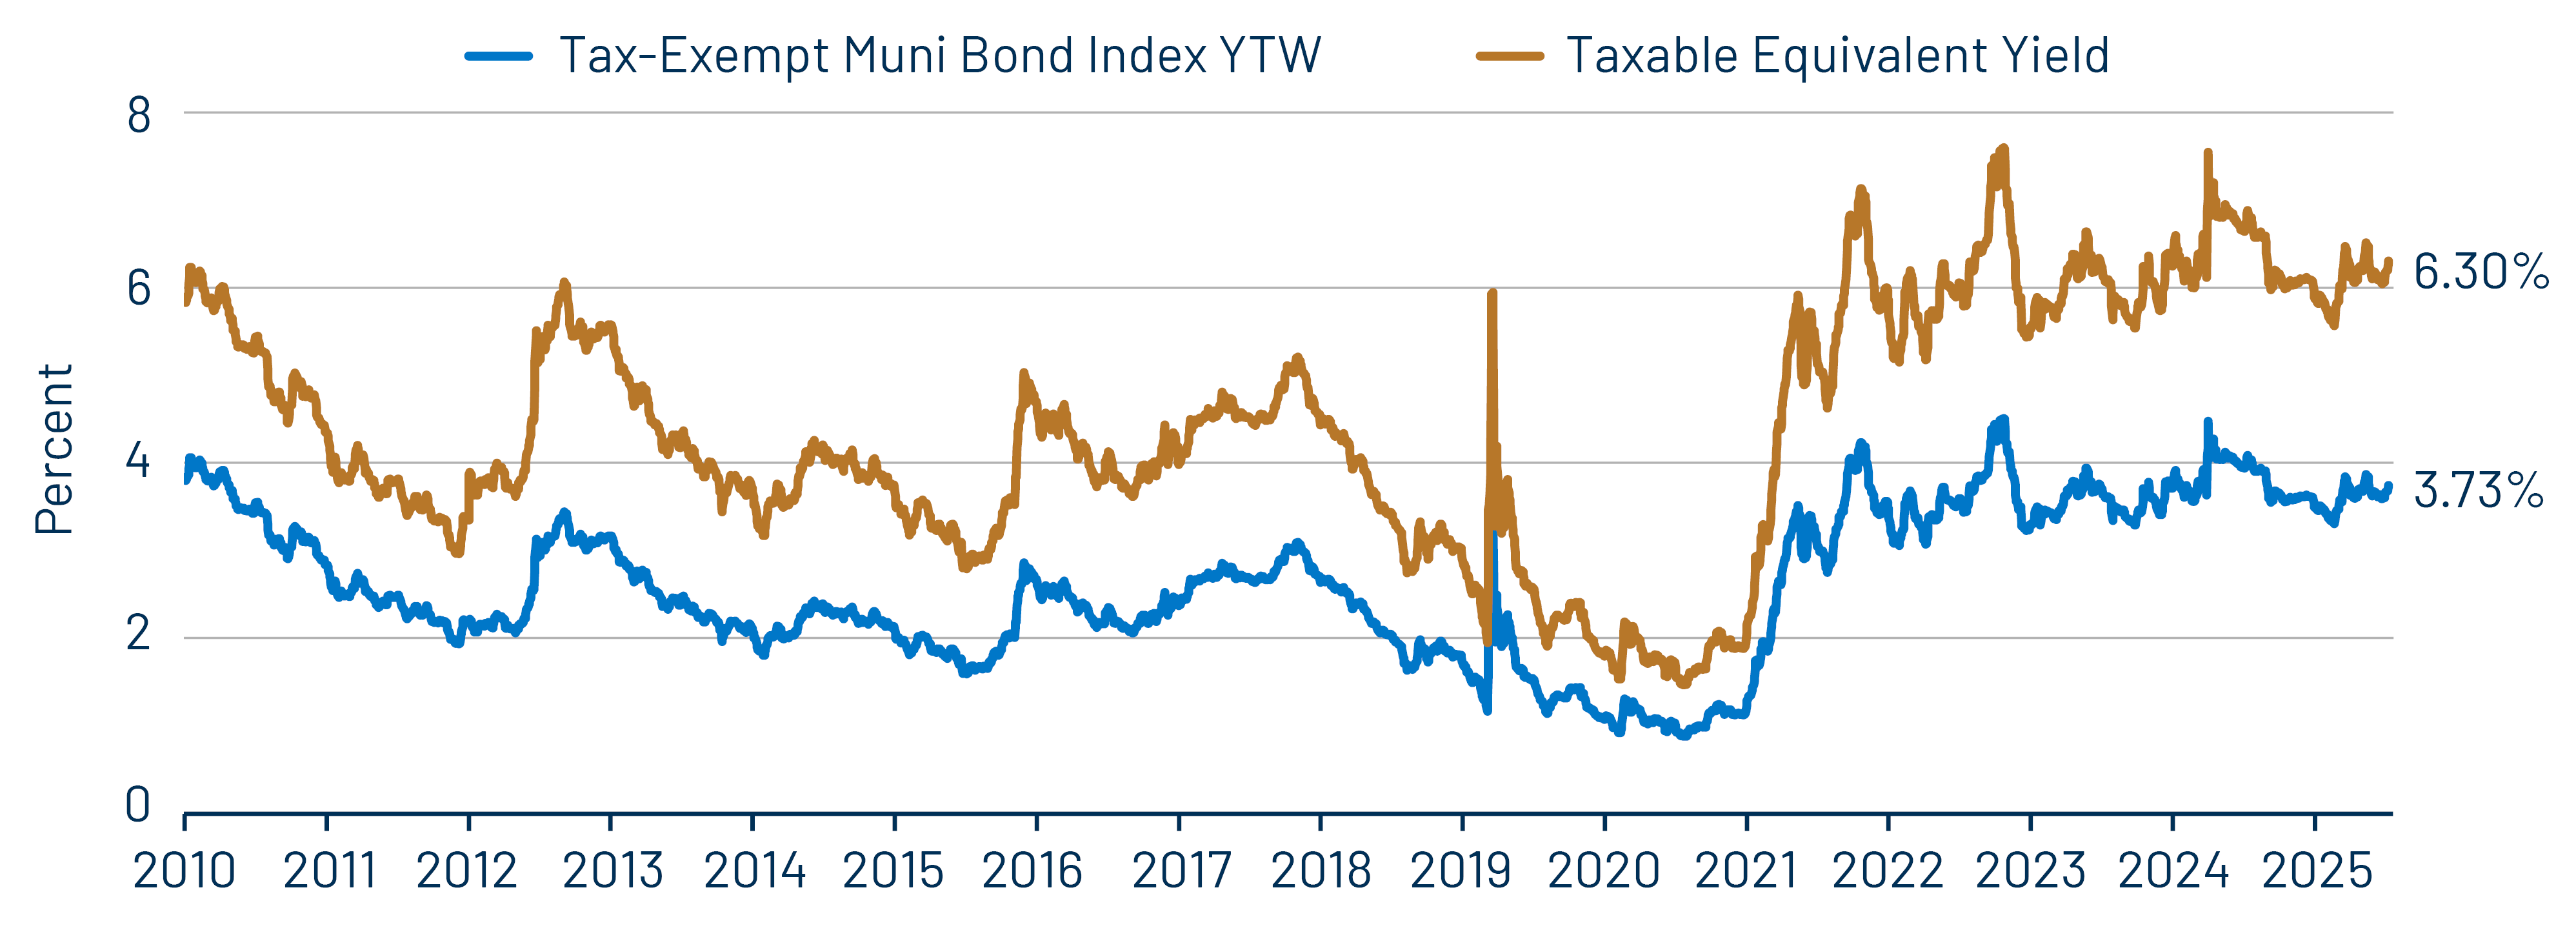
Exhibit 8: Muni and Taxable-Equivalent Muni Yield-to-Worst
Muni and Taxable-Equivalent Muni Yield-to-Worst
Source: Bloomberg, Western Asset. As of 17 Jul 26. Bloomberg Municipal Bond Index yield considering highest marginal tax rate of 40.8%. Indexes are unmanaged and one cannot directly invest in them. They do not include fees, expenses or sales charges. Past performance is not an indicator or a guarantee of future results. Select the image to expand the view.

Theme 2: Munis offer attractive after-tax yield pickup vs. longer-duration or lower-quality taxable alternatives.
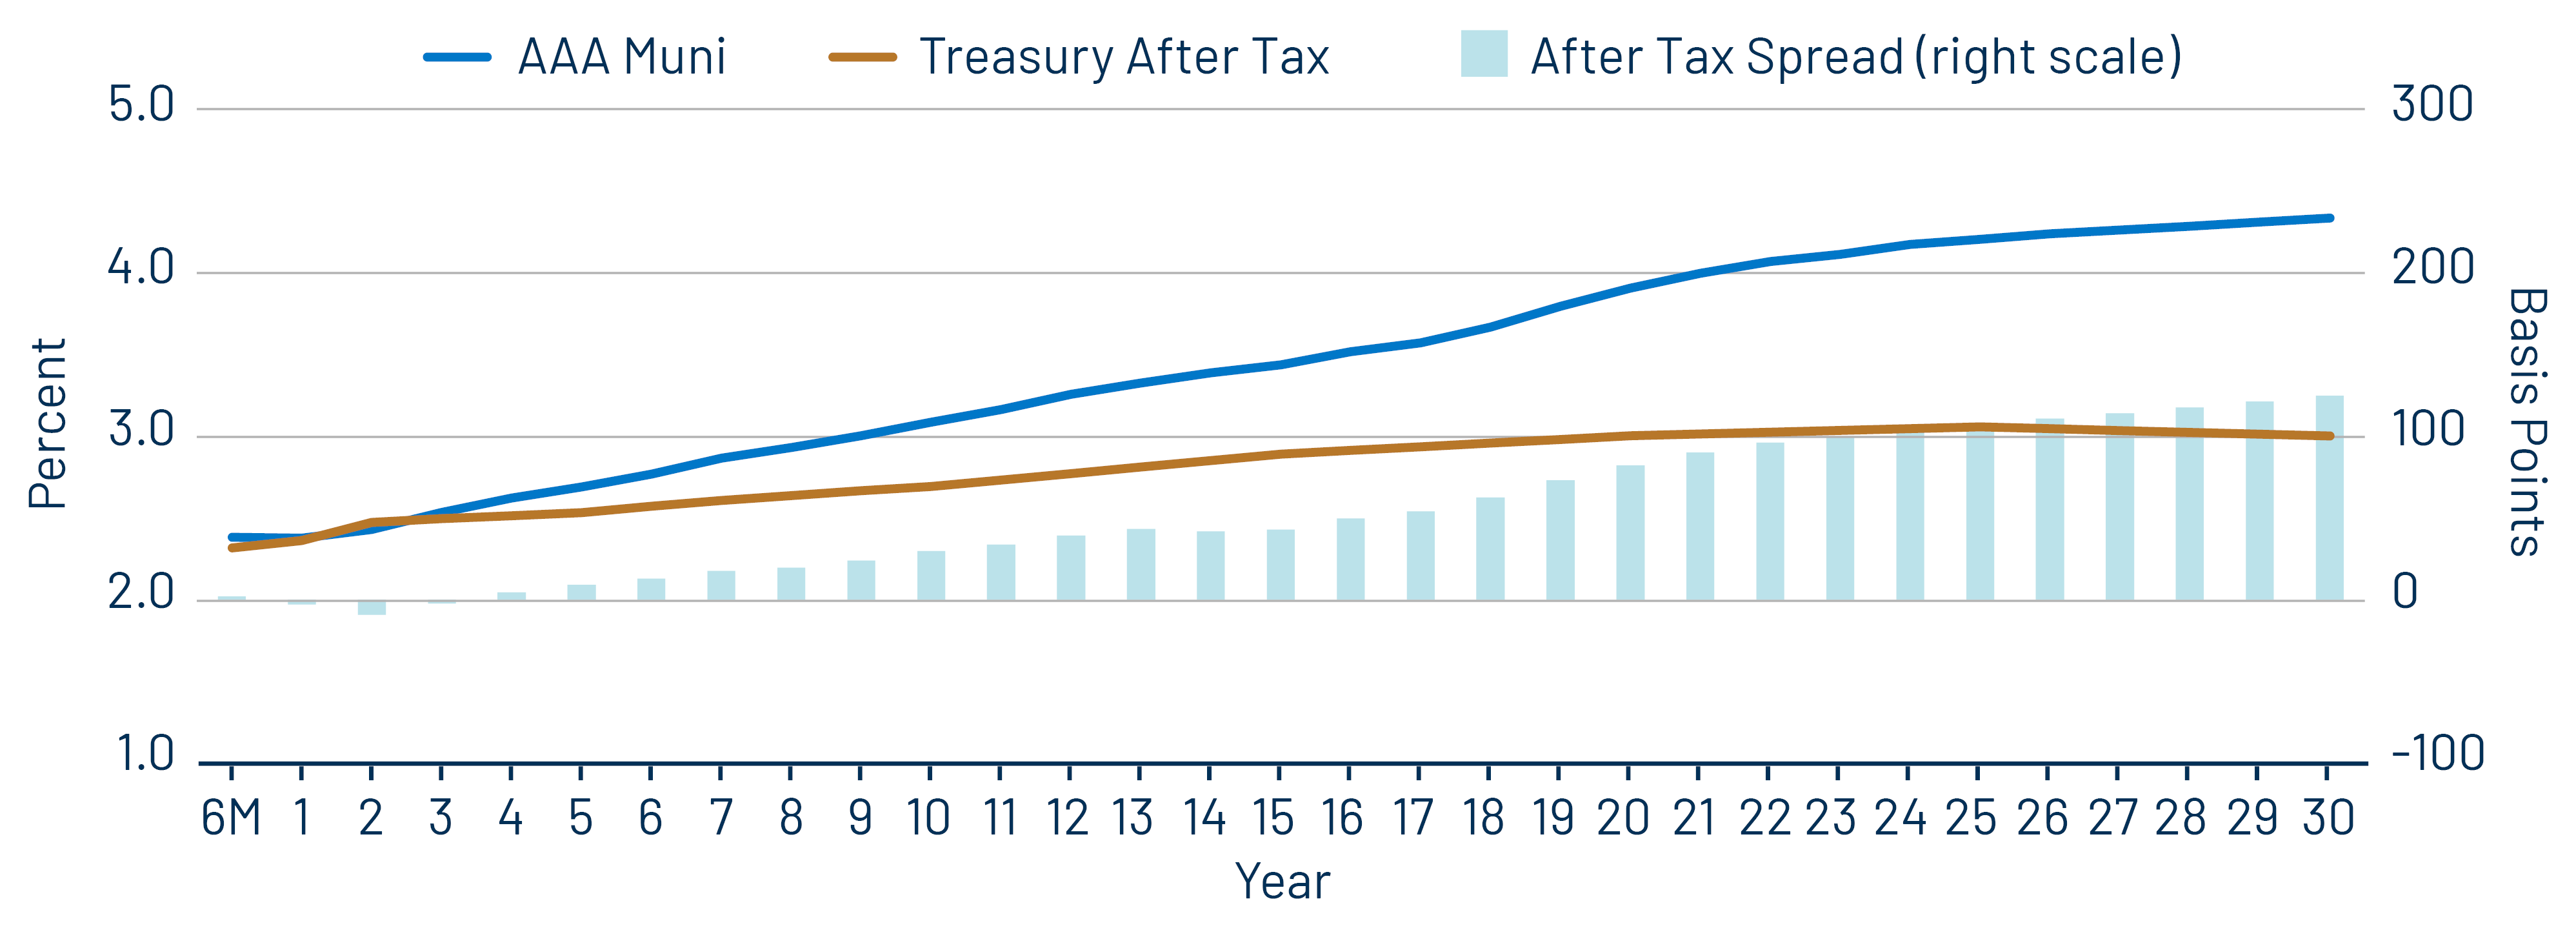
Exhibit 9: AAA Municipal vs. Treasury Yield Curves
AAA Municipal vs. Treasury Yield Curves
Source: Bloomberg, Western Asset. As of 17 Jul 26. Bloomberg Valuation Service (BVAL) AAA Muni Curve and US On-/Off-the-Run Sovereign Curve. Indexes are unmanaged and one cannot directly invest in them. They do not include fees, expenses or sales charges. Past performance is not an indicator or a guarantee of future results. Select the image to expand the view.

Theme 3: The muni curve remains steep and offers relative value in longer maturities.
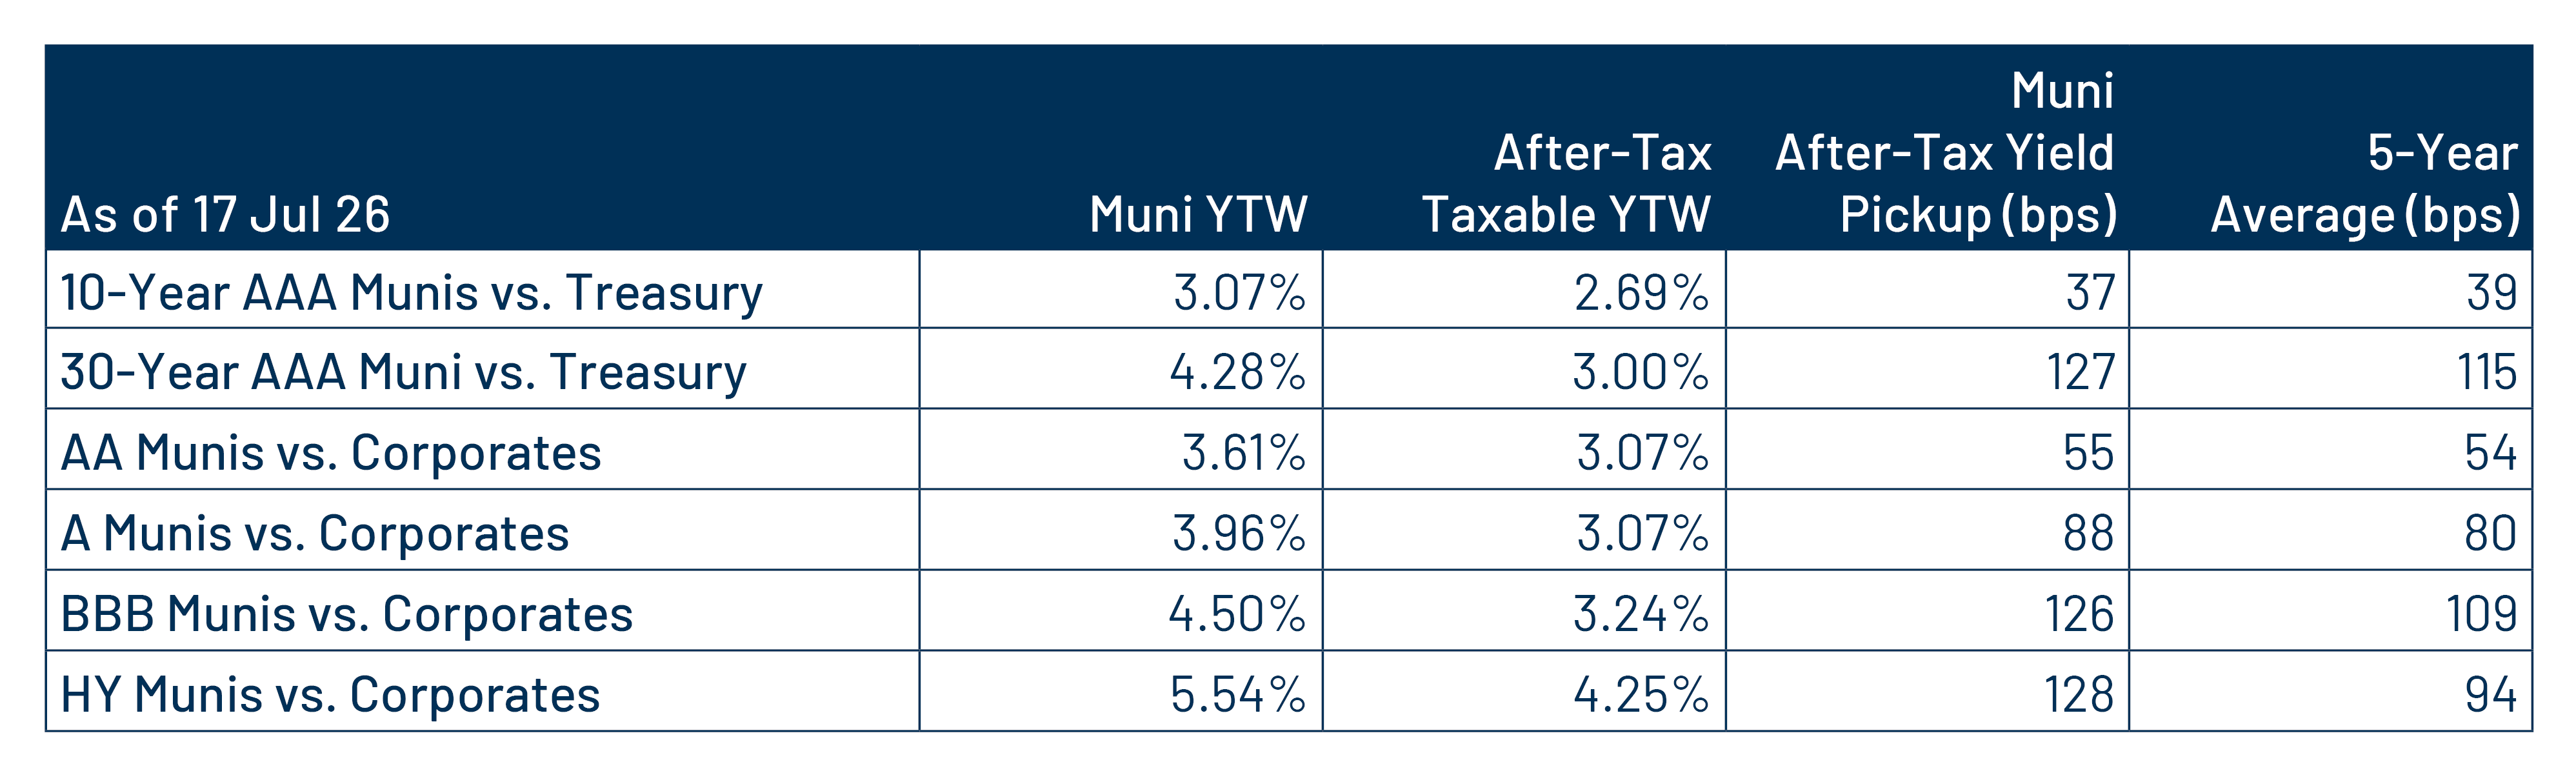
Exhibit 10: Municipal vs. Taxable Fixed-Income Yields by Quality
Municipal vs. Taxable Fixed-Income Yields by Quality
Source: Western Asset, Bloomberg. As of 17 Jul 26. 10- and 30-Year comparison reflects Bloomberg Valuation Service (BVAL) AAA Muni Curve and US On-/Off-the-Run Sovereign Curve. AA Muni reflects the Bloomberg AA Muni Bond Index. A Muni reflects the Bloomberg A Muni Bond Index. BBB Muni reflects the Bloomberg BBB Muni Bond Index. HY Muni reflects the Bloomberg High Yield Muni Bond Index. AA Corp reflects the Bloomberg AA Corporate Bond Index. A Corp reflects the Bloomberg A Corporate Bond Index. BBB Corp reflects the Bloomberg BBB Corporate Bond Index. After-tax yield considers the top marginal tax rate of 40.8%. Indexes are unmanaged and one cannot directly invest in them. They do not include fees, expenses or sales charges. Past performance is not an indicator or a guarantee of future results. Select the image to expand the view.

© Western Asset Management Company, LLC 2026. The information contained in these materials ("the materials") is intended for the exclusive use of the designated recipient ("the recipient"). This information is proprietary and confidential and may contain commercially sensitive information, and may not be copied, reproduced or republished, in whole or in part, without the prior written consent of Western Asset Management Company ("Western Asset").
Past performance does not predict future returns. These materials should not be deemed to be a prediction or projection of future performance. These materials are intended for investment professionals including professional clients, eligible counterparties, and qualified investors only.
For the Franklin Templeton global-non product disclosures, please click here.
These materials have been produced for illustrative and informational purposes only. These materials contain Western Asset's opinions and beliefs as of the date designated on the materials; these views are subject to change and may not reflect real-time market developments and investment views.
Third party data may be used throughout the materials, and this data is believed to be accurate to the best of Western Asset's knowledge at the time of publication, but cannot be guaranteed. These materials may also contain strategy or product awards or rankings from independent third parties or industry publications which are based on unbiased quantitative and/or qualitative information determined independently by each third party or publication. In some cases, Western Asset may subscribe to these third party's standard industry services or publications. These standard subscriptions and services are available to all asset managers and do not influence rankings or awards in any way.
Investment strategies or products discussed herein may involve a high degree of risk, including the loss of some or all capital. Investments in any products or strategies described in these materials may be volatile, and investors should have the financial ability and willingness to accept such risks.
Unless otherwise noted, investment performance contained in these materials is reflective of a strategy composite. All other strategy data and information included in these materials reflects a representative portfolio which is an account in the composite that Western Asset believes most closely reflects the current portfolio management style of the strategy. Performance is not a consideration in the selection of the representative portfolio. The characteristics of the representative portfolio shown may differ from other accounts in the composite. Information regarding the representative portfolio and the other accounts in the composite are available upon request. Statements in these materials should not be considered investment advice. References, either general or specific, to securities and/or issuers in the materials are for illustrative purposes only and are not intended to be, and should not be interpreted as, recommendation to purchase or sell such securities. Employees and/or clients of Western Asset may have a position in the securities or issuers mentioned.
These materials are not intended to provide, and should not be relied on for, accounting, legal, tax, investment or other advice. The recipient should consult its own counsel, accountant, investment, tax, and any other advisers for this advice, including economic risks and merits, related to making an investment with Western Asset. The recipient is responsible for observing the applicable laws and regulations of their country of residence.
Founded in 1971, Western Asset Management Company is a global fixed-income investment manager with offices in Pasadena, New York, London, Singapore, Tokyo, Melbourne, São Paulo, Hong Kong, and Zürich. Western Asset is a wholly owned subsidiary of Franklin Resources, Inc. but operates autonomously. Western Asset is comprised of six legal entities across the globe, each with distinct regional registrations: Western Asset Management Company, LLC, a registered Investment Adviser with the Securities and Exchange Commission; Western Asset Management Company Ltda. is regulated by Comissão de Valores Mobiliários; Western Asset Management Company Pty Ltd ABN 41 117 767 923 is the holder of the Australian Financial Services License 303160; Western Asset Management Company Pte. Ltd. Co. Reg. No. 200007692R is a holder of a Capital Markets Services License for fund management and regulated by the Monetary Authority of Singapore; Western Asset Management Company Ltd, a registered Financial Instruments Business Operator and regulated by the Financial Services Agency of Japan; and Western Asset Management Company Limited is authorised and regulated by the Financial Conduct Authority ("FCA") (FRN 145930). This communication is intended for distribution to Professional Clients only if deemed to be a financial promotion in the UK as defined by the FCA. This communication may also be intended for certain EEA countries where Western Asset has been granted permission to do so. For the current list of the approved EEA countries please contact Western Asset at +44 (0)20 7422 3000.