Municipals Posted Negative Returns Last Week
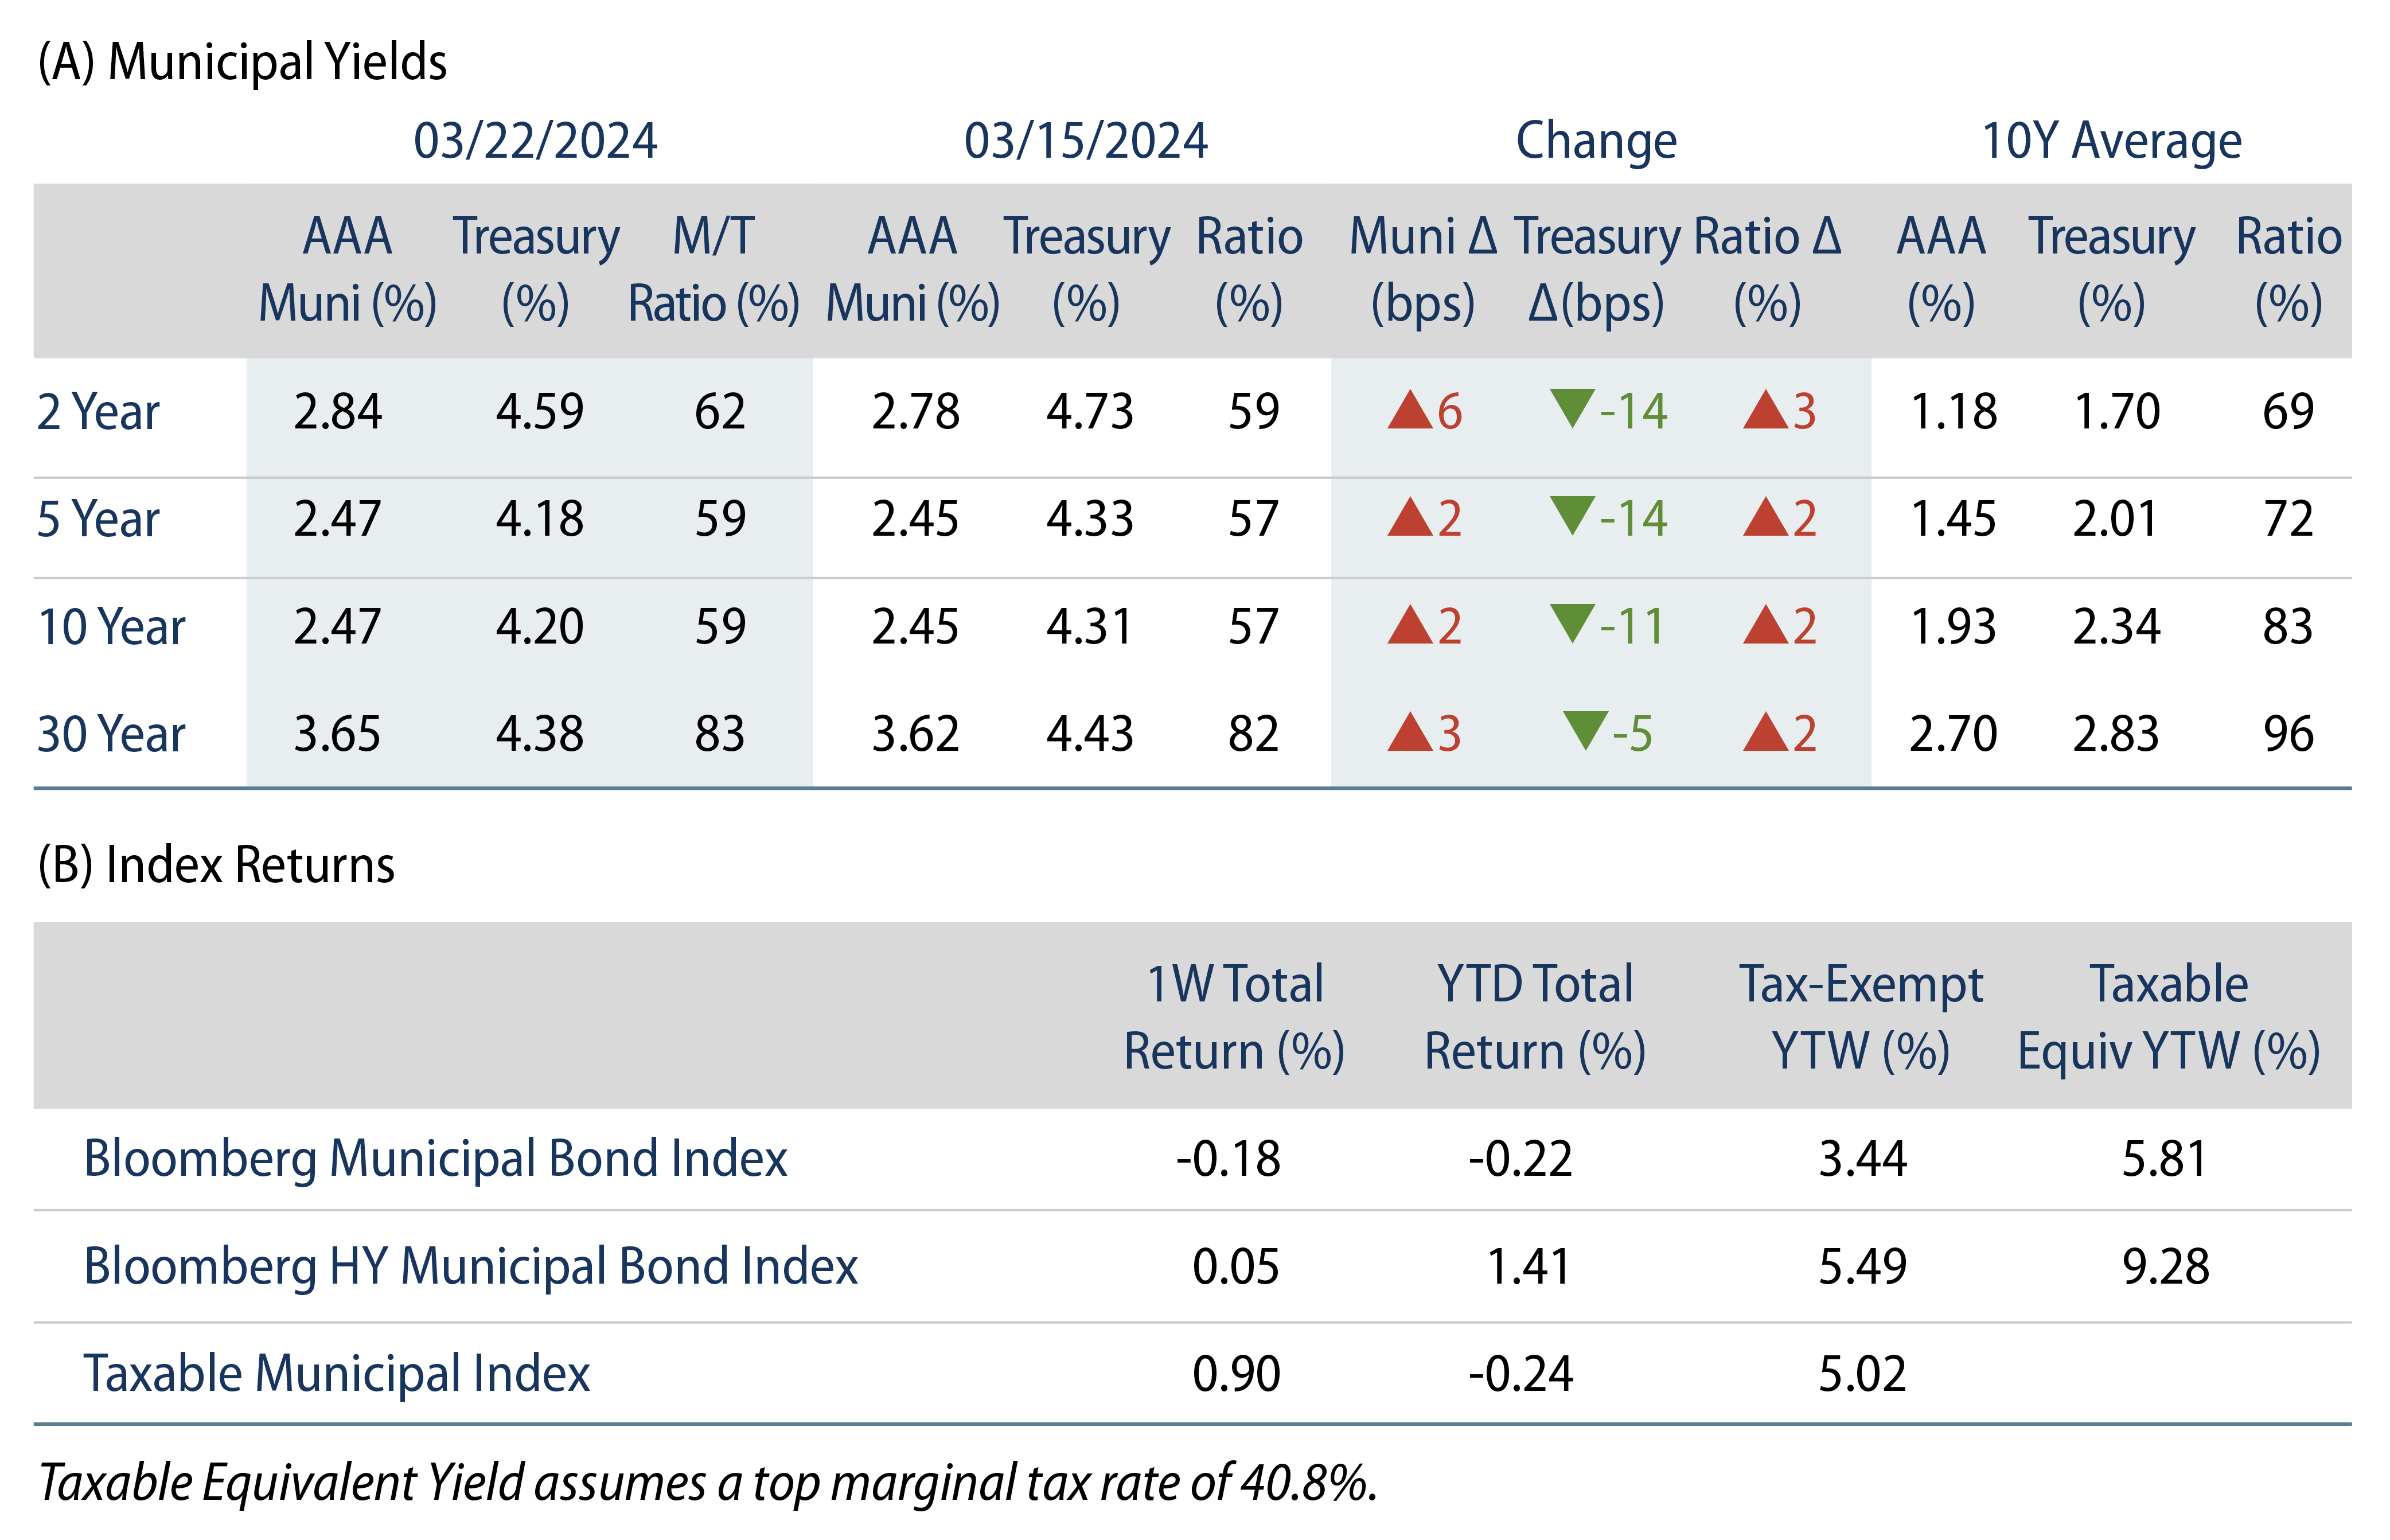
Munis posted negative returns last week and underperformed Treasuries, which moved lower during the week. High-grade muni yields moved higher across the yield curve and market technicals improved on muni fund inflows and lower supply. The Bloomberg Municipal Index returned -0.18% during the week, the High Yield Muni Index returned 0.05% and the Taxable Muni Index returned 0.90%. This week we highlight state and local revenue estimates released last week by the US Census Bureau.
Market Technicals Remained Supportive Amid Fund Inflows, Lower Supply
Fund Flows: During the week ending March 20, weekly reporting municipal mutual funds recorded $64 million of net inflows, according to Lipper. Long-term funds recorded $145 million of inflows, intermediate funds recorded $38 million of inflows and high-yield funds recorded $180 million of inflows. Short-term funds recorded $70 million of outflows. This week’s inflows lead estimated year-to-date (YTD) net inflows higher to $6.6 billion.
Supply: The muni market recorded $6 billion of new-issue volume last week, down 40% from the prior week. YTD issuance of $89 billion is 35% higher than last year’s level, with tax-exempt issuance 48% higher and taxable issuance 49% lower year-over-year (YoY). Tax-exempt issuance has comprised 95% of issuance YTD. This week’s calendar is expected to jump to $9.6 billion. The largest deals include $2.7 billion State of California General Obligation and $1.4 billion New York City General Obligation transactions.
This Week in Munis: State and Local Revenues Improve
Last week the Census released 4Q23 state and local revenue estimates, highlighting continued strength in overall state and local tax collections. Fourth quarter state and local government tax collections grew 5.2% from 4Q22 levels to $616 billion. Major state revenue tax components of individual income, corporate income and sales tax collections increased YoY by 8.0%, 13.9% and 1.7%, respectively. Property tax collections, the primary source of revenues for local governments, increased 4.7% YoY to $303 billion.
Calendar-year 2023 tax collections increased marginally (0.5%) from 2022 levels to $2.0 trillion. Property tax collections and sales tax collections increased during the year, growing 11% YoY and 2.2% YoY, respectively. The favorable growth in property and sales taxes was mostly offset by declines in individual income tax collections and corporate income tax collections of 13% and 2%, respectively, weighing on state revenues during the year.

The majority of states recorded revenue declines in 2023, and on average, estimated state revenues declined 4% during the year. In YoY terms, New Hampshire (+24%), Maryland (+7%) and Ohio (+7%) recorded the highest growth in estimated tax revenue, while Alaska (-50%), California (-17%) and Iowa (-13%) recorded the greatest revenue reductions.

Continued growth of state and local tax collections in 2023 highlights the resiliency of municipal credit, despite signs of a broader economic slowdown. The local government sector remains the largest sector of the municipal market, which continues to be supported by a strong real estate market and strong property tax collections. While state tax collections declined in 2023, fourth quarter data highlights that revenues are trending in a favorable direction. As certain states emerge from this budget season with potential shortfalls due to lower revenue collections, we anticipate robust cash balances collected throughout the pandemic recovery period will support muni credit over the medium term.
Municipal Credit Curves and Relative Value


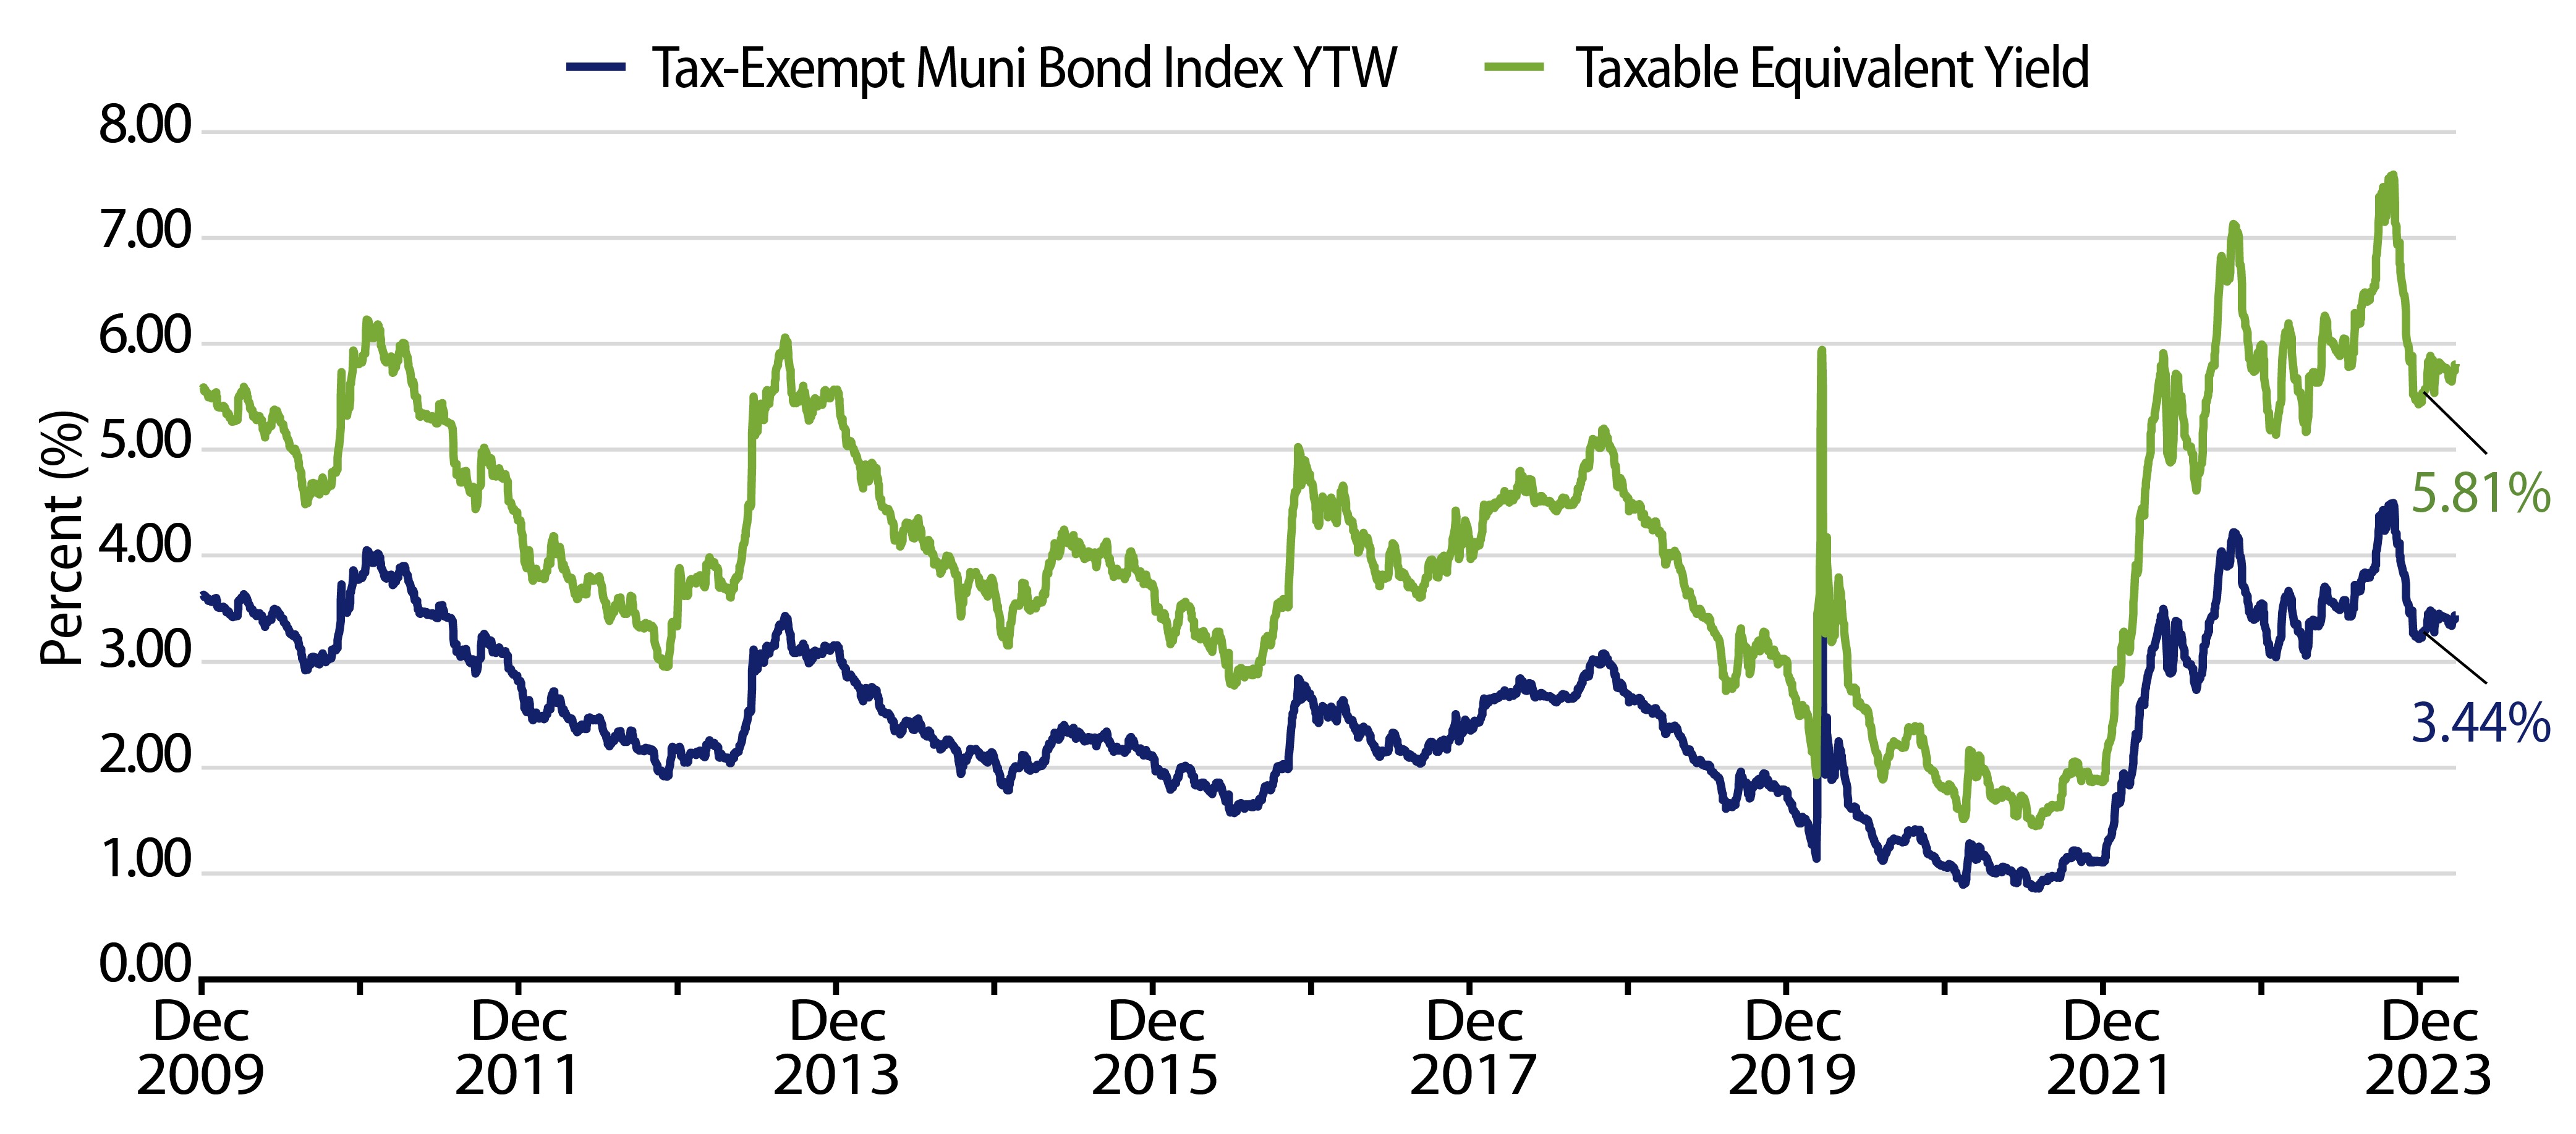
Theme #1: Municipal taxable-equivalent yields are above decade averages.
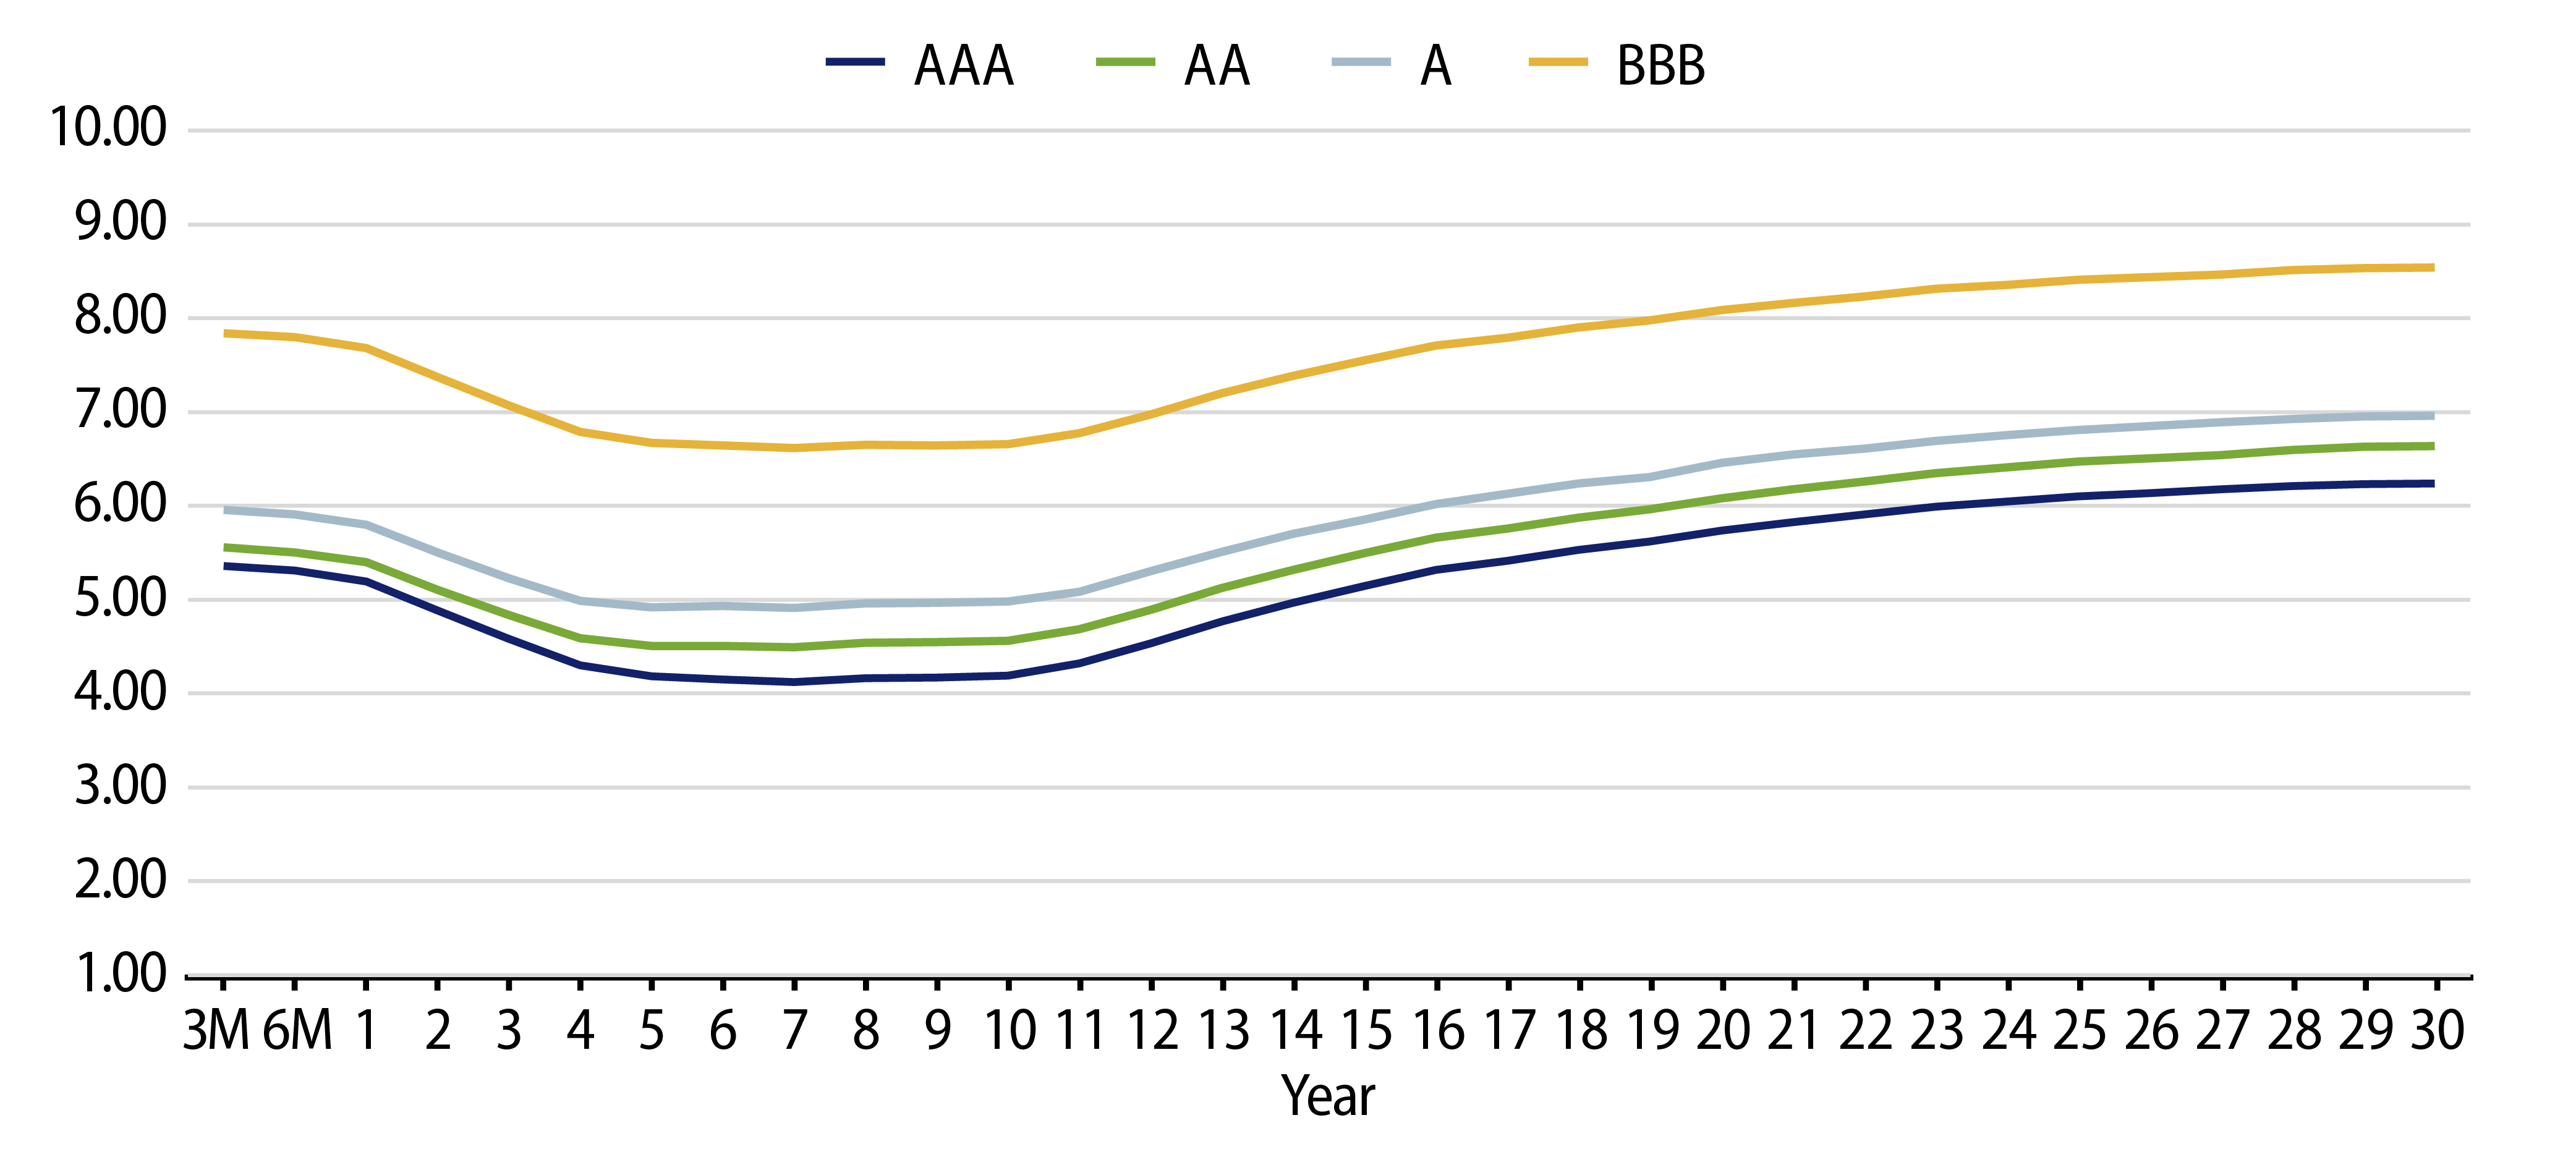
Theme #2: The inverted yield curve suggests less relative value in 5- and 10-year maturities.
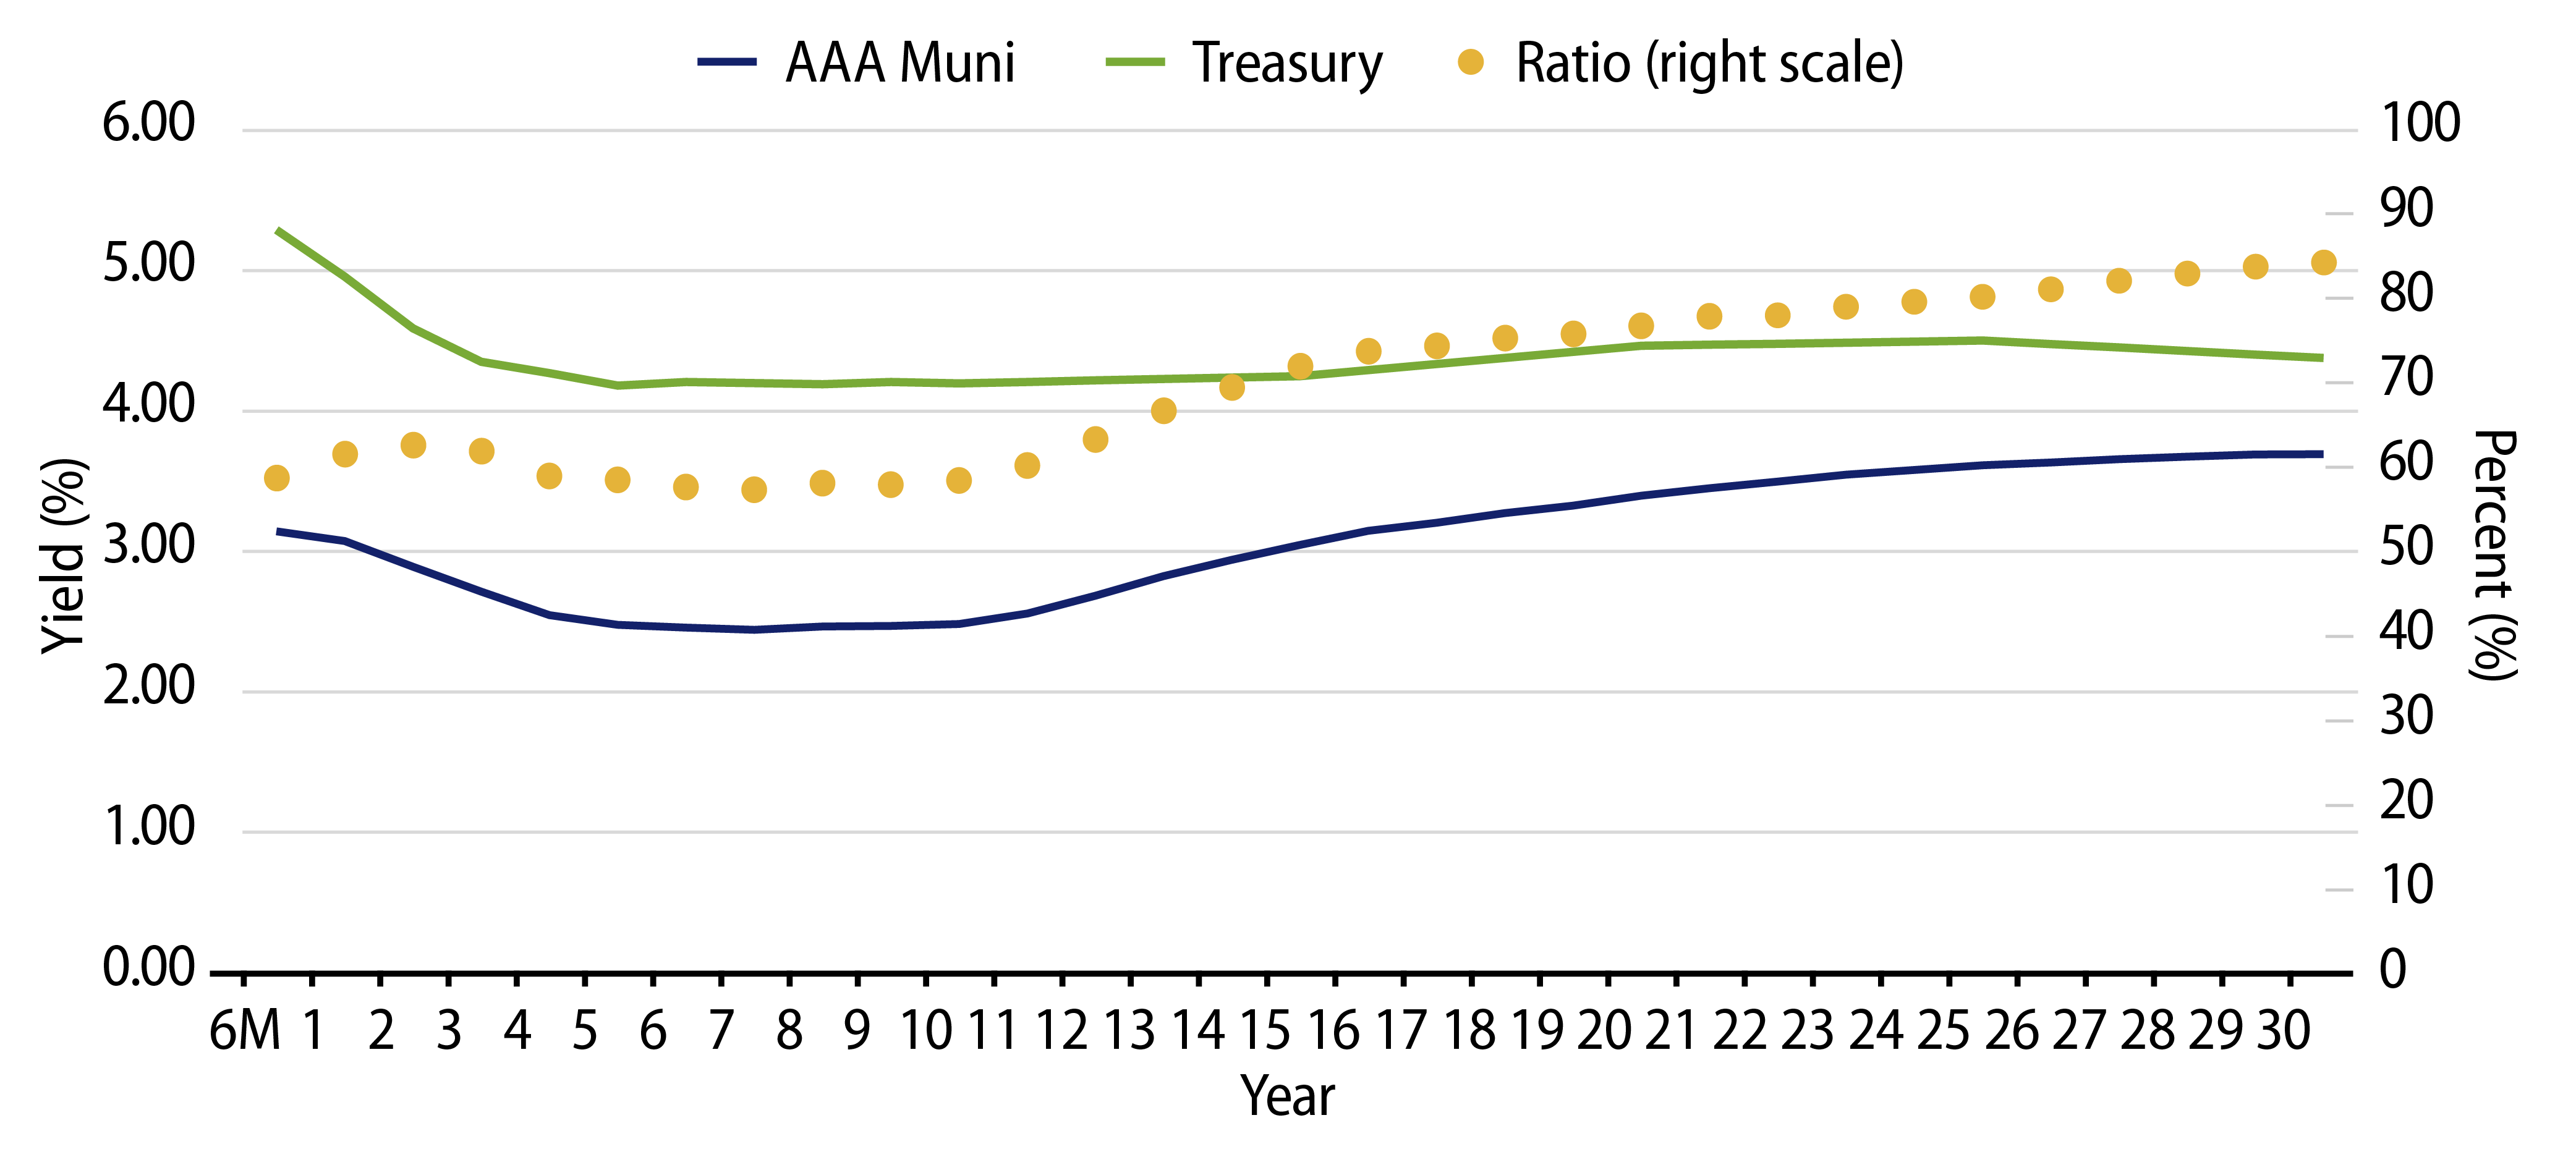
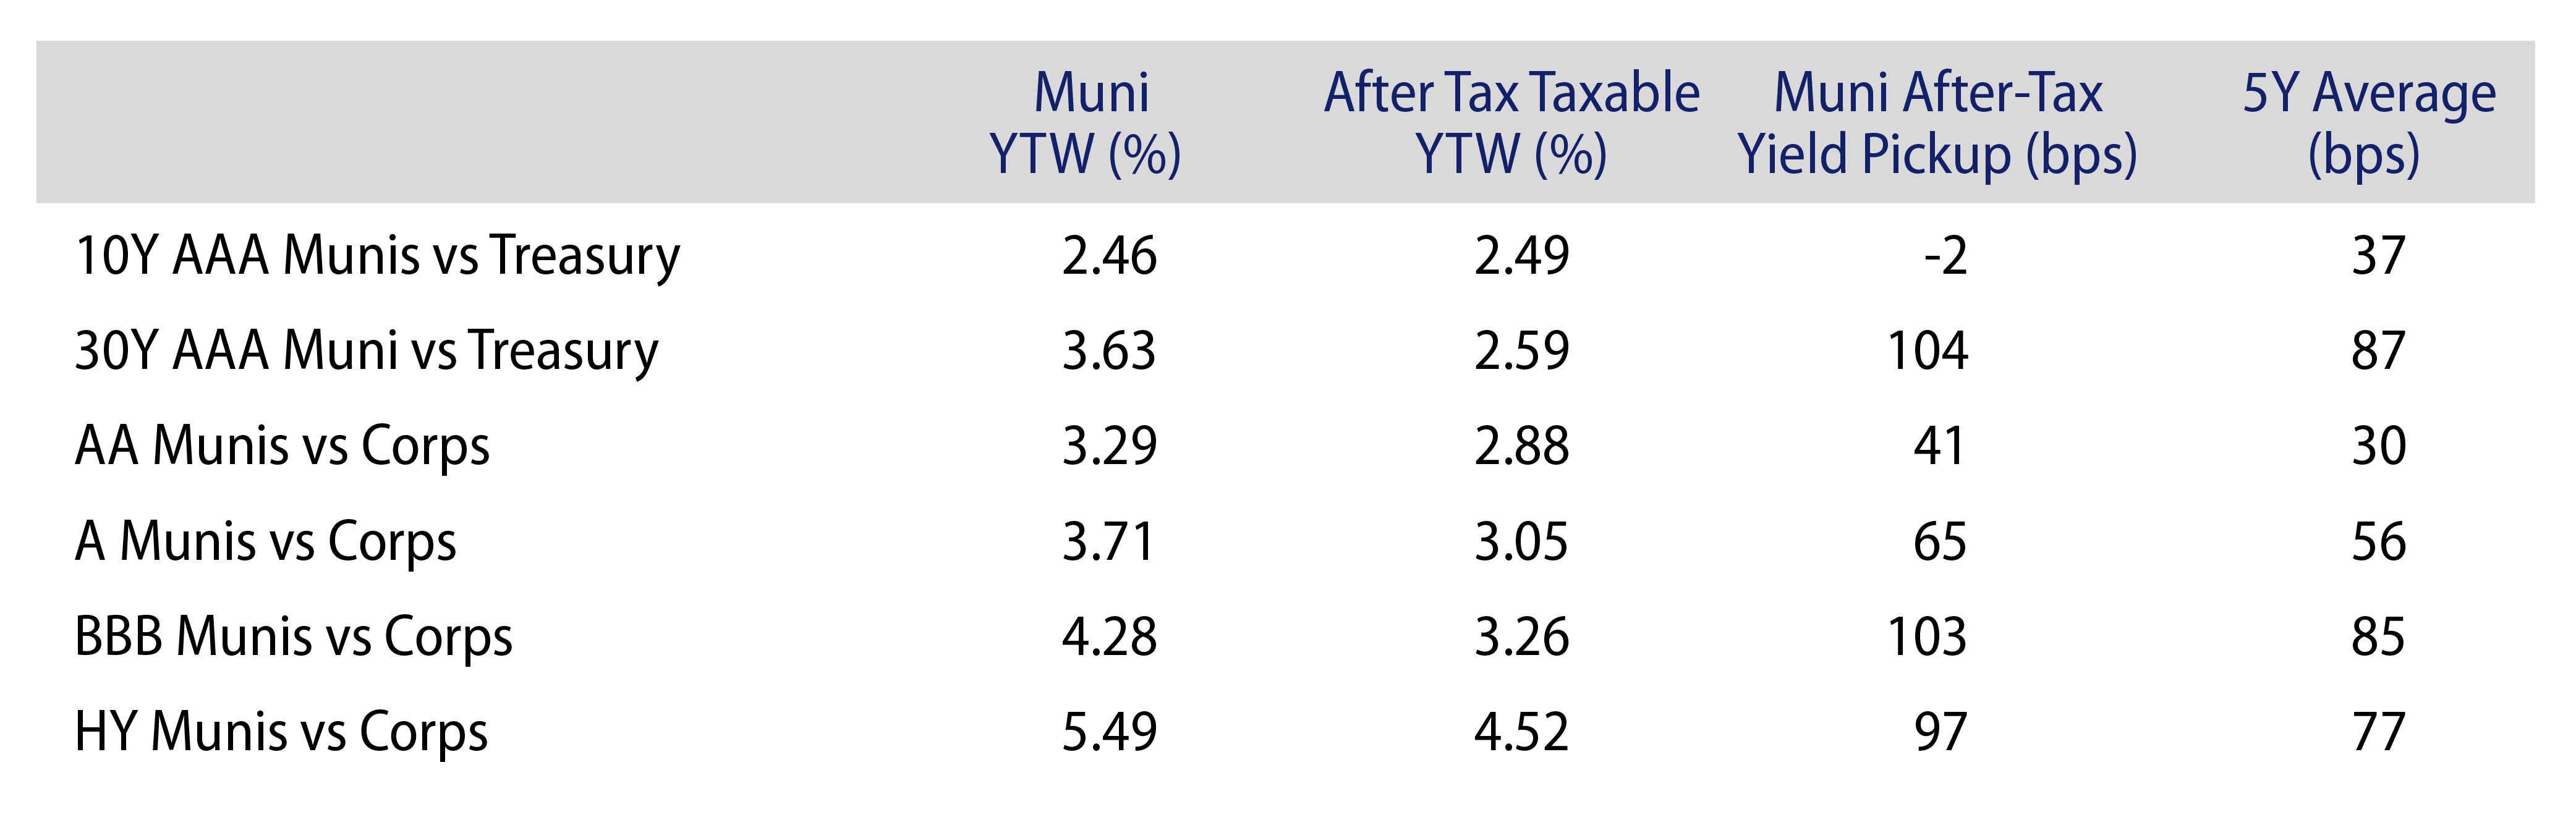
Theme #3: Munis offer attractive after-tax yield pickup versus long Treasuries and corporate credit.