skip navigation
Blog

Stay up to date on timely topics and market events. Subscribe to our Blog now.

MARKETS
01 February 2022

Weekly Municipal Monitor—End of a Record Demand Cycle

By Sam Weitzman

Stay up to date on timely topics and market events. Subscribe to our Blog now.

Municipal Weakness Accelerated Last Week

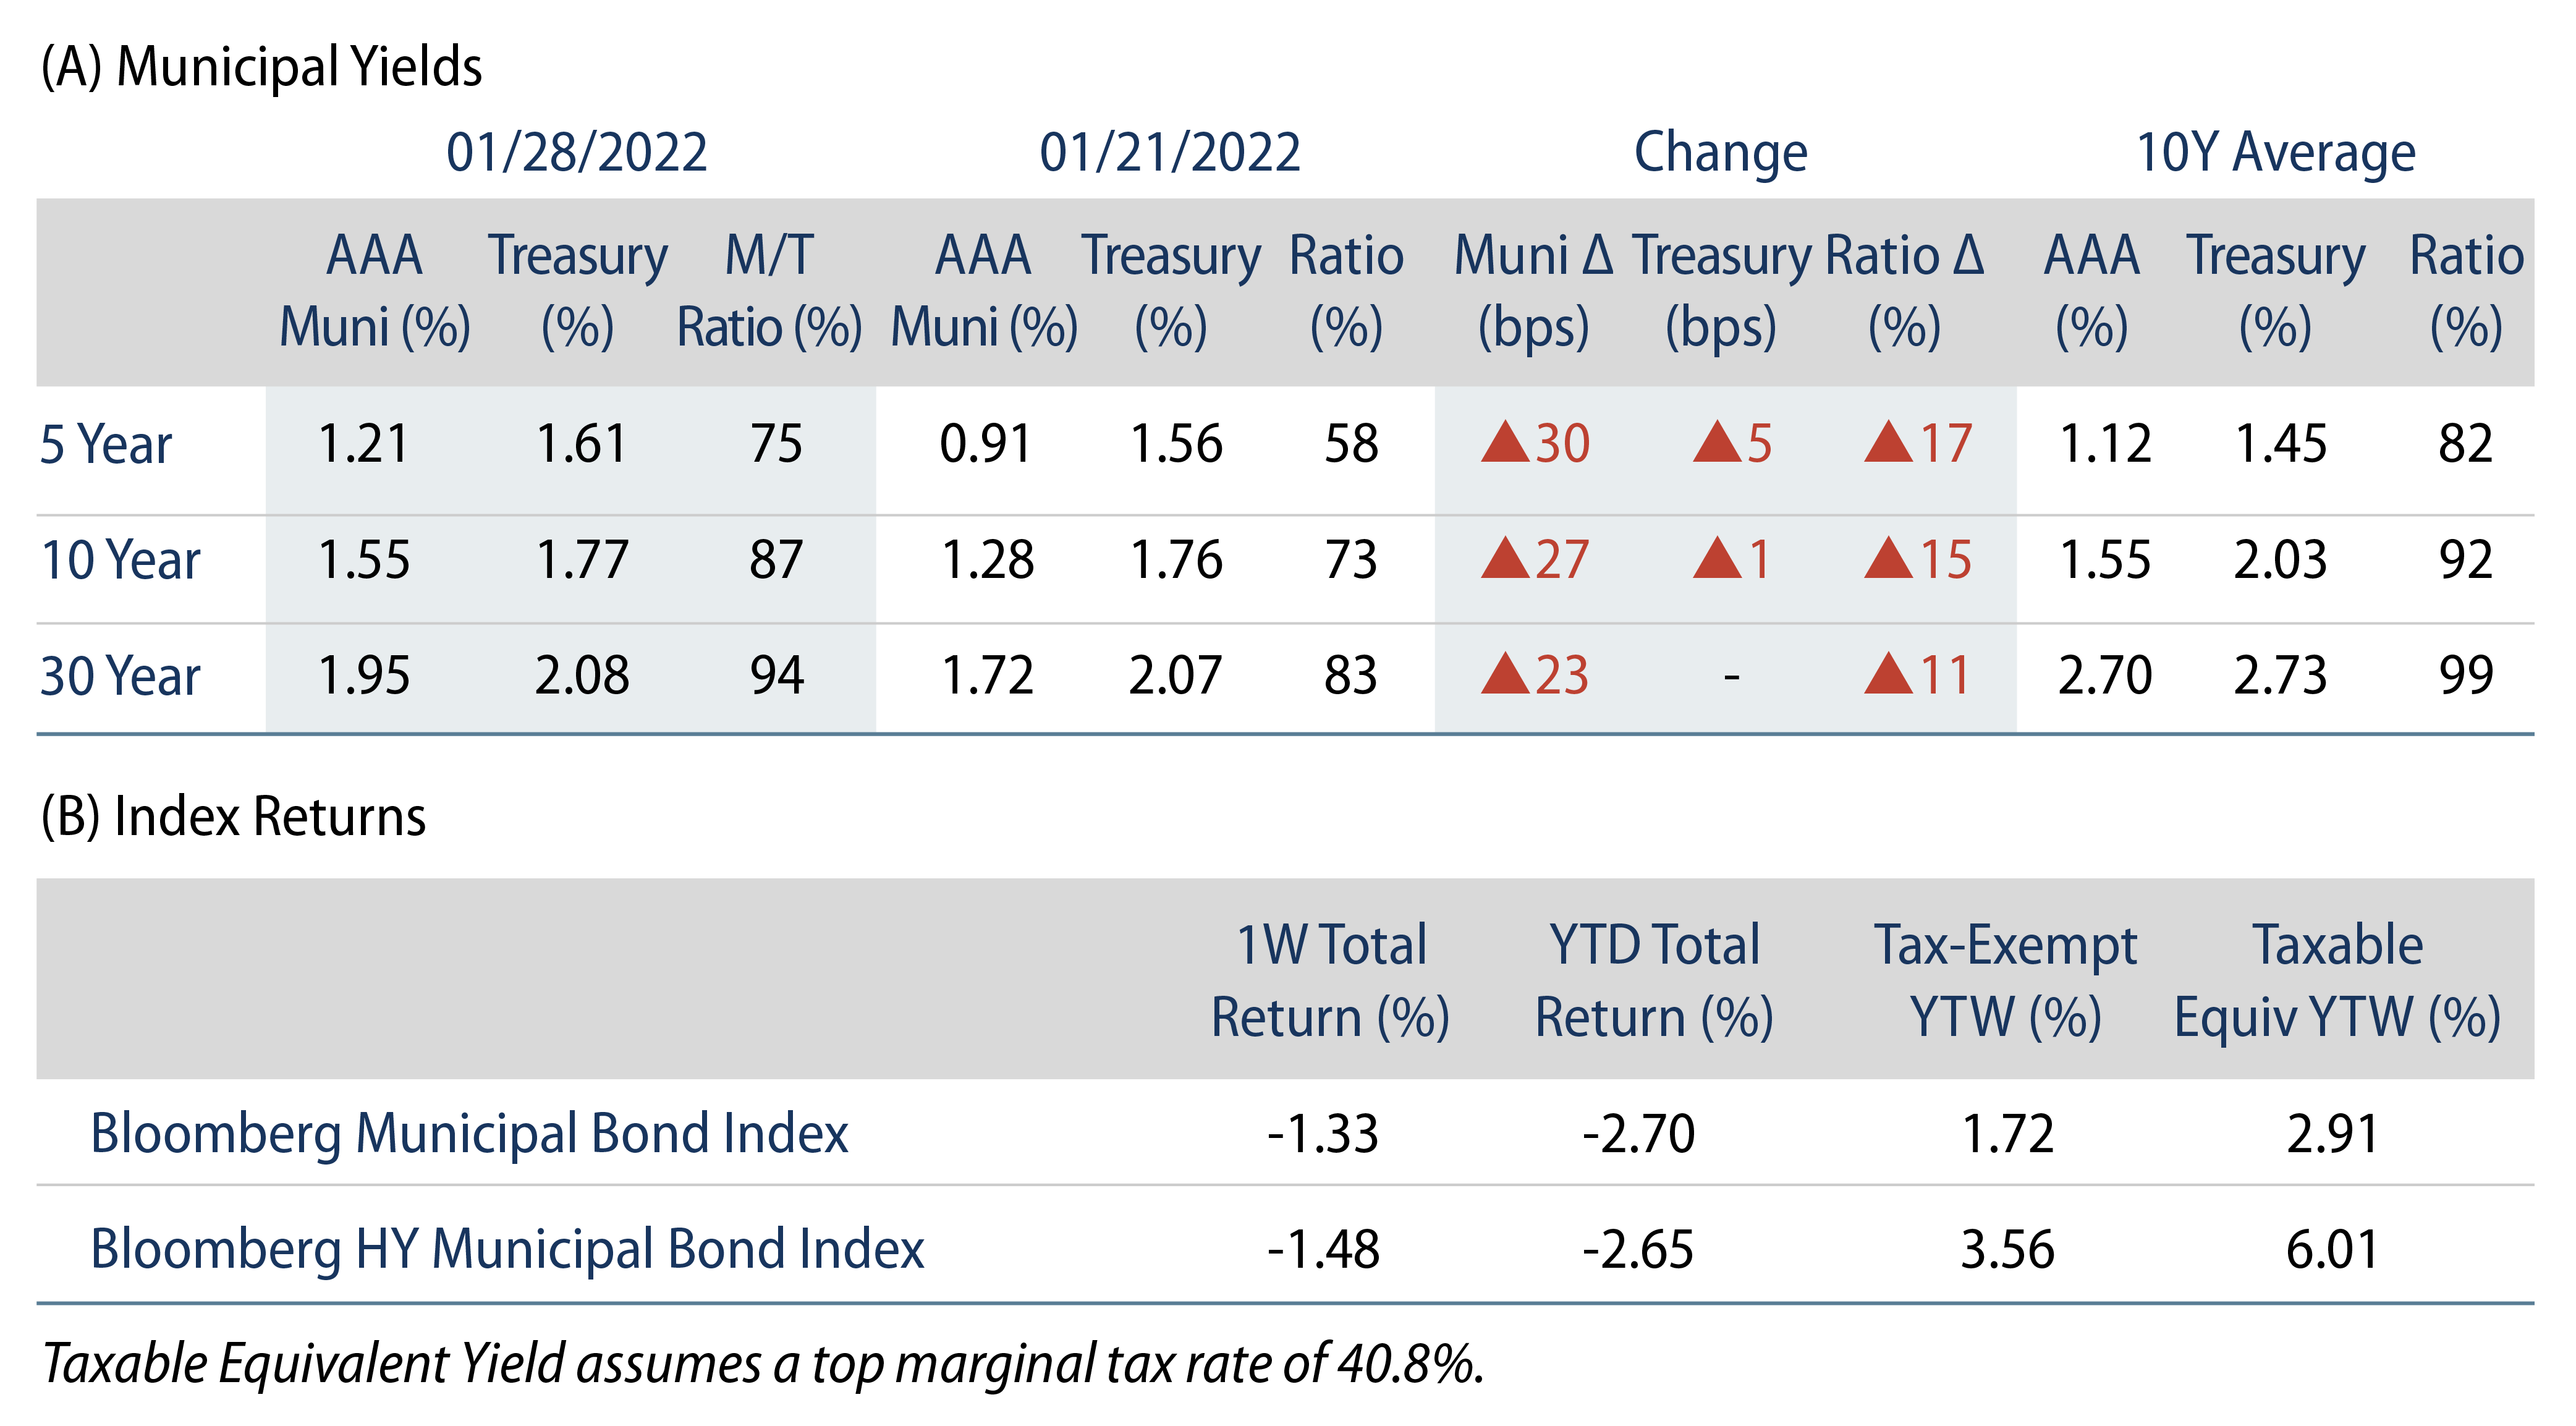
US municipals posted negative returns and underperformed Treasuries as Municipal/Treasury ratios reverted closer to longer-term averages. High-grade municipal yields moved 23-30 bps higher across the curve. Technicals softened as municipal outflows extended into a second week. The Bloomberg Municipal Index returned -1.33%, while the HY Muni Index returned -1.48%. This week we highlight implications of the end of a record inflow cycle observed from the spring of 2020.

Technicals Weaken as Fund Outflows Accelerate

Fund Flows: During the week ending January 26, municipal mutual funds recorded $1.4 billion of net outflows, according to Lipper. Long-term funds recorded $760 million of outflows, high-yield funds recorded $454 million of outflows and intermediate funds recorded $158 million of outflows. Municipal fund flows year to date (YTD) are now negative at $1.1 billion.

Supply: The muni market recorded $8 billion of new-issue volume last week, in line with the prior week. Total YTD issuance of $28 billion is 50% higher from last year’s levels, with tax-exempt issuance trending 84% higher year-over-year (YoY) and taxable issuance trending 21% lower YoY. This week’s new-issue calendar is expected to increase to $9 billion. Largest deals include $908 million Rayburn Country Securitization LLC and $651 million New York Triborough Bridge and Tunnel Authority transactions.

This Week in Munis—End of a Record Demand Cycle

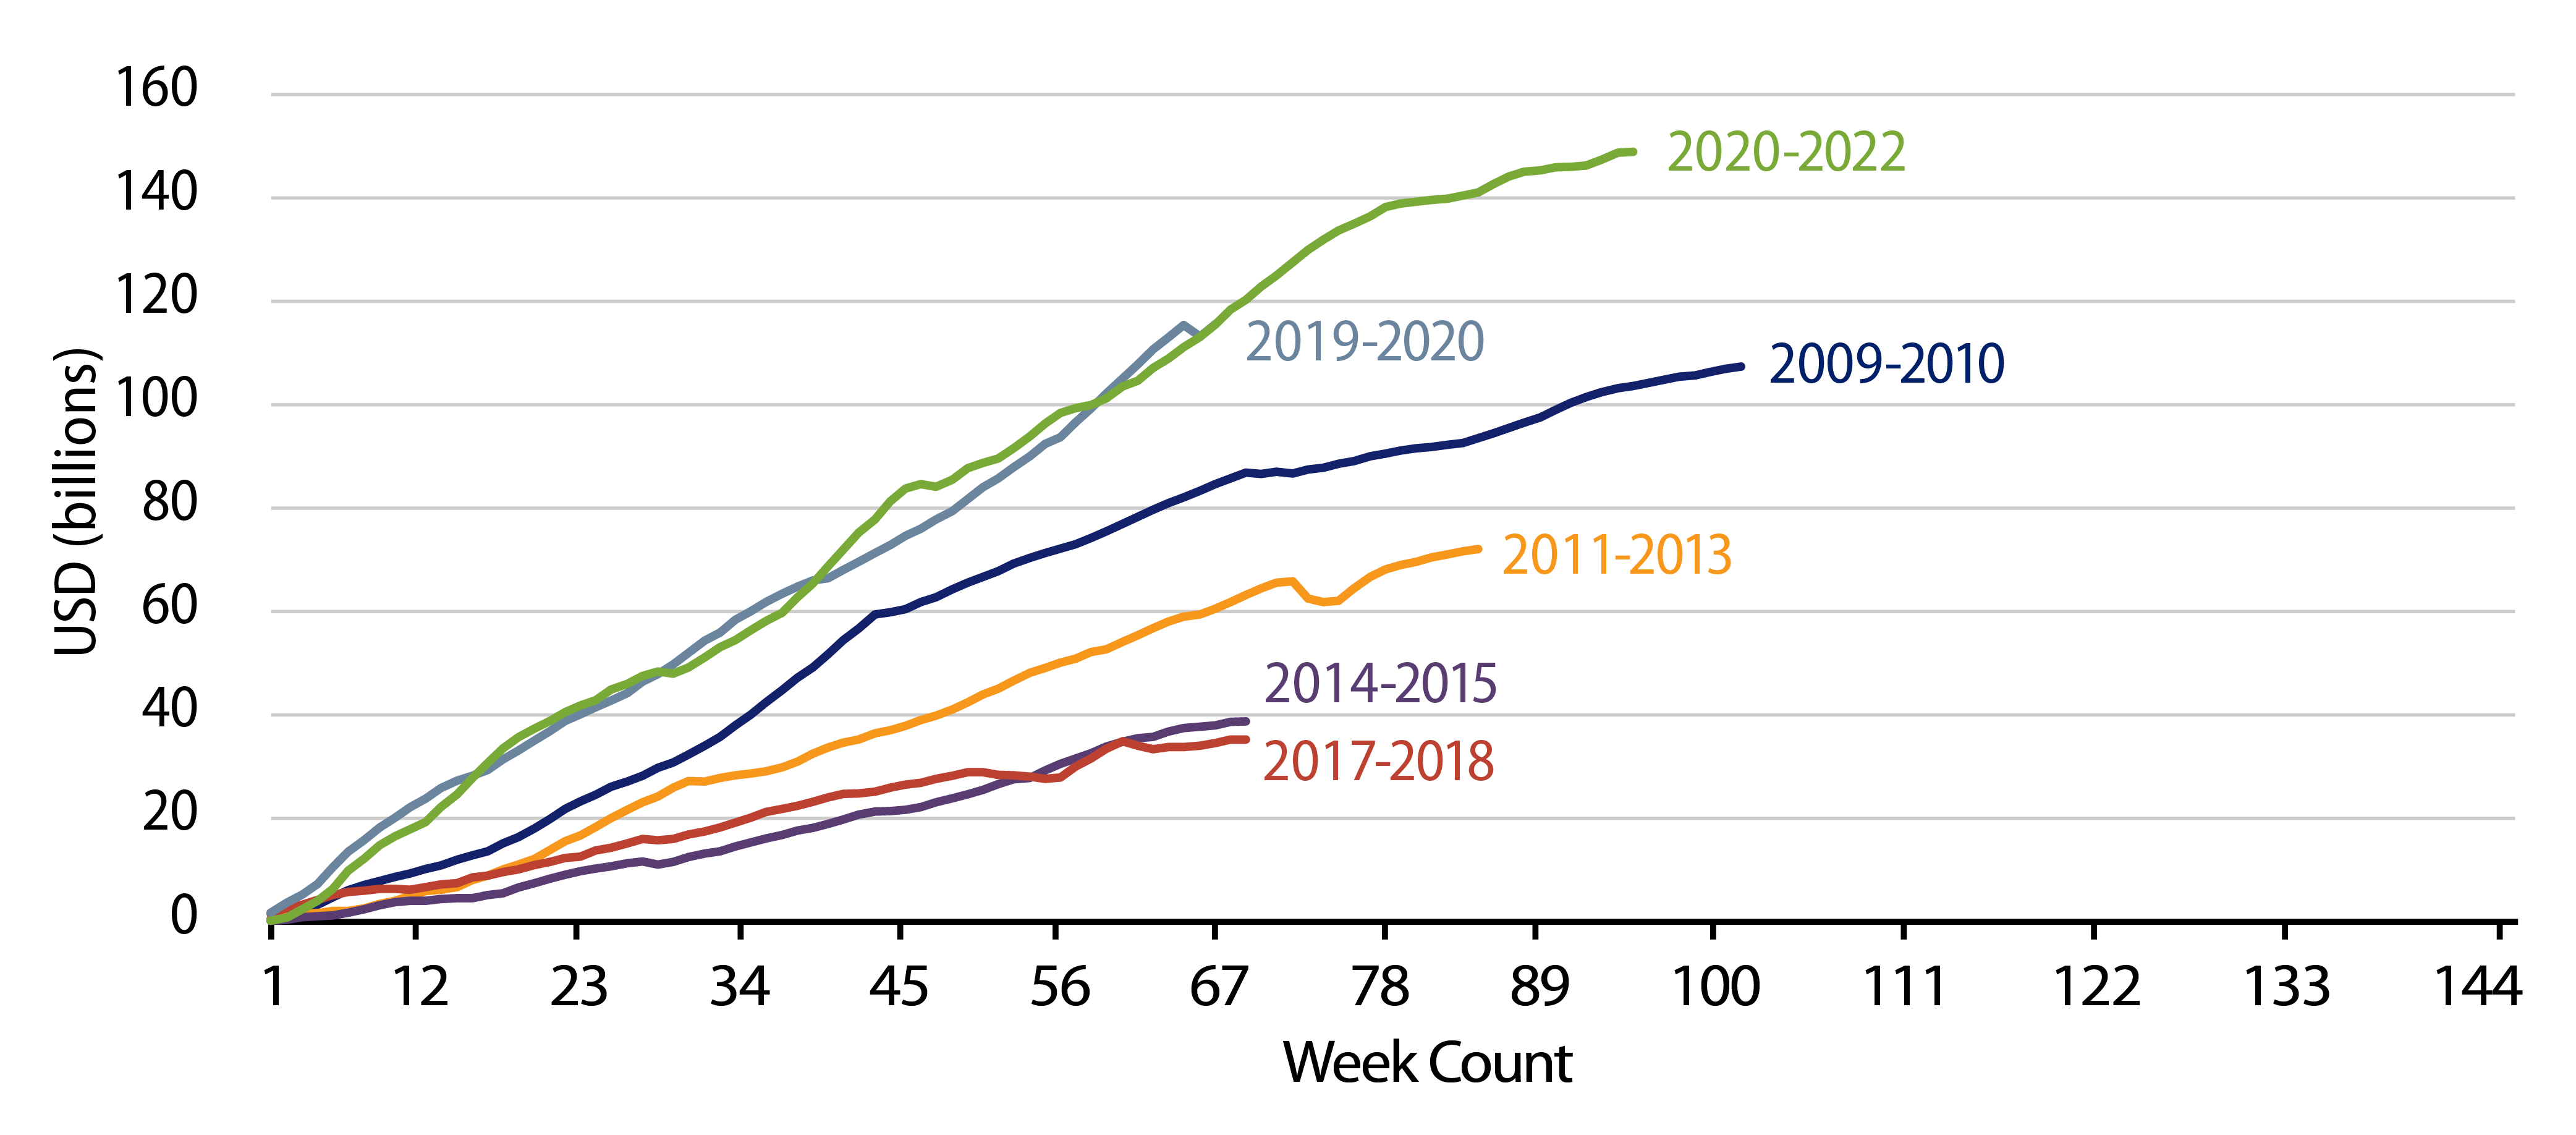
The municipal mutual fund outflows observed over the last two weeks ended a record positive demand cycle that was observed since the pandemic-driven drawdowns. According to ICI data, from April 29, 2020 to January 12, 2022 municipal mutual funds recorded 86 weeks of net inflows (over 88 weeks), totaling $149 billion. The municipal mutual fund demand well surpassed the prior record observed in 2019-2020, which spanned 60 consecutive weeks and totaled $115 billion. According to Lipper, the General and Insured Category collected the most assets over this period followed by high-yield municipal mutual funds.

Exhibit 1: Municipal Inflow Cycles Since 2017
Municipal Inflow Cycles Since 2017
Source: ICI, Bloomberg, Western Asset. As of 12 Jan 22. Select the image to expand the view.

Notably, the robust demand for munis persisted during a period of elevated interest-rate volatility that challenged most other fixed-income asset class returns in 2021. A combination of improved fundamentals that alleviated pandemic-driven credit concerns, along with expectations of higher tax rates, increased the relative value proposition and attracted investors to the asset class. Entering 2022, this relative value proposition was simply less attractive as spreads narrowed to post-global financial crisis (GFC) lows. Considering the starting point of relatively rich valuations, municipal demand quickly softened amid the most recent bout of inflation-driven market volatility as weekly reporting municipal mutual funds recorded approximately $2 billion of net outflows over the past two weeks, according to Lipper.

Over the last decade, the municipal market has become increasingly sensitive to mutual fund demand, considering mutual fund assets have comprised a greater share of market activity. From September 2008 to September 2021, assets under management (AUM) for muni mutual funds increased over 2.5x to $1.1 trillion. Brokers and dealers, who have historically served as primary intermediaries of market volatility prior to the GFC, reduced municipal inventories by over 80% to $12 billion during this period. Other market intermediaries such as banks and insurance companies have also stepped away from the tax-exempt market more recently as corporate tax rates declined from 35% to 21% in 2017. As a result of this market evolution, liquidity seekers often outnumber liquidity providers in times of volatility, which could quickly present opportunities as tax-exempt yields can move significantly higher (as they have this week) when fund demand declines. Western Asset believes that active management of liquidity is essential in navigating these market dynamics to achieve our objectives of providing long-term risk-adjusted returns for our clients.

Exhibit 2: Municipal Fund AUM vs. Broker/Dealer Inventories
Municipal Fund AUM vs. Broker/Dealer Inventories
Source: Federal Reserve. As of 30 Sep 21. Select the image to expand the view.
Exhibit 3: Municipal Bond Yields and Index Return
Municipal Bond Yields and Index Return
Source: Bloomberg. As of 28 Jan 22. Select the image to expand the view.
Exhibit 4: Tax-Exempt Muni Valuations
Tax-Exempt Muni Valuations
Source: Bloomberg. As of 28 Jan 22. Select the image to expand the view.
© Western Asset Management Company, LLC 2024. The information contained in these materials ("the materials") is intended for the exclusive use of the designated recipient ("the recipient"). This information is proprietary and confidential and may contain commercially sensitive information, and may not be copied, reproduced or republished, in whole or in part, without the prior written consent of Western Asset Management Company ("Western Asset").
Past performance does not predict future returns. These materials should not be deemed to be a prediction or projection of future performance. These materials are intended for investment professionals including professional clients, eligible counterparties, and qualified investors only.
These materials have been produced for illustrative and informational purposes only. These materials contain Western Asset's opinions and beliefs as of the date designated on the materials; these views are subject to change and may not reflect real-time market developments and investment views.
Third party data may be used throughout the materials, and this data is believed to be accurate to the best of Western Asset's knowledge at the time of publication, but cannot be guaranteed. These materials may also contain strategy or product awards or rankings from independent third parties or industry publications which are based on unbiased quantitative and/or qualitative information determined independently by each third party or publication. In some cases, Western Asset may subscribe to these third party's standard industry services or publications. These standard subscriptions and services are available to all asset managers and do not influence rankings or awards in any way.
Investment strategies or products discussed herein may involve a high degree of risk, including the loss of some or all capital. Investments in any products or strategies described in these materials may be volatile, and investors should have the financial ability and willingness to accept such risks.
Unless otherwise noted, investment performance contained in these materials is reflective of a strategy composite. All other strategy data and information included in these materials reflects a representative portfolio which is an account in the composite that Western Asset believes most closely reflects the current portfolio management style of the strategy. Performance is not a consideration in the selection of the representative portfolio. The characteristics of the representative portfolio shown may differ from other accounts in the composite. Information regarding the representative portfolio and the other accounts in the composite are available upon request. Statements in these materials should not be considered investment advice. References, either general or specific, to securities and/or issuers in the materials are for illustrative purposes only and are not intended to be, and should not be interpreted as, recommendation to purchase or sell such securities. Employees and/or clients of Western Asset may have a position in the securities or issuers mentioned.
These materials are not intended to provide, and should not be relied on for, accounting, legal, tax, investment or other advice. The recipient should consult its own counsel, accountant, investment, tax, and any other advisers for this advice, including economic risks and merits, related to making an investment with Western Asset. The recipient is responsible for observing the applicable laws and regulations of their country of residence.
Founded in 1971, Western Asset Management Company is a global fixed-income investment manager with offices in Pasadena, New York, London, Singapore, Tokyo, Melbourne, São Paulo, Hong Kong, and Zürich. Western Asset is a wholly owned subsidiary of Franklin Resources, Inc. but operates autonomously. Western Asset is comprised of six legal entities across the globe, each with distinct regional registrations: Western Asset Management Company, LLC, a registered Investment Adviser with the Securities and Exchange Commission; Western Asset Management Company Distribuidora de Títulos e Valores Mobiliários Limitada is authorized and regulated by Comissão de Valores Mobiliários and Brazilian Central Bank; Western Asset Management Company Pty Ltd ABN 41 117 767 923 is the holder of the Australian Financial Services License 303160; Western Asset Management Company Pte. Ltd. Co. Reg. No. 200007692R is a holder of a Capital Markets Services License for fund management and regulated by the Monetary Authority of Singapore; Western Asset Management Company Ltd, a registered Financial Instruments Business Operator and regulated by the Financial Services Agency of Japan; and Western Asset Management Company Limited is authorised and regulated by the Financial Conduct Authority ("FCA") (FRN 145930). This communication is intended for distribution to Professional Clients only if deemed to be a financial promotion in the UK as defined by the FCA. This communication may also be intended for certain EEA countries where Western Asset has been granted permission to do so. For the current list of the approved EEA countries please contact Western Asset at +44 (0)20 7422 3000.