

Headline retail sales jumped 1.7% in March, with a +0.2% revision to the February sales estimate, according to data released today by the Census Bureau. We and most other analysts focus more closely on a “control” sales measure that excludes sales at car dealers, service stations, building material stores and restaurants, partly because those excluded sectors include substantial purchases by other businesses and partly because of their short-term volatility. The control sales measure rose a brisk 0.7% in March on top of a +0.4% revision to the February estimate.
The much larger increase in the headline sales measure reflects a 15.4% increase in service station sales, thanks to higher gas prices due to the Iran conflict. That is yet another justification for the focus on control sales, which abstracts from such wild swings.
The March gains in control sales mark the third straight month of healthy gains following a lull in sales in December. That December softness, in turn, followed strong sales gains in the fall after a softish summer. Needless to say, retail activity has been choppy even when the more volatile retail sectors are excluded.
Another complication underlying the sales data is a bump in goods prices within consumer spending data from the Bureau of Economic Analysis (Commerce Dept.), which has not been reflected in Consumer Price Index (CPI) data, from the Bureau of Labor Statistics (Labor Dept.). Historically, Commerce and Labor data on goods prices have closely adhered. Since December 2025, the two price indices show radically different behavior, with Labor Dept. goods prices steady, rising about 0.1% per month, while Commerce Dept. data have shown sharply accelerating increases, averaging over 0.5% per month.
Meanwhile, retail sales data from the Census Bureau (also Commerce Dept.) provide another perspective on consumer activity. The real sales measure shown in Exhibit 1 uses retail prices. Commerce ceased publishing that data two years ago thanks to budget cuts. Since then, we have extrapolated retail prices forward using the price data from Labor and Commerce, and the recent disparity between those datasets has presented a problem.
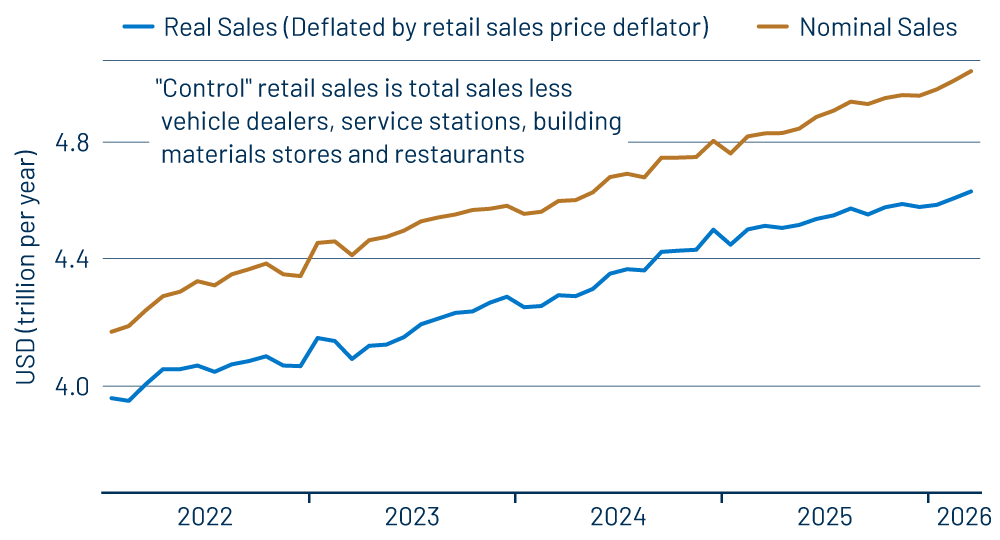
Our estimates continue to use Labor Dept. pricing, and on that score, they show stronger real sales growth than would be the case if Commerce Dept. pricing were utilized. If that makes the current state of real retail spending as clear as mud to you, we’re sorry, but that is the best we can do.
It is clear from Exhibit 1 that nominal sales have been proceeding nicely, right on trend. If real sales have faltered, that is because of higher prices, not any weakening of consumer demand. And as we have remarked in past posts, it will be interesting to see if merchants pull back on pricing in coming months, given that consumers have not increased spending in response to higher prices.
Note that we don’t know yet how Commerce will estimate goods prices for March. Labor Dept. data suggest a 0.2% increase in “control” sales prices, which would result in a healthy 0.5% increase in real sales. That and the substantial (again, +0.4%) revisions to January and February sales indicate a better outcome for 1Q consumer spending on merchandise than previously appeared to be the case. This boosts our 1Q GDP growth estimate by about +0.4%, to 2.4%.
Consumer demand is holding up reasonably well, and the strong recent gains in business capital spending are combining with this to drive healthy gains in factory sector activity. This is being tempered by ongoing softness in construction activity and an apparent 1Q slowing in service-sector growth. Obviously, there are a lot of cross-currents in the US economy presently.