


KEY TAKEAWAYS
- Achieving a balance between transition and physical risks requires a comprehensive cost-benefit analysis.
- The creditworthiness of corporate bond issuers might be impacted as business operation losses resulting from climate-related disruptions become more frequent and/or intense.
- We assess the vulnerability of a company to physical risks, including revenue losses and physical asset losses.
- We estimate losses from weather-related events to corporate bond portfolios using scenario analysis.
Introduction
Investors are confronted with growing complexity when it comes to understanding the impact of the physical risks attributed to climate change, and of estimating the potential risks to corporate bonds when making investment decisions, particularly when considering long-term investment strategies. Asset owners have also sought greater clarity about the impact of the aforementioned physical risks on their corporate bond portfolios. In response, Western Asset presents our approach to modeling and estimating physical risks of climate change in this paper, with the aim of providing information and insights to clients interested in managing climate-risk-aware portfolios.
Key institutions such as the Federal Reserve1, European Central Bank2, Bank of England3, Reserve Bank of Australia4, Bank of Canada5, Banco Central do Brasil6, among others, have recognized the risks posed by the physical effects of climate change. Such physical risks of climate change, both acute and chronic, include extreme weather events such as droughts, floods, cyclones, hurricanes, wildfires and changes in rainfall or weather patterns that would have an impact on corporations in terms of potential damage to their asset bases, revenue sources and/or supply chains.
In the context of financial risk management, investors are always tasked with seeking to make decisions based on the available information at any given time. Should the projected losses implied by the physical risks of climate change come to be, then portfolios may need to be rebalanced either to mitigate the risks stemming from climate change or to align with clients’ specific sustainability goals and objectives. In such circumstances, when portfolios are rebalanced to align with sustainability targets, it is important to establish a decision framework that can assess the impact of climate risks on investment portfolios.
If the assertions made by certain scientists hold true, business operation losses resulting from climate-related disruptions will become more frequent and/or intense; the physical risks associated with climate change can not only affect a corporation's revenue stream, such as the loss of a crop in a particular year, but can also inflict damage upon the physical assets that underpin future revenue generation. As a result, corporations may face significant and myriad future consequences.
It is also important to recognize that the actions of a single country or even a single company are unlikely to significantly impact future climate-related events. Therefore, finding effective ways to impose increasing carbon taxes on emissions collectively—not just one country or company at a time or in isolation—is necessary. The actual implementation of such measures, however, could potentially lead to lower profitability and even survival challenges for many corporations worldwide.
In this study, Western Asset seeks to evaluate the potential consequences for corporate bond portfolios when considering physical risks associated with climate change. When conducting the assessment, we noted the lack of robust historical data, which therefore results in an inability to rely on statistical-based metrics to assess climate-related financial risks. Consequently, we employed scenario analysis, which enables us to examine the potential effects of physical risks at the level of individual corporate issuers, as well as at the aggregated levels of portfolios.
Not All Climate Risks Are the Same
Within our framework, we conceptualize climate-related financial risks as stemming from two distinct sources: transition risks, which affect corporations through emissions-based taxes (please refer to our previous research on the topic7,8), and physical risks, which arise from climate-related events and also impact the revenues and assets of corporate issuers. We have highlighted the positive correlation between transition risks and carbon prices in prior research. We also assume that rising temperatures might lead to higher frequency and/or higher intensity of climate disasters, hence we assume a negative relationship between corporate emissions and physical risks. As a result, these two risk categories may partially offset each other on a macro level.
Risks arise from the necessity of emitting or buying inputs from emitting sources as part of business operations. In our previous analysis, we consolidate these facets of transition risks into the broader concept of increasing carbon prices. The magnitude of carbon price increases is contingent upon temperature rise targets set for end-of-century scenarios. As the target becomes more ambitious, carbon prices will need to be higher to incentivize emissions reductions and the adoption of cleaner technologies.
Physical risks can be classified into two different categories:
- Acute risks, those that are one-offs and event driven (e.g., related to increased frequency and severity of floods, droughts, hurricanes, cyclones and other natural disasters), and
- Chronic risks, those that are related to long-term shifts in climate patterns such as rising sea levels, labour migration and other geopolitical aspects associated with rising temperatures in certain regions.
Chronic climate issues have to some extent been around for quite some time, impacting corporations and populations across the globe when they arise. Physical impacts from temperature rises can either improve or damage economic activity, depending upon the geographic regions. For example, Canada or Russia could see benefits from temperature rises, with improved conditions for humans to work, live and grow crops in certain areas. On the other hand, temperature rises could have devastating effects around the tropics. Climate change could have impacts on people, migration patterns, physical and natural capital, and ultimately on economic activity and society well-being. Such impacts may have implications for companies in terms of both revenues and physical assets. We note that the socioeconomic and geopolitical costs of climate change and its effect on physical risks are being addressed9 and are being researched by many parties, but our analysis does not incorporate this dimension of extant research.
Data and Model
Costs resulting from the physical effects of climate change depend on factors such as the intensity of climate-related events in the regions where a corporate issuer operates, the issuer's specific exposure to those regions, the nature of its operations and the prevailing carbon price trajectory over time. As the severity and probability of climate-related events rise, both the physical assets and revenues of companies are increasingly susceptible to adverse impacts.
In our analysis, we assess the vulnerability of a company to two distinct aspects: revenue losses and physical asset losses. The costs associated with climate event-driven disruptions have direct implications for a company’s valuation, influencing bond credit spreads and estimated default probabilities.
The analysis in this study spans a timeframe from the present to the year 2050. To establish the temperature pathways, we again refer to the Intergovernmental Panel on Climate Change (IPCC)10 study. Our model postulates a linear expected damage function to evaluate the potential physical risks that issuers may face in the future across different carbon price and temperature anomaly scenarios.
For any particular issuer k, we define a monetary expected damage function to its physical assets and future revenues as follows:
The Vulnerability to Losses and the Income Group Where a Company Operates Matters
Corporate issuers often have operations in diverse regions around the world, and their vulnerability to extreme weather-related events can be influenced by several factors. These factors include the specific geographic locations where they operate and the level of infrastructure resilience in those areas. To assess the vulnerability of countries to acute physical risks resulting from climate events, we utilize the Global Climate Risk Index (CRI) provided by German Watch11 as an indicator.
The CRI focuses on both exposure and vulnerability to extreme events but does not encompass chronic change or impacts. It considers direct impacts of extreme weather events, including losses and fatalities, which contribute to the final score of the index. The indicators used to calculate the CRI score include the number of deaths, deaths per 100,000 inhabitants, sum of losses in US dollars adjusted for purchasing power parity (PPP), and losses as a percentage of gross domestic product (GDP). The score for each country is derived from its weighted average ranking across these four categories.
According to a study conducted by the United Nations Office for Disaster Risk Reduction (UNDRR, formerly UNISDR)12, average economic losses as a percentage of GDP for the period 1998 to 2017 were estimated based on World Bank Income13 groups. The study reveals a clear trend: as income levels decrease, the percentage of losses relative to GDP increases. This finding confirms that lower-income countries bear a heavier economic burden from such disasters. Exhibit 1 presents the estimates provided by UNDRR, illustrating the relationship between income levels and the proportion of losses incurred in relation to GDP.

For each country within one of the three income groups, we apply an adjustment to the UNDRR-estimated losses as a percentage of GDP to account for their vulnerability to acute physical risks. This adjustment involves assigning a weight to each country's contribution to the loss per GDP based on its corresponding CRI score.
To illustrate this with an example, consider the Philippines, which falls within the lower-middle-income group. According to the UNDRR study, for the period covered in their analysis, the average losses per GDP for the country are estimated at 1.14% of GDP per year. Given that the Philippines is highly vulnerable to natural disasters, however (reflected by its low CRI score of 18), we adjust the average losses per GDP over the studied period to 2% per year.
This adjustment process allows us to capture the varying degrees of vulnerability to climate-related risks among different countries and to refine the estimation of losses per GDP to better reflect their actual exposure to acute physical risks.
Estimating a Country's Physical Capital Exposed to Potential Losses
As part of a research initiative aimed at analyzing the drivers of growth in countries and the effects of a shifting economic landscape, The World Bank compiled and aggregated data on physical capital formation for 92 countries, both developed and developing, with the estimation of initial capital stock spanning the period from 1960 to 1990.
The estimated monetary value of economic loss from extreme climate-related events for a country (or region) "i", adjusted for the country's region and income group, in year "t" is defined as:
The calculation of the estimated loss from extreme climate-related events per unit of physical capital for each country at year "t" involves dividing the estimated loss, as noted in the aforementioned equation, by the corresponding estimate of physical capital for that particular year. The estimation of physical capital is derived by incrementally summing the annual capital formation, which comprises additions to the fixed assets of the economy net of changes in inventory levels, to the estimated capital stock. This process begins from the year 1990 and continues over subsequent years, as illustrated below:
Using the formula above, we can estimate the adjusted losses per physical capital unit from extreme climate-related events for the countries.
Temperature Anomaly and Climate Losses: Estimating a Fit and Extrapolating a Relationship
We use the IPCC mitigation pathways to assess future temperature anomalies. Exhibit 2 shows average global mean temperatures relative to pre-industrial levels projected by Factor Analysis of Information Risk (FAIR) and Model for the Assessment of Greenhouse Gas Induced Climate Change (MAGICC) in 2030, 2050 and 2100 for each of IPCC mitigation pathways. There is an additional no-mitigation scenario with temperature anomalies of 2°C above pre-industrial levels.

The generally adopted view regarding climate change today is that the intensity of climate-related events in the future is likely to vary depending on the extent to which society can effectively limit global warming. To anticipate the potential escalation of losses resulting from climate-related disasters, we establish a method for projecting the growth in the increased intensity of these events. We employ a straightforward linear interpolation between specific years to generate estimates of temperature anomalies for intermediate years. By utilizing this method, we can create a projection of temperature anomalies over all times in the horizon. Exhibit 3 provides a representation of the estimated temperature anomalies across the projected timeline.
Given the lack of country-specific data, we resort to utilizing data from the US as a proxy and assume that the relationship between incremental climate losses per GDP and temperature anomalies observed in the US will hold true across other countries as well. This assumption allows us to extrapolate the findings from the US and apply them to estimate the potential impacts in countries where specific data is unavailable. Indeed, this approach involves quite a degree of uncertainty, we acknowledge, considering the evidence provided by the World Bank and German Watch noted above. However, given the current limitations and lack of comprehensive data, we employ it as a means to make estimations and draw insights until better data becomes available. Particularly in this area of research for which there is no historical data or precedent, it is important to acknowledge the limitations of the approach as we employ it, and to remain open to refining the analysis as new data sources and methodologies become accessible.
Rates of climate losses as a fraction of GDP for each pathway were estimated by fitting an exponential relationship between the CPI-adjusted five-year average of all weather-related costs in the US and the average temperature anomaly relative to pre-industrial levels in the US. A lag of two years between temperature and losses showed the best fit, so we postulate this relationship in this study. Both series are published by the National Centres for Environmental Information (NCEI)14, and encompass 36 years of historical data from 1985 to 2020. Exhibit 4 shows the scatterplot of actual data and the fitted exponential curve for the US.
Assuming this relationship holds true in the future, we can project the potential impact on both economic activity and physical assets in a country for each IPCC pathway. However, we acknowledge that the persistence of historical relationships between losses and temperature anomalies over the next few decades, particularly across countries, is a strong assumption, given societal adaptation as new conditions unfold over time. The integration of climate science into financial risk management is still in its early stages, necessitating reliance on strong assumptions. As new data emerges, assumptions can be revised and refined over time, allowing for more accurate assessments across countries and temporal horizons.

From Country Level Data to Issuer Data—Adjusting for Type of Corporate Activity
A company's exposure to climate disasters is influenced not only by the location of its operations but also by the nature of its business activities. To estimate losses from physical risks at a company level, moving from country estimated losses per GDP, we introduce an adjustment based on the issuer's NACE code15, which classifies different economic activities. We then use the Operations Risk Score from Moody's, an indicator of vulnerability to physical risks. The Operations Risk Score assesses the exposure and vulnerability of different business activities to extreme weather events such as storms, floods and heatwaves. By incorporating this additional factor, we enhance the accuracy of estimating a company's exposure to physical risks, considering the specific characteristics of its operations.
Scenario Analysis
Now that we have moved from country-level loss estimates to issuer-specific loss estimates, we can perform the scenario analysis for corporate bond portfolios, using our postulated linear damage function. Our approach aims to evaluate the present-day projected impact of future weather-related events on the EBITDA of issuers associated with each IPCC pathway. We use the postulated expected damage function, which is issuer-specific data adjusted for the geographical distribution of both revenues and physical assets, as well as the nature of the issuer's business activities. In Exhibit 5, we show the breakdown between revenues and assets on a regional basis for a global financial corporation16, and Exhibit 6 illustrates the distribution of physical assets for the same issuer.
To estimate the impact of weather events on the value of each bond, we assume that the ratio between enterprise value and EBITDA remains constant, as in our previous research.7,8 Under this assumption, a negative 10% impact on EBITDA from lost revenues and physical asset losses corresponds to a 10% decrease in the stock price of the issuer. We recognize that alternative formulations relating changes in enterprise value to EBITDA shocks may be applicable, particularly in a dynamic framework. However, for the sake of simplicity, we have opted for this approach.

Next, we estimate the sensitivity of option-adjusted credit spreads (OAS) to significant stock price changes and use this information to derive a present-day estimate of the impact on the corporate bond price. This is done by multiplying the change in the bond’s OAS (sensitivity times stock price impact) by its spread duration.
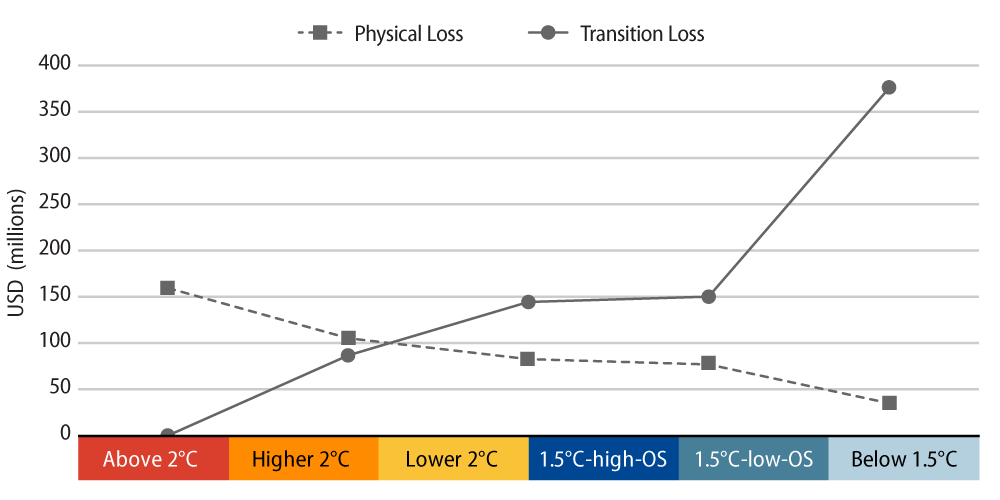
Exhibit 7 presents a physical risk dashboard that we have developed to illustrate how another issuer’s exposure and vulnerability influence its OAS within our scenario analysis. Different companies generate revenues and have physical assets in different regions in the world. And specific company data are used to estimate the impacts on this particular issuer for each IPCC carbon price pathway. In Exhibit 8, we showcase the monetary losses attributed to both physical and transition risks for this particular issuer.
The potential impact from physical risks to this corporate issuer decreases as the target temperature anomaly in each IPCC scenario decreases. Conversely, as also shown in our prior research7, 8, the opposite holds true for transition risks due to the higher future carbon tax (median across all studies involved) as temperature anomaly targets decrease. We note the opposing direction between transition and physical risks as we move from one IPCC scenario to another.
The results presented here for one particular company can be aggregated to the portfolio level via the market weight of each issuer. The aggregation process can be applied to obtain results for portfolios and benchmarks, and we can also assess estimates at the active level. In order to illustrate how our approach extends to entire portfolios, we conduct the scenario analysis for three different market indices: the Bloomberg US Credit USD Unhedged Index, the Bloomberg US High Yield 2% Issuer Cap USD Unhedged Index and the Bloomberg Global Aggregate – Corporates USD Hedged Index.
Exhibit 9 shows the estimated impact, as of today, on the three indices from physical losses for each one of the IPCC pathways.
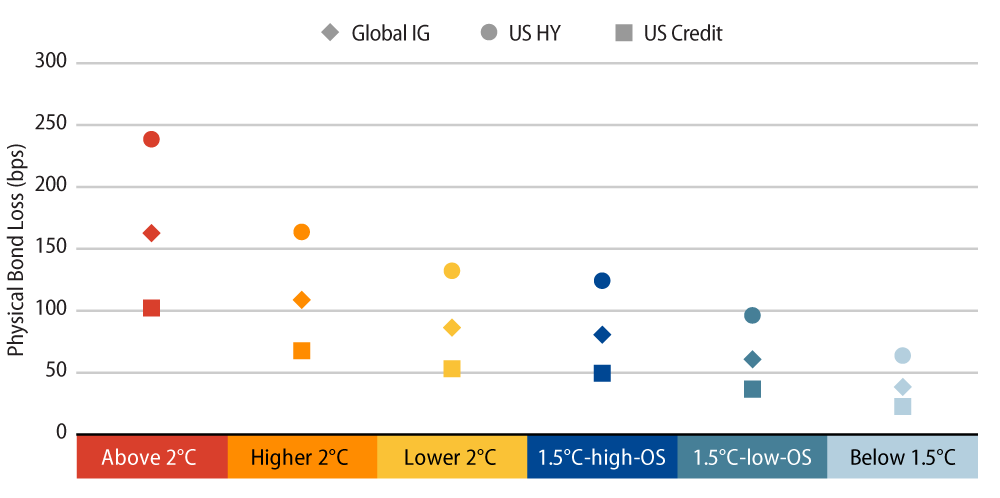
In the Above 2°C IPCC scenario, where basically no action is taken to address climate change and temperature anomalies are projected to rise, the estimated impact to these benchmarks of climate-related disasters reach their highest levels. Conversely, in a scenario where society demonstrates ambition and successfully implements significant emissions taxes, as in the Below 1.5°C scenario, the estimated losses from climate disasters are anticipated to be the lowest.
The estimated impact on the US High Yield Index stands out as consistently higher across all IPCC scenarios in comparison to the other two indices. This discrepancy can be primarily attributed to the generally lower EBITDA margins of its constituents, as compared to the other two indices; taxes on emissions tend to impact these issuers more heavily. This index exhibits a concentration in sectors characterized by low EBITDA margins, namely consumer cyclicals and consumer noncyclicals. Together, these two sectors account for approximately 56% of the estimated losses within the US High Yield Index. The Global Index has a significant exposure to financials, with a notable concentration in real estate investment trusts (REITs), which are particularly vulnerable to physical losses. As a result, the estimated impacts on OAS and subsequent price impacts are more substantial for the Global Index when compared to the US Credit Index. Different spread durations also play a role in the overall estimated losses for the three indices.
We should note that these are instantaneous impacts, measured as of the date of our study, assuming that the composition of these indices remains constant. We do not know how the Global Index or any other portfolio composition will look in the future, especially as issuers adapt in different ways to new economic conditions, and especially if future carbon prices are substantially different than today’s. As we have previously shown, in particular those that do not adapt might face potential downgrades or even survivability problems. Therefore, our analysis is myopic in the sense that it does not consider future potential portfolio and corporate responses in the estimation process of potential impacts, but a truly dynamic framework would be extremely difficult to work with. Moreover, we want to note that the estimated impacts as of today do not accrue in the portfolio, so the long-term consequences of these estimated impacts might become substantial.
Conclusion
While researchers and investors have placed greater focus on the transition risks of climate change, they should not disregard the physical risks when assessing the climate risk impacts on corporate bonds. Our analysis estimates the impact of physical effects of climate risks on valuations and the financial health of companies. Higher frequency and risk of climate events can directly impact the profitability of companies by reducing corporations’ economic activities and damaging their physical assets. This can potentially impact the creditworthiness of issuers and affect the estimated probability of defaults, credit ratings and borrowing costs. Different companies in different sectors operating in different regions of the world are impacted differently, and this paper seeks, with necessary approximations, to understand these impacts.
- Celso Brunetti, John Caramichael, Matteo Crosignani, Benjamin Dennis, Gurubala Kotta, Don Morgan, Chaehee Shin, and Ilknur Zer, "Climate-Related Financial Stability Risks for the United States: Methods and Applications," Finance and Economics Discussion Series 2022-043 (Washington: Board of Governors of the Federal Reserve System, 2022), https://doi.org/10.17016/FEDS.2022.043.
- "Climate-Related Indicators: Analytical Indicators on Physical Risks," European Central Bank, accessed September 14, 2023, https://www.ecb.europa.eu/stats/ecb_statistics/sustainability-indicators/data/html/ecb.climate_indicators_physical_risks.en.html.
- "Climate Change," Bank of England, July 6, 2023, https://www.bankofengland.co.uk/climate-change.
- Samuel Kurian, Geordie Reid and Maxwell Sutton, "Climate Change and Financial Risk," Reserve Bank of Australia, April 6, 2023, https://www.rba.gov.au/publications/bulletin/2023/jun/climate-change-and-financial-risk.html.
- "Bank of Canada Disclosure of Climate-Related Risks 2022," Bank of Canada, April 2023, https://www.bankofcanada.ca/2023/04/bank-of-canada-disclosure-of-climate-related-risks-2022/.
- Juliano Assunção, Flávia Chein, Giovanni Leo Frisari, Sérgio Mikio Koyama, "Another Boiling Frog: The Impact of Climate-Related Events on Financial Outcomes in Brazil," Banco Central do Brasil Working Paper Series, no. 572 (January 2023): 3-57. https://www.bcb.gov.br/content/publicacoes/WorkingPaperSeries/wps572.pdf.
- Roberto Apelfeld, Paulo Caricati, Tania Labastida Garcia, Brishni Mukhopadhyay, and Marjan Zahedi, "Portfolio Risk and Climate Change: Transition Risks in Credit Portfolios," Western Asset, March 28, 2022, https://www.westernasset.com/us/en/research/whitepapers/portfolio-risk-and-climate-change.cfm.
- Roberto Apelfeld, Paulo Caricati, Tania Labastida Garcia, Marjan Zahedi, and Brishni Mukhopadhyay, "Decarbonize to Survive: Estimating the Impact of Transition Risks on Corporate Defaults," Western Asset, February 27, 2023, https://www.westernasset.com/us/en/research/whitepapers/decarbonize-to-survive-2023-02.cfm.
- See, for example: Klaus Desmet and Esteban Rossi-Hansberg, "The Economic Impact of Climate Change Over Time and Space," NBER Reporter, no. 4 (December 2021), 16-20. https://www.nber.org/reporter/2021number4/economic-impact-climate-change-over-time-and-space.
- Joeri Rogelj, Drew Shindell, Kejun Jiang, Solomone Fifita, Piers Forster, Veronika Ginzburg, Collins Handa, Haroon Kheshgi, Shigeki Kobayashi, Elmar Kriegler, Luis Mundaca, Roland Séférian, and Maria Virginia Vilariño, "2018: Mitigation Pathways Compatible with 1.5°C in the Context of Sustainable Development," Global Warming of 1.5°C. An IPCC Special Report on the Impacts of Global Warming of 1.5°C Above Pre-Industrial Levels and Related Global Greenhouse Gas Emission Pathways, in the Context of Strengthening the Global Response to the Threat of Climate Change, Sustainable Development, and Efforts to Eradicate Poverty, edited by Valerie Masson-Delmotte, Panmao Zhai, Hans-Otto Pörtner, Debra Roberts, Jim Skea, Priyadarshi R. Shukla, Anna Pirani, Wilfran Moufouma-Okia, Clotilde Péan, Roz Pidcock, Sarah Connors, J.B. Robin Matthews, Yang Chen, Xiao Zhou, Melissa I. Gomis, Elisabeth Lonnoy, Tom Maycock, Melinda Tignor, and Tim Waterfield, (Cambridge, New York: Cambridge University Press: 2022): 93-174. https://www.ipcc.ch/site/assets/uploads/sites/2/2022/06/SR15_Full_Report_LR.pdf.
- David Eckstein, Vera Kunzel, Laura Schafer, "Global Climate Risk Index 2021: Who Suffers Most From Extreme Weather Events? Weather-Related Loss Events in 2019 and 2000 to 2019" GermanWatch, January 25, 2021, https://www.germanwatch.org/en/19777.
- Rowena House, Pascaline Wallemacq, "Economic Losses, Poverty & Disasters: 1998-2017," Centre for Research on the Epidemiology of Disasters, United Nations Office for Disaster Risk Reduction, 2018, accessed September 14, 2023, https://www.undrr.org/publication/economic-losses-poverty-disasters-1998-2017.
- "Physical Capital Stock: Sources, Methodology and Results," The World Bank Data Catalog, March 19, 2021, last modified January 19, 2023, https://datacatalog.worldbank.org/search/dataset/0041411.
- "U.S. Billion-Dollar Weather and Climate Disasters," NOAA National Centers for Environmental Information (NCEI), last updated September 11, 2023, https://www.ncei.noaa.gov/access/billions/.
- The Statistical Classification of Economic Activities in the European Community, commonly referred to as NACE is the industry standard classification system used in the European Union. https://ec.europa.eu/eurostat/web/products-manuals-and-guidelines/-/ks-ra-07-015.
- Note that breakdowns are not always available with enough granularity to show all countries in which a corporation produces revenues and has assets. In the case of the example, we can then use a region as if it were a country in the linear damage function.