

KEY TAKEAWAYS
- 2022 was arguably the worst year for bonds since the Great Depression and by far the worst year for the Bloomberg US Aggregate Index since its inception in 1976.
- Our portfolios underperformed their benchmark, primarily due to our duration positioning.
- Yields are now much more attractive and at heights unseen in many years.
- After last year’s experience, credit spreads have widened and, in many cases, are now above their longer-term averages.
- Looking ahead, we expect that ongoing progress toward lower inflation will continue to support longer-dated bonds and spread sectors.
- We are focused and determined to recover our performance and aim to reach new highs by adhering to our time-tested philosophy and the process that has successfully guided the Firm’s investments for over 50 years.
Background
Coming into 2022, Western Asset anticipated an environment of positive but decelerating global growth from the robust levels of 2021. Our view at the time was that the impact of the extraordinary monetary and fiscal stimulus measures employed by central banks and governments worldwide to protect their respective economies from Covid-related difficulties would recede and eventually dissipate. Staffing and production levels would normalize and supply-chain bottlenecks would ease. Global supply and demand of goods and services would become more balanced and economic normalcy would return. Moreover, inflation pressures, despite being more persistent than anticipated, would recede during 2022. Against this backdrop, we expected that yields would stay fairly low and range-bound and that risk assets would do well with our US Broad Market portfolios, which were well-positioned to take advantage of a normalizing macro environment by maintaining diversified exposure across select spread sectors and a duration hedge against broad market risks.
What Happened
As 2022 progressed, global inflation pressures continued to rise and far exceeded both market and central bank expectations. Price shocks were then exacerbated by Russia’s invasion of Ukraine, which put additional pressure on food and energy prices, and the reinstatement of Covid lockdowns in China added to supply-chain pressures. These collective developments forced major central banks to suddenly and sharply pivot to a much more hawkish monetary policy stance. For instance, the Federal Reserve (Fed) had to dramatically shift course and continually shift its rate-hike expectations higher throughout the year. After starting the year only anticipating the need to raise the fed funds rate by 75 basis points (bps) in 2022, it ended up raising rates by a total of 425 bps, which culminated in the fastest pace of rate hikes in a single year since the 1980s. What resulted was arguably the worst year for bonds since the Great Depression and by far the worst year for the Bloomberg US Aggregate Index since its inception in 1976.
The lack of diversification in the market—as the traditional diversifying correlation of stocks/bonds broke down in 2022—presented an additional challenge for investors last year. Historically, Western Asset has successfully used diversification to reduce the volatility of portfolios. This has served as a more effective approach than simply cutting positions. However, portfolio diversification requires that there exist negatively correlated assets to be used together in a portfolio. For example, US Treasury bonds historically have exhibited a negative correlation to risk assets in most market environments. However, during most of 2022, almost all assets were positively correlated and sold off at the same time. In short, there was no safe place to hide.
Impact on US Broad Market Portfolios
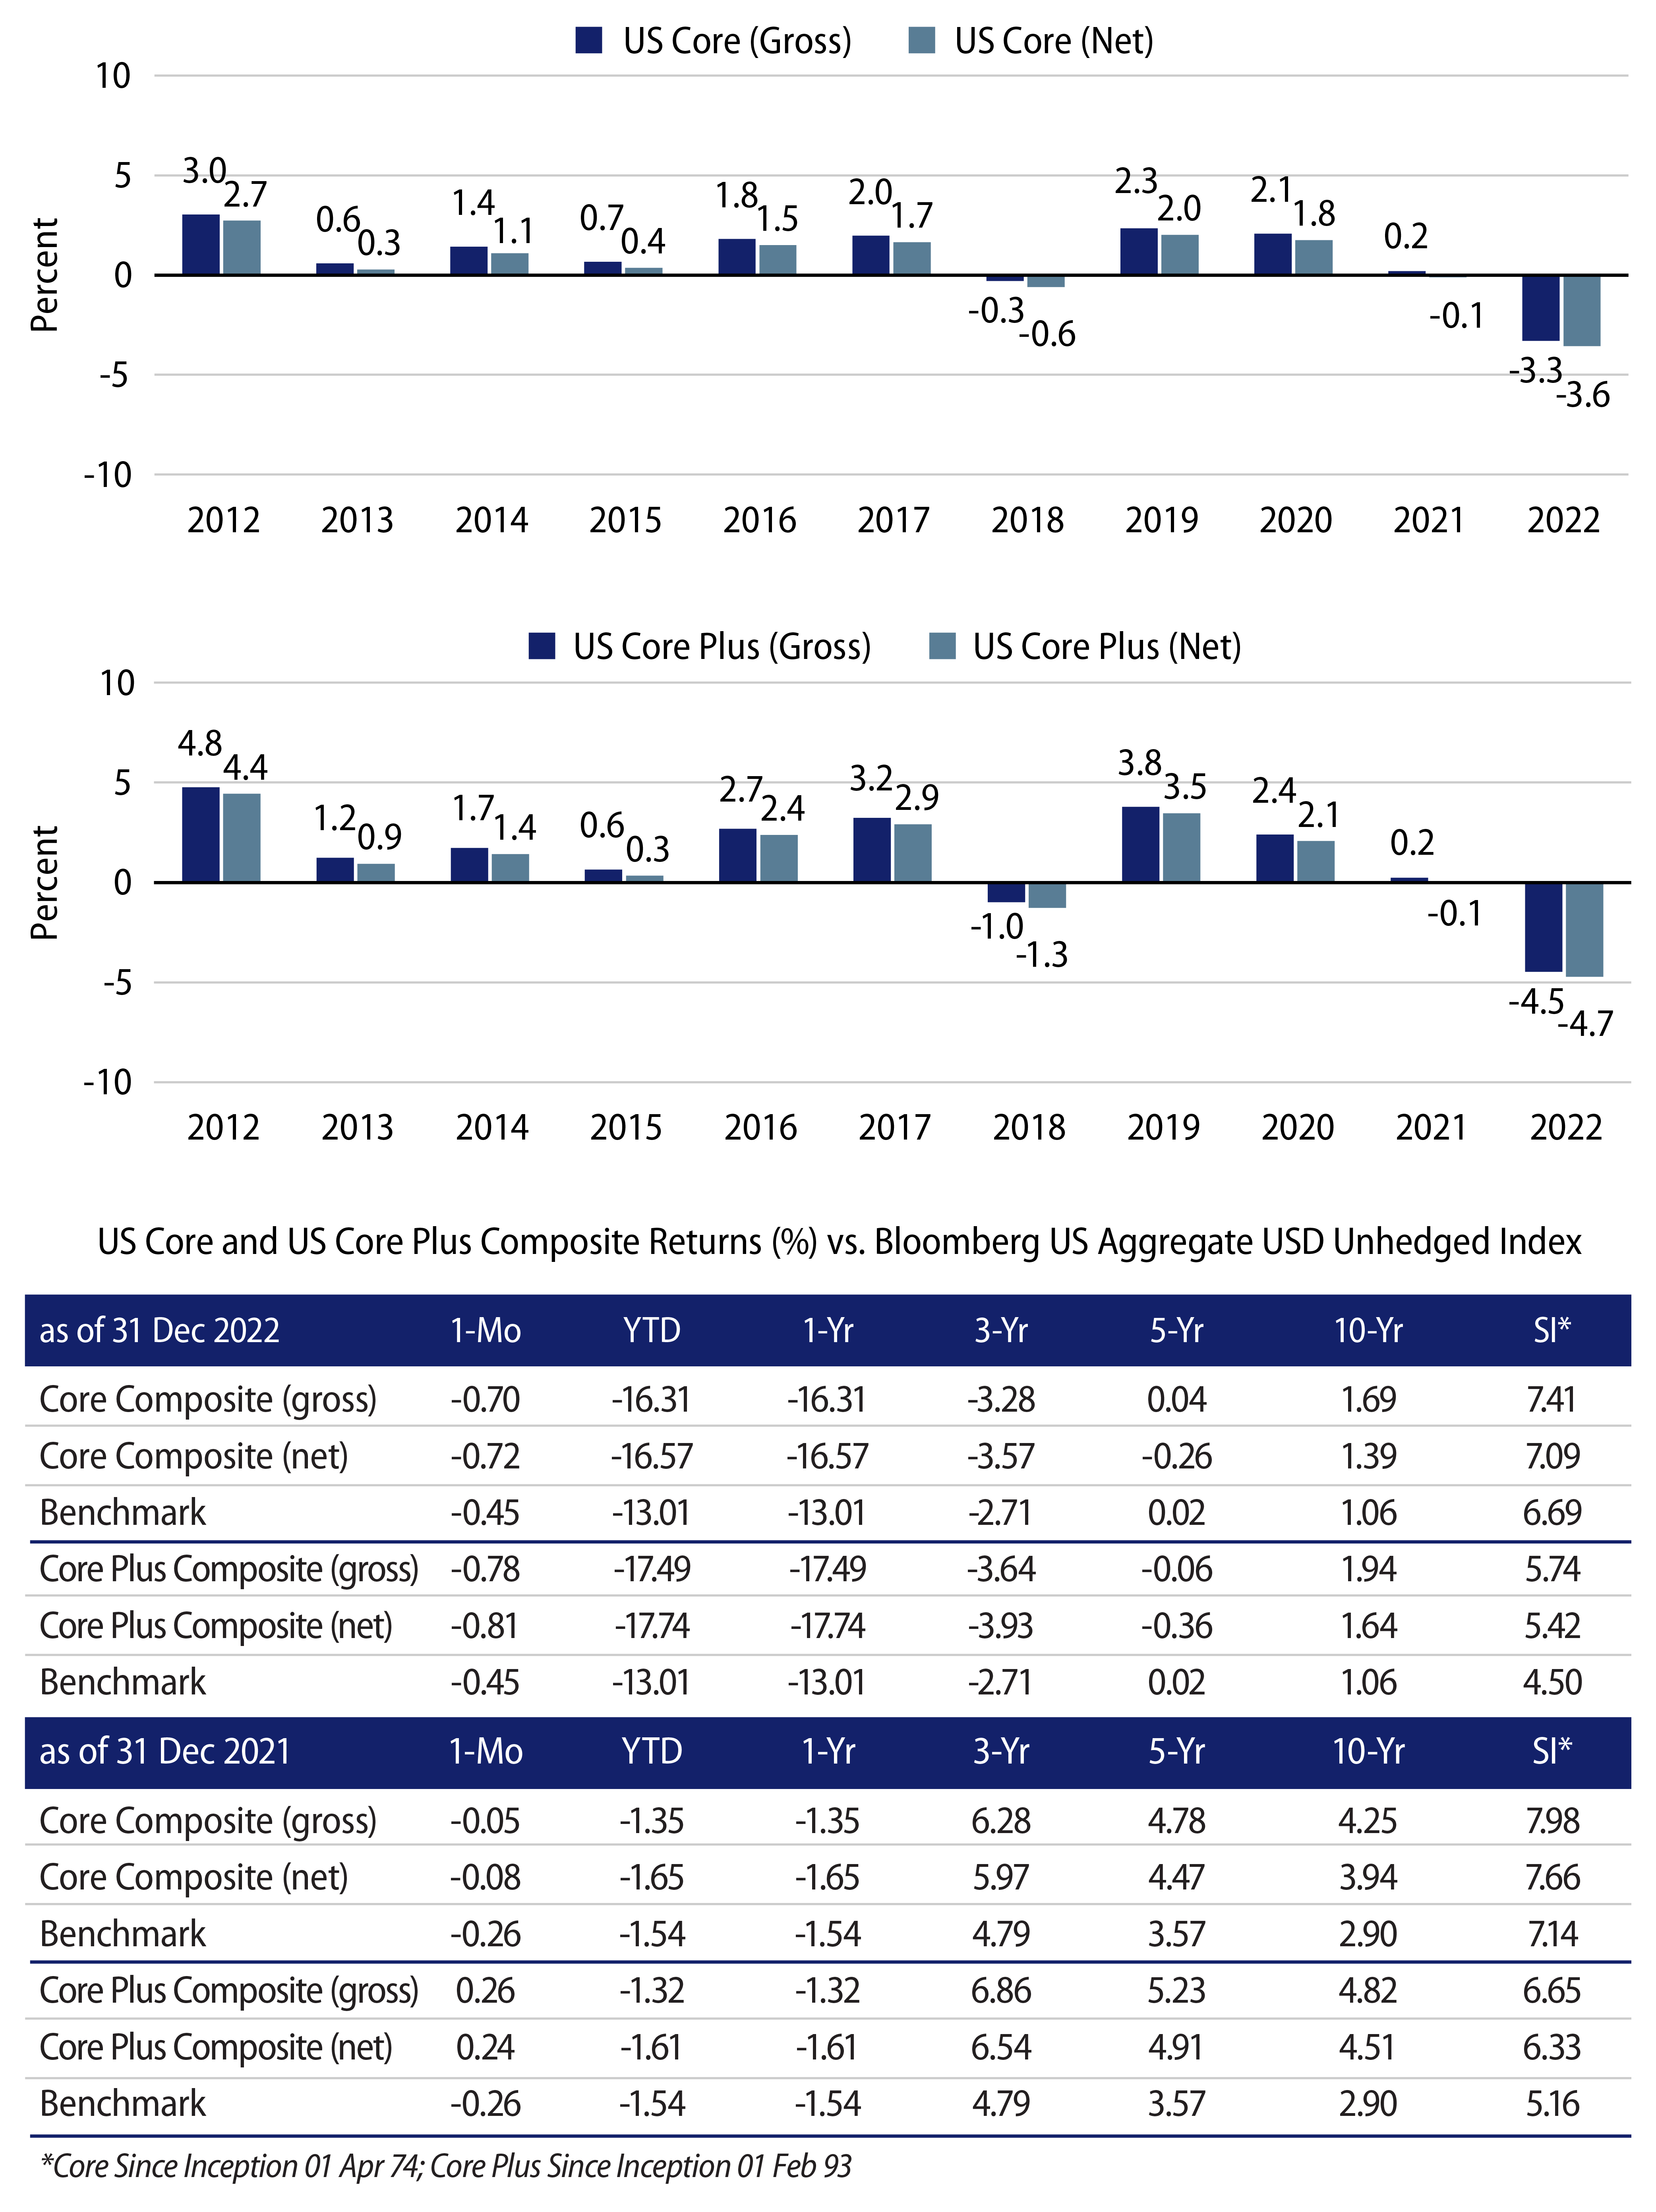
Not only was 2022 a difficult year for the bond market in general, but Western Asset’s US Broad Market portfolios had a challenging year as well. Our portfolios underperformed their benchmark, primarily due to our duration positioning. Western Asset is an active value manager and given that style, sometimes we find our positioning offsides; this was certainly one of those times. However, we have been in this position before and in each of those instances, we have been able to subsequently recover the underperformance and go on to achieve new highs. We’re confident we can do that again. Our diversified approach of using top-down macro strategies along with bottom-up sector/subsector and issue selection has historically shown the ability to outperform in a variety of different market environments. In fact, prior to the difficult 2022 experience, we had been able to deliver fairly consistent outperformance over the last 10 years in different risk-on and risk-off markets (Exhibit 1).
US Broad Market Positioning Moves
Over the course of last year, we significantly adjusted our yield-curve positioning in US Broad Market portfolios. Specifically, we reduced our exposure to the front of the yield curve, while at the same time increasing exposure to the back end of the curve. The environment over most of 2022 was characterized by elevated uncertainty around the very near-term path for inflation and Fed policy rates, but also by elevated longer-term yields that we thought represented value. In recognition of that near-term uncertainty, we reduced exposure to the parts of the yield curve that are most sensitive to monthly inflation prints and to Fed meetings/announcements. At the same time, in recognition of its compelling value, we increased exposure to those parts of the yield curve where we most expected yields to decline over time as growth moderates and inflation trends lower.
We also looked to reduce emerging market (EM) exposure as this sector can be particularly sensitive to an environment of ongoing geopolitical turmoil and aggressive Fed rate hikes. Earlier last year, in Core Plus portfolios we trimmed exposure to local currency EM debt, and later in the year, we trimmed exposure to USD-denominated EM debt in all Broad Market portfolios as we saw better relative value in other investment-grade sectors. While our long-term view of EM continued to be very constructive, we recognized that the near-term outlook was uncertain and that EM volatility was likely to remain elevated.
On the flip side, volatility across fixed-income markets throughout 2022 has served to restore value in spread sectors. Credit spreads have widened and, in many cases, are now above their longer-term averages. While our outlook is for positive, below-trend growth, the potential for Fed overtightening leading to a recession cannot be ruled out. To help guard against this outcome, we generally moved up in quality in our other spread sector allocations. For instance, we trimmed exposure to high-yield bonds and bank loans and increased our exposure to high quality sectors, which typically exhibit less volatility and where valuations looked attractive, including investment-grade corporates and senior tranches of non-agency structured products, and we closed our underweight to agency mortgage-backed securities (MBS) where performance has significantly lagged the performance of US Treasury securities.
Reasons for Optimism
High and persistent inflation pressures, as well as the subsequent hawkish pivot by the Fed, were the primary cause of the significant selloff in the bond market last year. However, those pressures appear to be abating. The December 2022 Consumer Price Index (CPI) report showed the third straight monthly decline in the core inflation year-over-year (YoY) reading at 5.7% compared to its peak of 6.6% in September. YoY headline CPI has also slowed to 6.5% in December compared to its peak of 9.1% in June.
Forward-looking indicators of inflation have also cooled significantly and we expect that inflation readings will continue to ease. Inflation expectations have moderated and are substantially lower from their summer peak. Commodity prices have fallen sharply from elevated levels earlier in the year. Moreover, tighter monetary policy is having an impact, especially on the housing market as home prices have started cooling. Goods prices are also falling as inventory levels are building. We believe if this downward pressure on inflation persists, the Fed will be able to continue to slow the pace of its rate hikes and then pause by no later than the end of the first quarter of 2023. Once the Fed pause is confirmed, this should bode well for all financial markets.
Where Do We Go From Here?
The realized inflation data will continue to play an outsized role on portfolio performance moving forward. An environment of broad progress toward lower inflation is one in which markets can respond sharply to good news, as they did early in the summer of 2022, especially if that good news is validated by an eventual pause in Fed rate hikes. To us, this still appears to be the most likely outcome. Accordingly, we expect that ongoing progress toward lower inflation will continue to support longer-dated bonds and spread sectors. The positive outcome of a historically brutal bear market is that yields are now at heights unseen in many years. The yield on the Bloomberg US Aggregate Index, for example, has not been this high since 2007. The best predictor of future returns on a high-quality bond portfolio is the yield. With yields on most spread sectors ranging between 5% and 8%, and rate volatility expected to decline, future fixed-income returns appear compelling relative to other asset classes. We are also optimistic about the performance of our US Broad Market portfolios. Performance over 4Q22 has been more encouraging and we believe portfolios are positioned to continue to do well going forward. While it’s impossible to identify in advance what the drivers of potential excess returns may be over the coming months, the yield advantage of the portfolio over the benchmark is a good starting point. As of December 31, 2022, our representative US Core portfolio had a cash flow yield of 88 bps more than the benchmark, and our representative US Core Plus portfolio had a cash flow yield of 150 bps more than the benchmark. Credit spreads are currently above their long-term averages and we believe they are pricing in a considerable pessimism that we think is likely overdone. Spreads may continue to be volatile in the near term, but we believe that over time spreads should tighten from current levels. US dollar strength has been persistent this year, reaching 20- to 30-year highs versus some currencies, but we continue to believe that the US dollar is overvalued. A confirmed peak in inflation, a Fed pause, better distribution of global growth and stabilization of rates would all bode well for US dollar depreciation. While our rates positioning has been a detractor in 2022, we believe yields should edge lower over time as growth decelerates and inflation moderates; as such, our duration positioning, especially at the long end of the curve, can also be a positive contributor moving forward. We also believe that duration can serve as a valuable diversifier if our base case is too optimistic and economic growth slows more than we expect.
Maintaining a Longer-Term Perspective
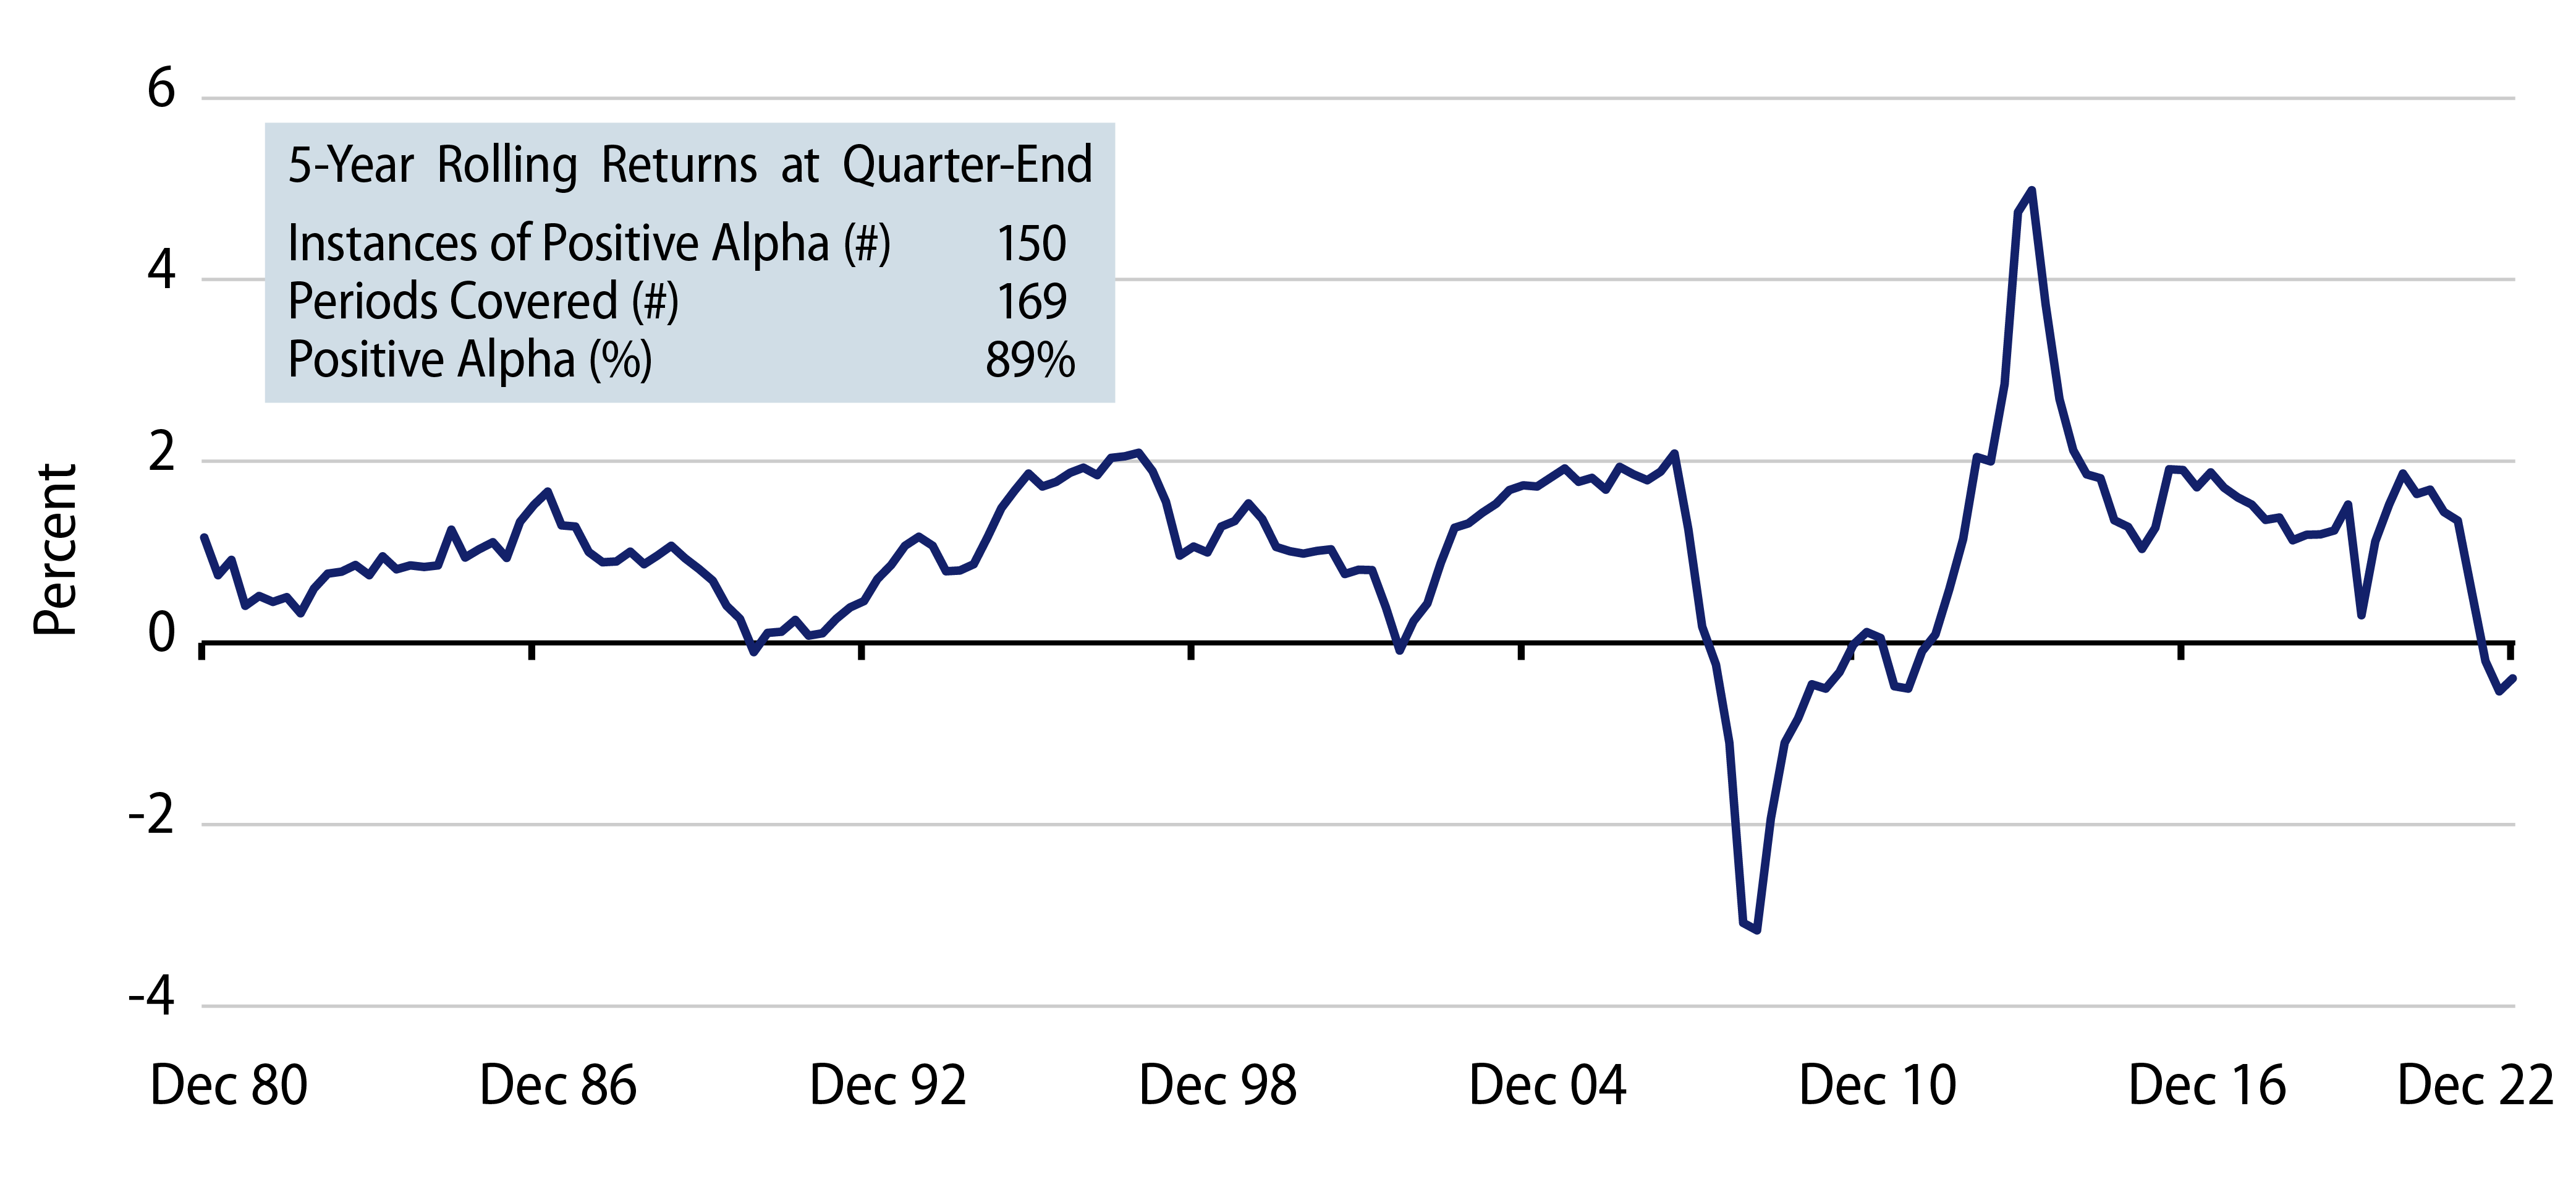
Investment managers may have strong performance in some markets and weak performance in others, but a history of consistently favorable rolling five-year returns can be a good gauge of returns over long periods of time. Exhibit 2 displays the rolling five-year excess returns versus the index for Western Asset’s Core Full Capabilities1 track record over the last 42 years. There were 169 rolling five-year period results, and Western Asset showed an outperformance on a net basis 150 times or in 89% of them.
While this has been a challenging period for us and for many investors, we believe our US Broad Market portfolios are positioned well for better days ahead. We are focused and determined to recover our performance and aim to reach new highs by adhering to our time-tested philosophy and the process that has successfully guided the Firm’s investments for over 50 years. Markets are incredibly difficult and they can be humbling at times. All investment managers will have their good and bad times. We have weathered some turbulent periods in the past but we have remained resilient—and come out stronger on the other side. While there are no guarantees, at Western Asset we feel very strongly that our value-driven investment process combined with our disciplined pursuit of diversified strategies should continue to produce the results our clients have come to expect.
View the Performance and Risk Disclosures for US Core and US Core Plus.
- This paper runs through basic performance tests that shed light on a manager’s strengths and weaknesses, using Western Asset’s long-term Core Full Capabilities performance track record. The Core Full Capabilities performance record represents the long-term investment results for Western Asset’s US-based broad market portfolios, reflecting the evolution of the Core (and Core Plus) investing style as it expanded its scope of permissible instruments (such as derivatives, below-investment-grade bonds and non-US bonds). The record reflects approximately the last 25 years of Core Plus composite performance—a more detailed explanation, along with the standard Core Plus composite information, is in footnote 2 and in the Performance Disclosure. The results are informative, as they provide a compelling rebuttal of the most common misconceptions we sometimes hear. Obviously, we have a clear self-interest in championing our results, but the statistical tests are straightforward, and the results speak for themselves.
- The Core Full Capabilities performance presented is supplemental information generated from actual portfolio performance that represents the evolution of Western Asset’s investment skills over the history of the Firm’s core fixed-income investment style. From inception through 31 December 1988, performance is represented by accounts that participated in the US Core Investment Grade No Futures & Options Composite. Beginning 1 January 1989 and through 31 December 1990, our capabilities expanded to include futures and options, and therefore this performance consists of accounts that participated in the US Core Investment Grade Futures & Options Composite. From 1 January 1991 through 31 January 1993, performance is represented by accounts participating in the US Core Below Investment Grade Futures & Options Composite to reflect our expanded capabilities to include below investment-grade securities. Beginning 1 February 1993 to current, we started utilizing opportunistic investment in non-US$ securities, and therefore this performance consists of accounts participating in the US Core Plus Composite. As of 31 Dec 22, returns for periods greater than one year are annualized. The Core Full Capabilities performance provided is supplemental to the US Core Plus Composite. Please see performance disclosures. Returns illustrated should not be considered an indicator or guarantee of future results and should not constitute the sole basis for an investment decision.