
KEY TAKEAWAYS
- Goods prices finally have begun to subside noticeably.
- Growth in real domestic demand has slowed substantially since March 2021
- US homebuilding activity is likely to fall further, due only in part to sharply higher mortgage interest rates.
- Although home prices and rents have risen dramatically in the last two years, rents for new tenants are heading lower.
- Regarding interest rates and inflation, whether rates are high or low does not matter for near-term economic growth as much as whether rates are rising or falling.
- Whether you focus on demand and supply as the driver of prices, or you focus on interest rates or the money stock as a measure of Fed policy—all these indicators point to a substantial moderation of inflation in the near future.
Western Asset celebrated its 50th anniversary last year. Over our now 51 years of experience as a fixed-income manager, we have prided ourselves on understanding the phenomenon of inflation and its effects on fixed-income investing. That understanding has been strained over the last year-plus as inflation has not only persisted but accelerated despite our expectations to the contrary.
Now, no we are not going to completely toss aside that half-century of thought process and experience. But with the harsh lessons of the last year, we do need to re-examine our approach and re-assess the likely course ahead. Typically, we would start with an analysis of monetary policy. We’ll not do that here.
Rather, we’ll start by analyzing the various major components of pricing within the US economy and outline the prospects for each of them: What did we get reasonably right this year, and where were we way off? After identifying both the encouraging and discouraging elements of the current pricing picture, we’ll close with a relatively short discussion of Federal Reserve (Fed) policy and other possible/likely sources of upward pressure on the aggregate price level.
Goods Sector Inflation
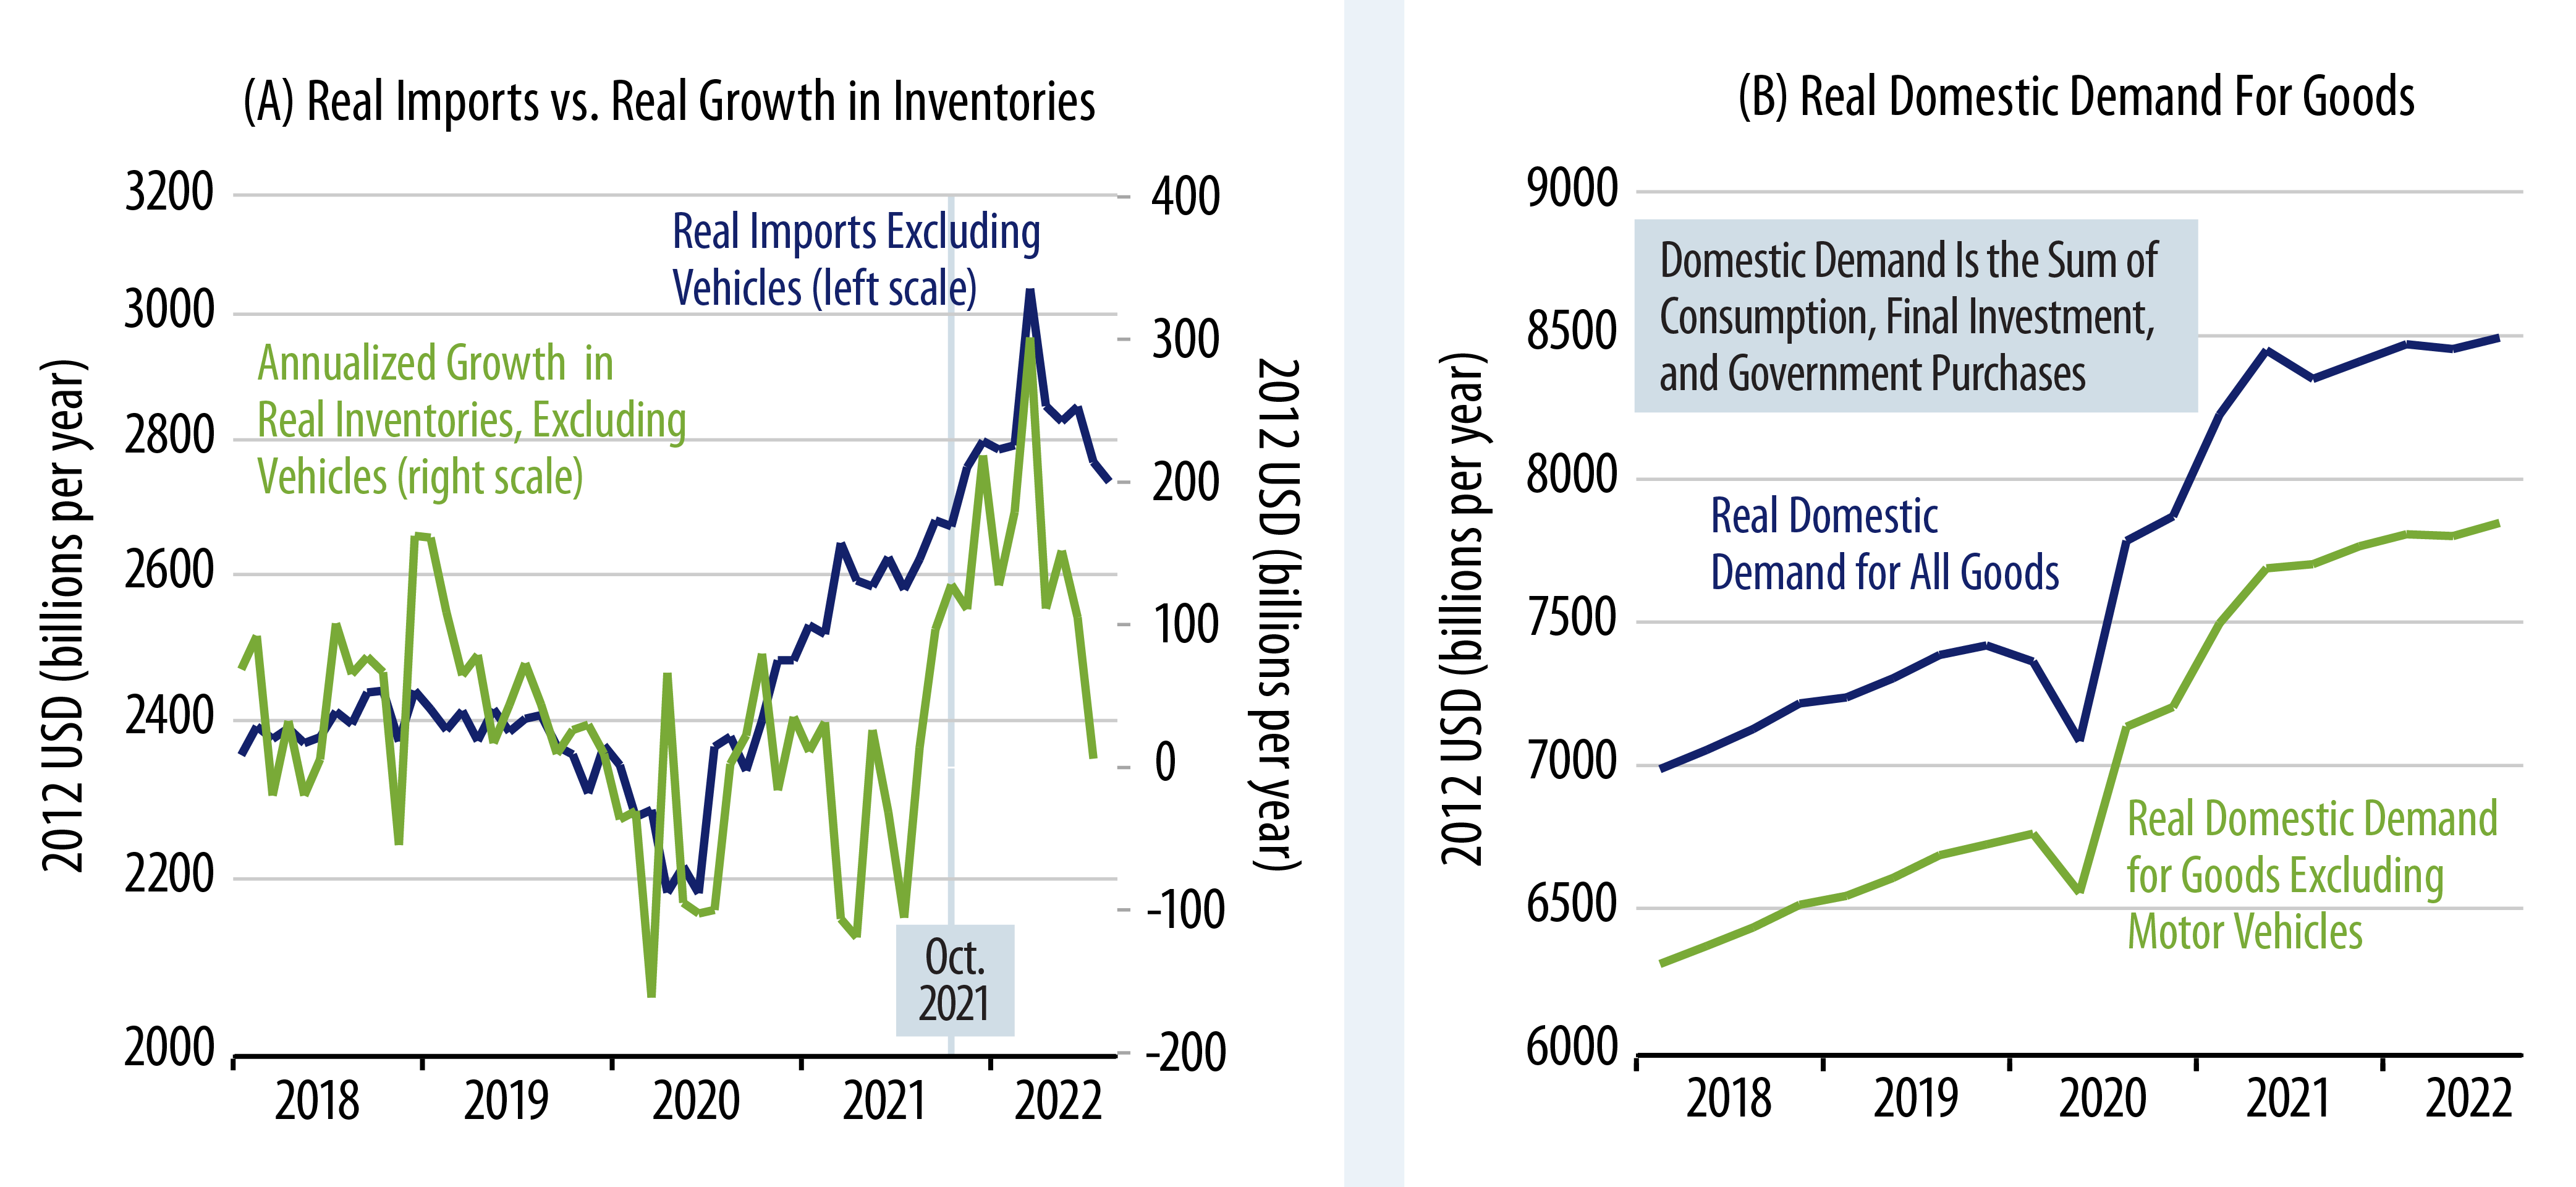
Our take this time a year ago was that the late-2021 flare-up in inflation reflected supply-chain difficulties that would quickly reverse. We thought that the pick-up in inflation that had occurred prior to fall 2021 was in fact merely a reversal of the deflation that occurred during and just after the Covid shutdown. With a massive backlog of unloaded container ships anchored off the Los Angeles coast in October 2021, merchants across the country were short on inventory. While that could be expected to raise prices for affected merchandise, we thought those effects would be brief and would not spread to the rest of the economy.
In fact, with US imports rising sharply in the months after October 2021, merchants’ inventories did expand dramatically in 4Q21 and 1Q22, and supply backlogs have steadily waned over the course of this year. Only recently have goods prices begun to subside noticeably, but this process is—finally—underway. Exhibit 1 (A) shows both the surge in imports and the resulting surge in inventories from November 2021 through March 2022, along with the subsidence in both since then. Meanwhile, growth in real domestic demand has slowed substantially since March 2021, as shown in Exhibit 1 (B).
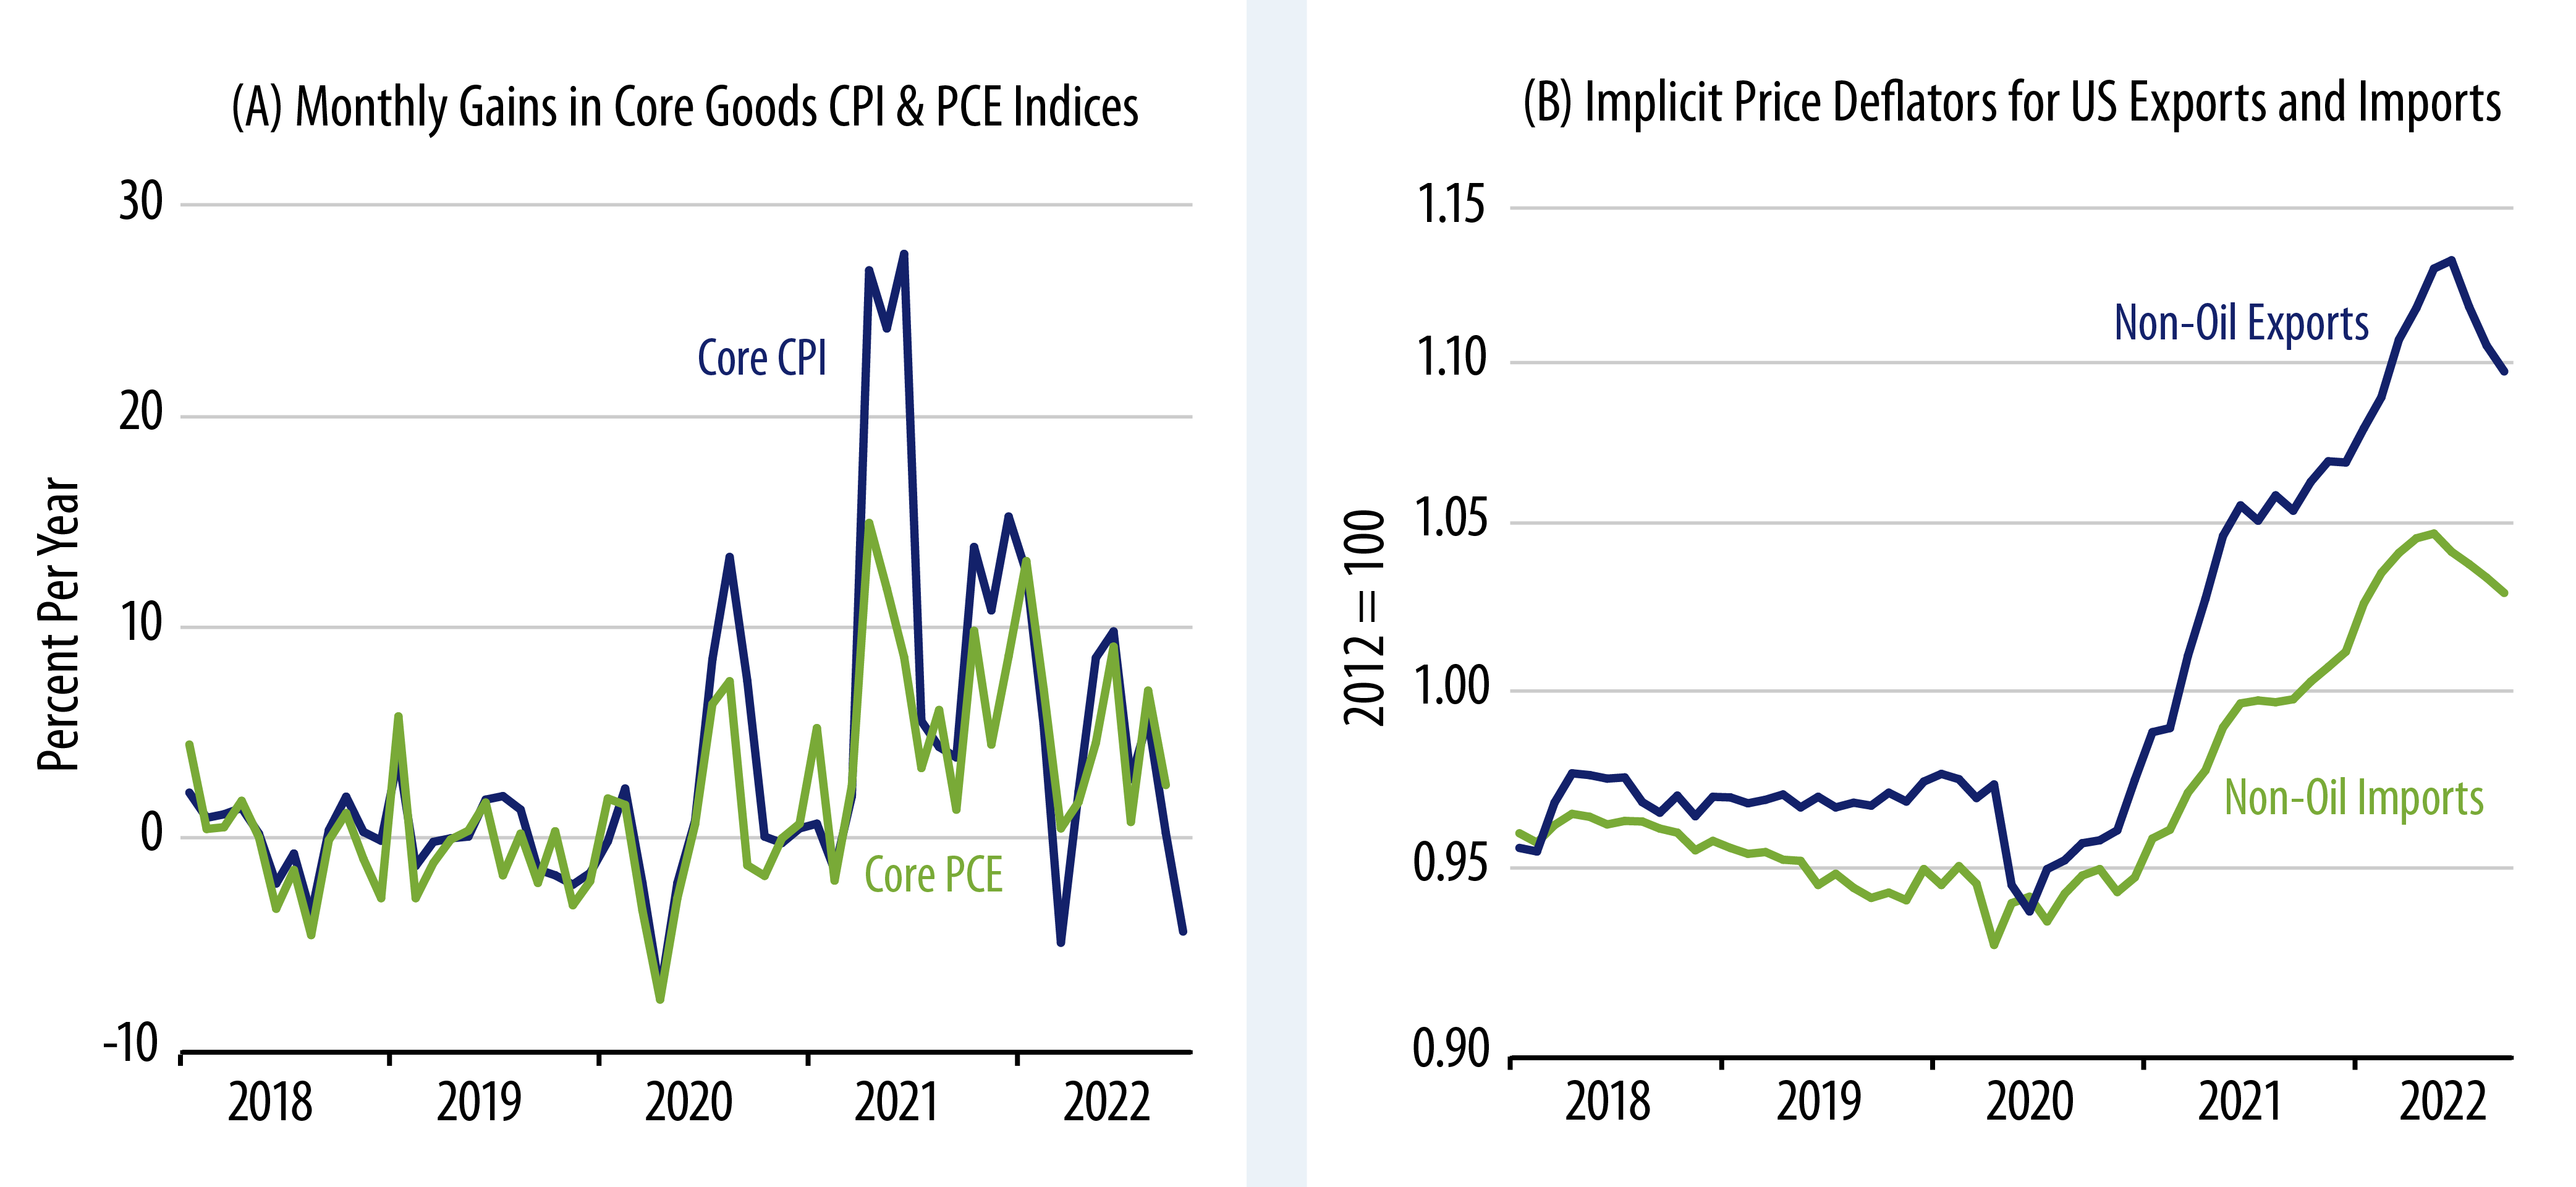
While goods shortages started to subside in late-2021 and very early-2022, goods price inflation has subsided only recently, as shown in Exhibit 2 (A). Still, we would assert that these pressures are cumulative and that goods prices will continue to moderate and most likely decline further over the next six months. Certainly, prices for US exports and imports have been declining for quite a few months. (Note that Exhibit 2 (B) excludes oil prices—including the drop in oil prices that would result in an even sharper recent drop in import and export prices.)
Housing Is in for a Major Pullback, Substantial Home Price Declines Likely as Well
At this point, virtually everyone agrees that US homebuilding is set to fall further, and there is no doubt that sharply higher mortgage interest rates are part of the story here. What we would contend is that the homebuilding market was headed for a substantial pullback even before mortgage rates began their rise.
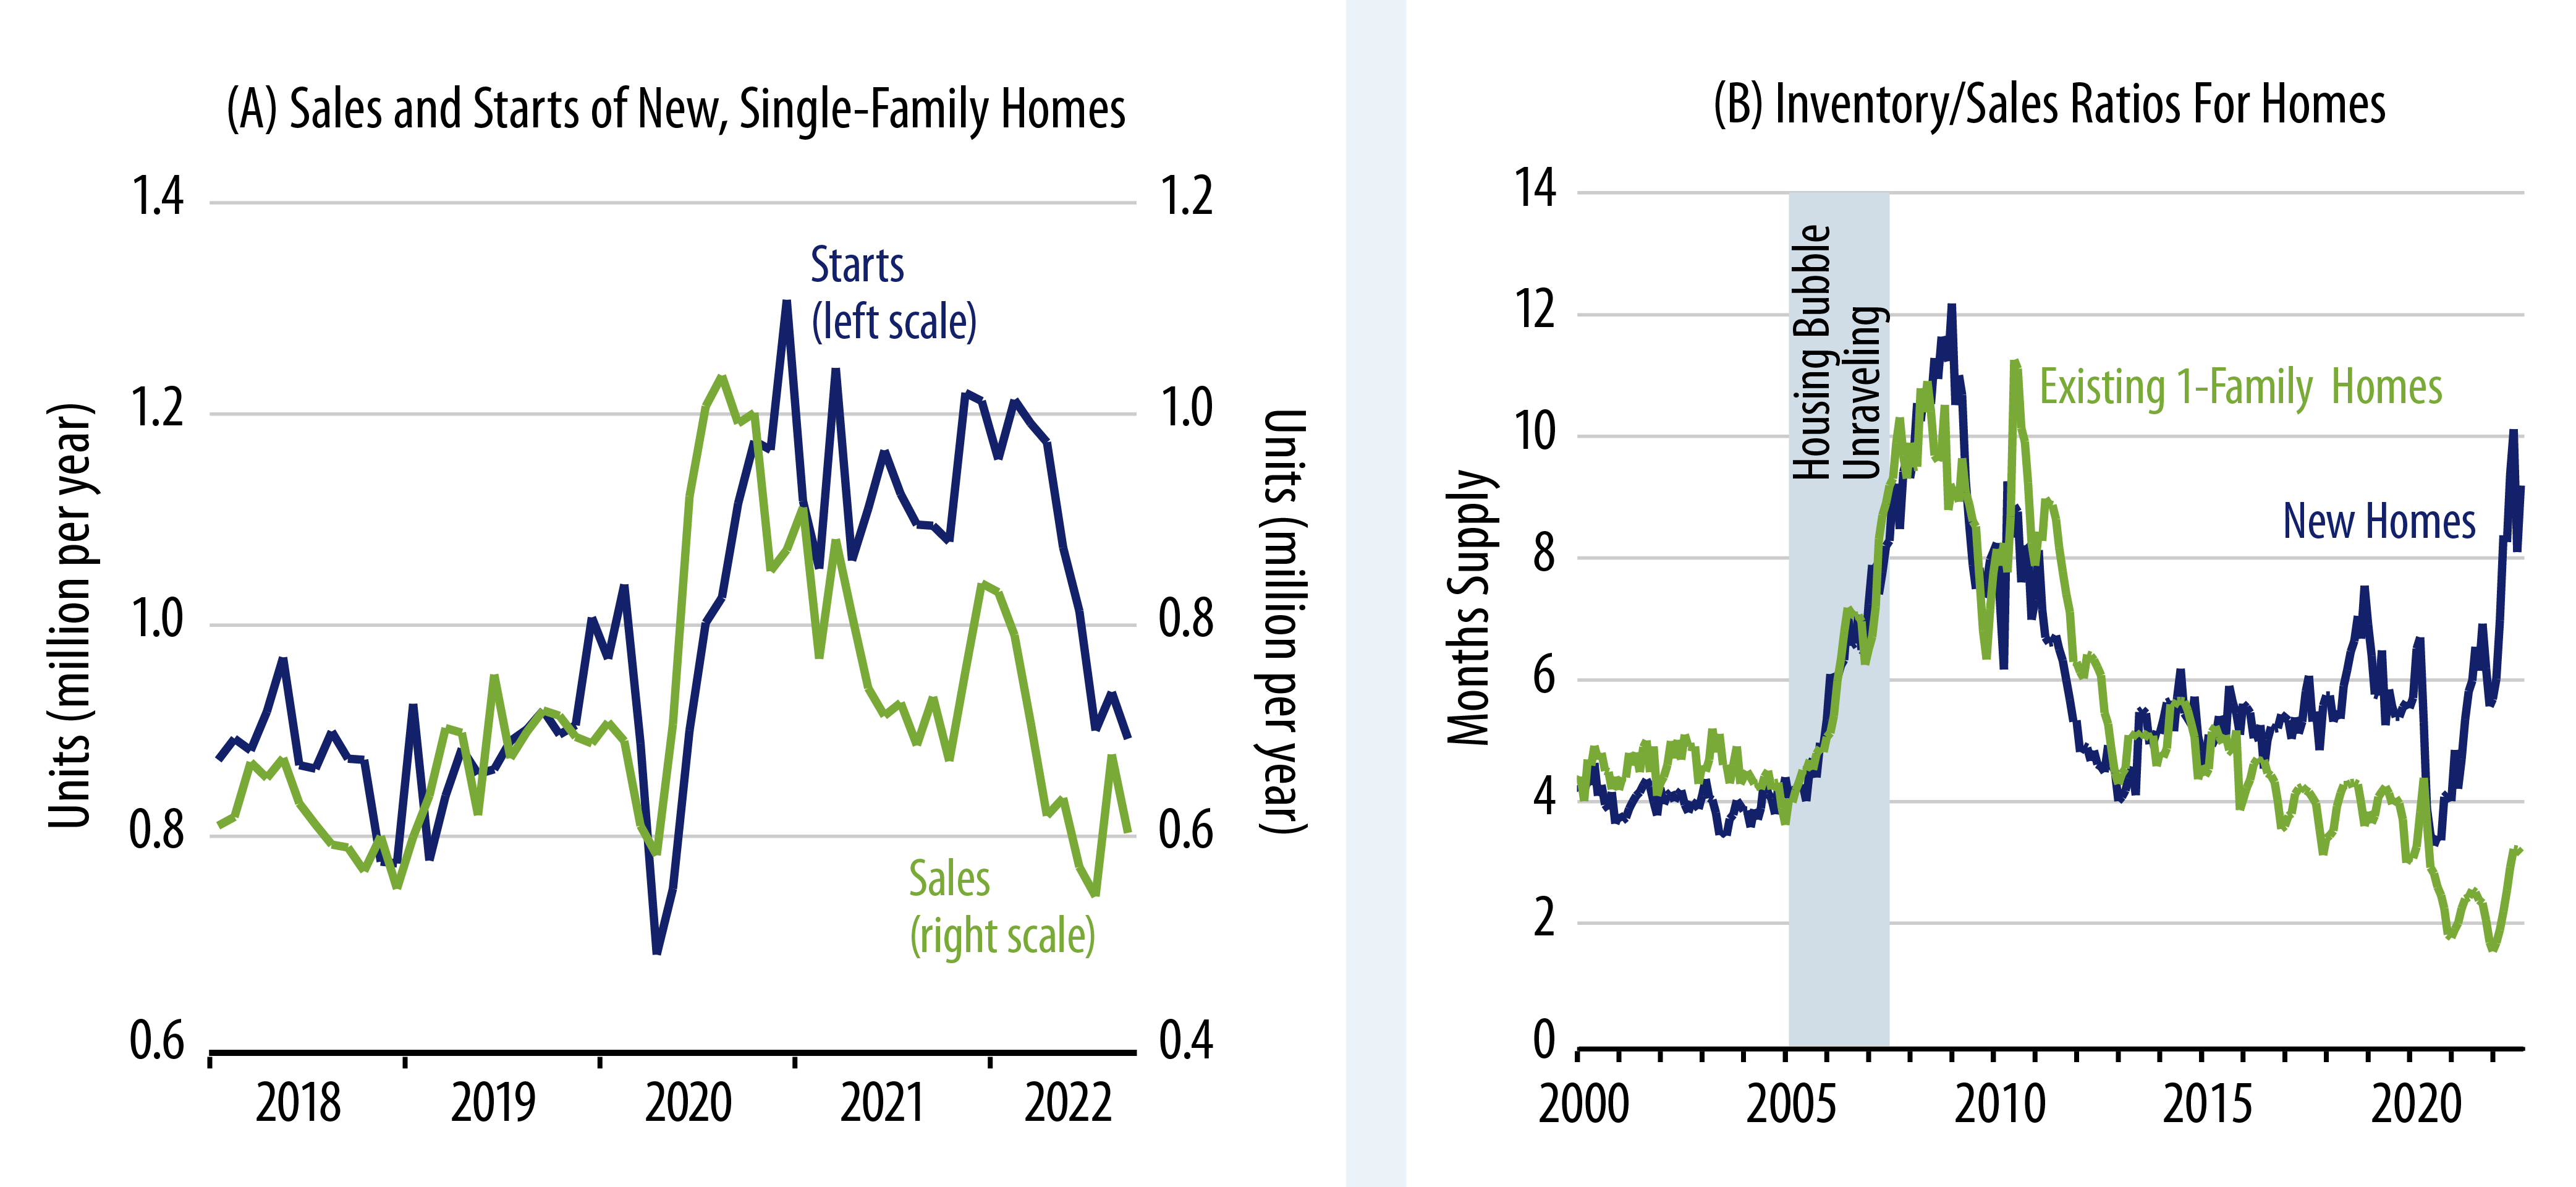
Homebuilding recovered from its Covid-shutdown decline sooner and more substantially than any other sector of the economy. As you can see in Exhibit 3 (A), by late-2020, single-family housing starts had risen to levels 35% above those prevailing prior to the pandemic, and the breadth of the post-shutdown rise in starts swamped the plunge that occurred during the shutdown. Actual sales of new homes rebounded a few months before the surge in starts, and it is clear that homebuilders’ rush to construction was initially a reaction to buoyant demand.
However, new-home sales began to pull back in September 2020, and by late-2021, before mortgage rates began to head higher, sales had already declined 35% from their August 2020 peak. On the way up in mid-2020, housing starts began rising just a month or two after sales did. However, as sales dropped steadily in 2021, builders were slow to react on the way down.
As a consequence, inventories of unsold new homes began to rise. By the end of 2021, inventories of unsold new homes had already risen to where they were nearly seven months’ worth of sales, compared to “normal” levels of four to five months’ worth of sales. Things have only grown worse this year, as rising mortgage rates and higher prices drove further declines in new-home sales and as builders remained slow to react. As of September, new-home inventories were at nine months’ worth of sales, a level exceeded only at the nadir of the housing collapse of 2006-2010.
In some ways, the current glut of unsold homes will weigh on builders even more than did the glut experienced in 2005-2007. The number of housing units under construction currently exceeds the highs seen in 2005, even though recent peak rates of new-home sales and starts have never been more than 75% of the 2005 peaks. The amount of multi-family units under construction is especially burdensome, as shown in Exhibit 4 (A).
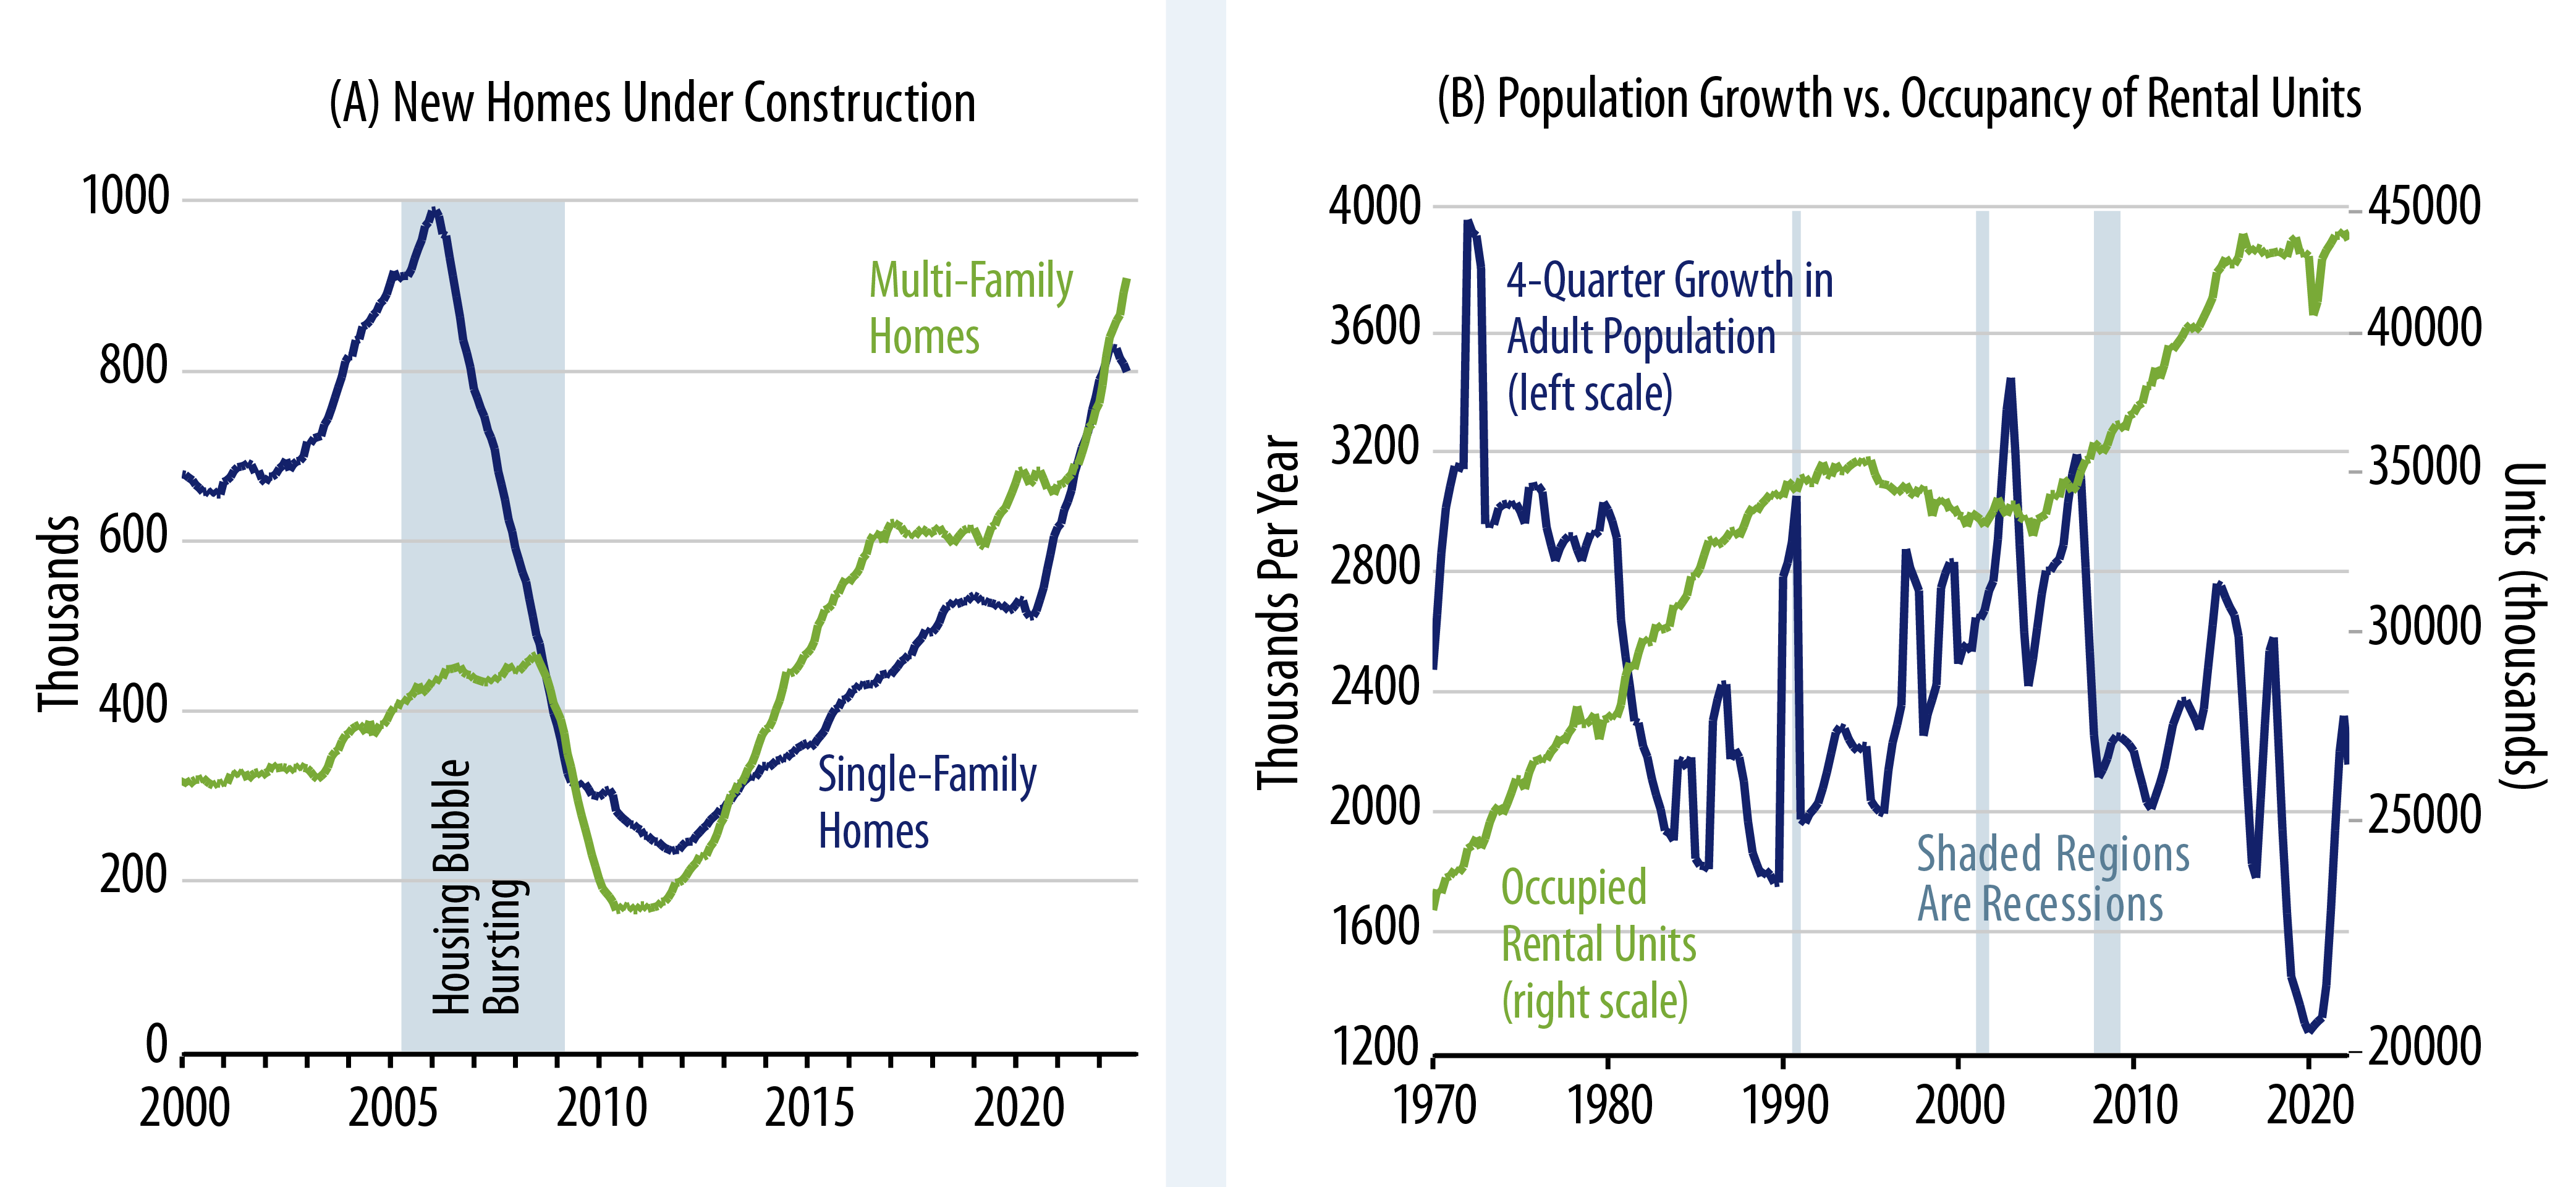
Growth in the adult population is sharply lower than was the case in 2005. According to Census Bureau estimates, there has been essentially no change in the number of occupied rental units for the last six years. Yet, there are twice as many rental units under construction now than there were in 2005. Reports are that builders are counting on single-family homes now under construction to be used in the buy-to-lease market. These homes will be competing with hundreds of thousands of to-be-completed multi-family units in coming months, in an environment, again, where household formation is especially low and growth in renter demand appears to be non-existent.
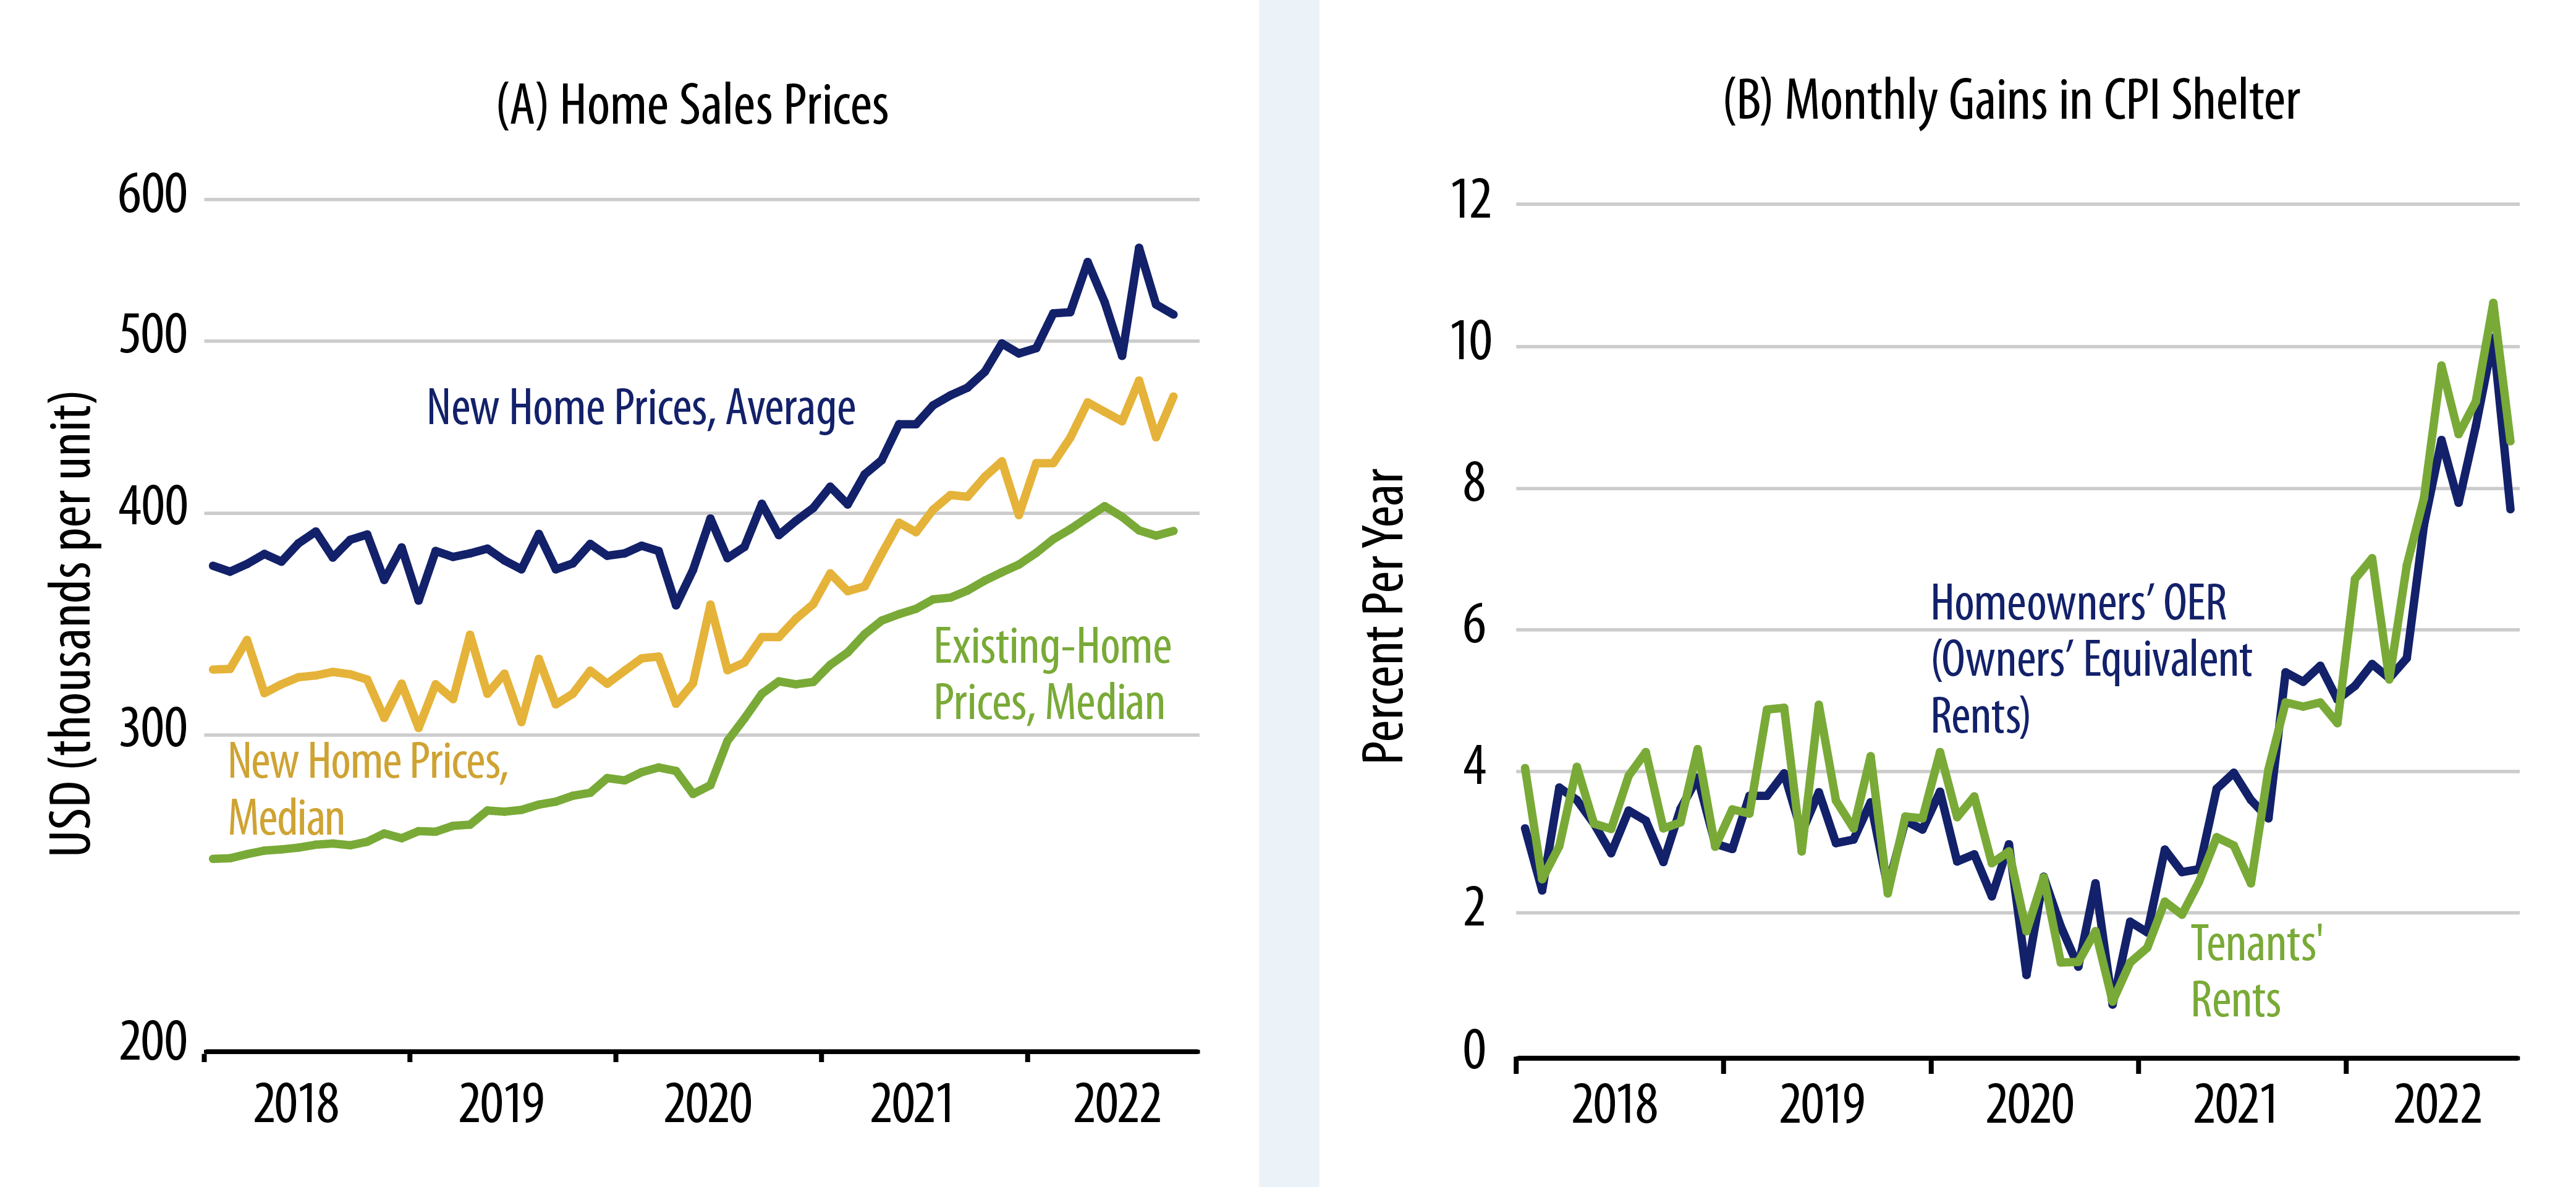
Granted, home prices and rents have risen dramatically in the last two years. Given the statistics rattled off here, it would seem that much or most of this price/rent run-up was a speculative bubble that was due to pop. Home prices have already begun to head lower (Exhibit 5 (A)). Reports are that rents for new tenants are heading lower, though renewal rents are still on the rise.
Some reports claim that home sales were declining in late-2020 and just after because builders were screening potential buyers. However, if that were the case, we wouldn’t have expected to see inventories of unsold new homes rising as they did. Why would builders be screening out buyers when they couldn’t sell homes as fast as they were building them?
More likely is that the surge in new-home purchases in mid-2020 was a wave of speculative buying anticipating a surge in household formation that never occurred. Just after the shutdown, a wave of city-dwellers fled to the exurbs to avoid congestion and big-city Covid restrictions. That would indeed swell demand for exurban homes, but it would reduce demand for in-city units. Yet, prices of both jumped.
Overall housing demand was tepid throughout the 2010s, and it is hard to see what fundamental improvement has occurred since then to boost underlying demand presently. Population growth has slowed further, US payroll job counts are still millions shy of the trends in place prior to Covid, and one-time stimulus checks cannot be used for down payments or monthly mortgage payments. As speculative demand fades into history and the robust supply response by homebuilders weighs on the markets, both home prices and rents will be under substantial downward pressure that could last for years.
The 2020-2021 housing bubble was not driven by overly expansive mortgage credit, nor have homeowners cashed out the equity gains driven by higher home prices. So, we are not due for waves of foreclosures and mortgage defaults such as were seen over 2006-2010. Instead, the effects of the current housing glut will likely be confined to GDP (lower homebuilding) and falling prices and rents, but those focused effects will be substantial.
As has been widely reported already, the technical lags in Labor Department data collection imply that falling home prices and rents will not be reflected in consumer price inflation numbers for many months to come. Yet, October Consumer Price Index (CPI) data did show some slowing in rent inflation. Even if the technical lags reassert themselves in near-term CPI prints, it is likely that both financial market pricing and Fed policy deliberations will react to “on-the-ground” home pricing news, precisely because the technical lags on the official CPI data are so widely recognized.
Services Inflation Still Raging
Once again, when goods inflation emerged in late-2021, our response was that this was temporary and would not spread to the rest of the economy. Contrary to that view, however, services inflation has flared up and come to dominate recent inflation prints. This has happened even while various service sectors remain substantially under-utilized relative to pre-Covid conditions.
Services inflation excluding rent of shelter and utilities has proceeded at a 7.1% rate so far in 2022, even when including the mild October print. These gains are spread across a number of sectors where reported price gains are in the mid-double-digit range, while a number of service sectors show only modest increases. For example, medical care services are up 5.7% overall, with a decomposition of a 3.4% rate of increase in health professional services, a 4.0% rate of increase for hospital services, and a whopping 20.3% rate of increase for health care insurance.
Our understanding is that the Bureau of Labor Statistics (BLS) measures health insurance service costs according to how much premia insurers retained as profits in the preceding year. With health care usage down last year, health insurers’ retained earnings were up, which resulted in a sharp increase in (imputed) health insurance costs for the 12 months through September 2022. (In effect, less services for the same premium means more costly insurance.) The opposite happened in recent months, and, indeed, health insurance shifted to a big negative effect (-4.0% non-annualized) on the October CPI. It seems set to have similar negative effects on the CPI in the months to come.
Transportation services inflation is running at a 17.6% rate so far this year, driven by a 12.7% rate of increase in vehicle maintenance and a 45.6% rate of increase in airfares. The airfare hikes are largely a reversal of airfare declines in 2020, but the vehicle maintenance cost increase is a net pick-up (no softness there in 2020, ironically, since household miles driven are still down substantially from pre-Covid norms). Elsewhere, veterinary services are up at an 11.1% rate and other personal services at a 5.9% rate.
Some of the biggest gainers in the service sectors look like artificial or technical increases, including, for example, the airfare and health insurance increases. However, other gains are clearly for real and are net increases, and some of the October moderation in services inflation can be attributed to technical factors as well. Wages have been rising strongly, and with service sectors still short of workers, real, non-technical pricing pressures may arise within services in the months ahead.
The case for slowing services revolves around the fact that real incomes have been on the decline over the last 10 months, the consequent deceleration in growth of real consumer spending on services, and, perhaps, the tightening actions the Fed has undergone in recent months. We are constructive on the chances for services inflation slowing in the months ahead, but any such progress will be a tug-of-war between the slowing factors mentioned here and the momentum arising from recent price increases and past wage increases.
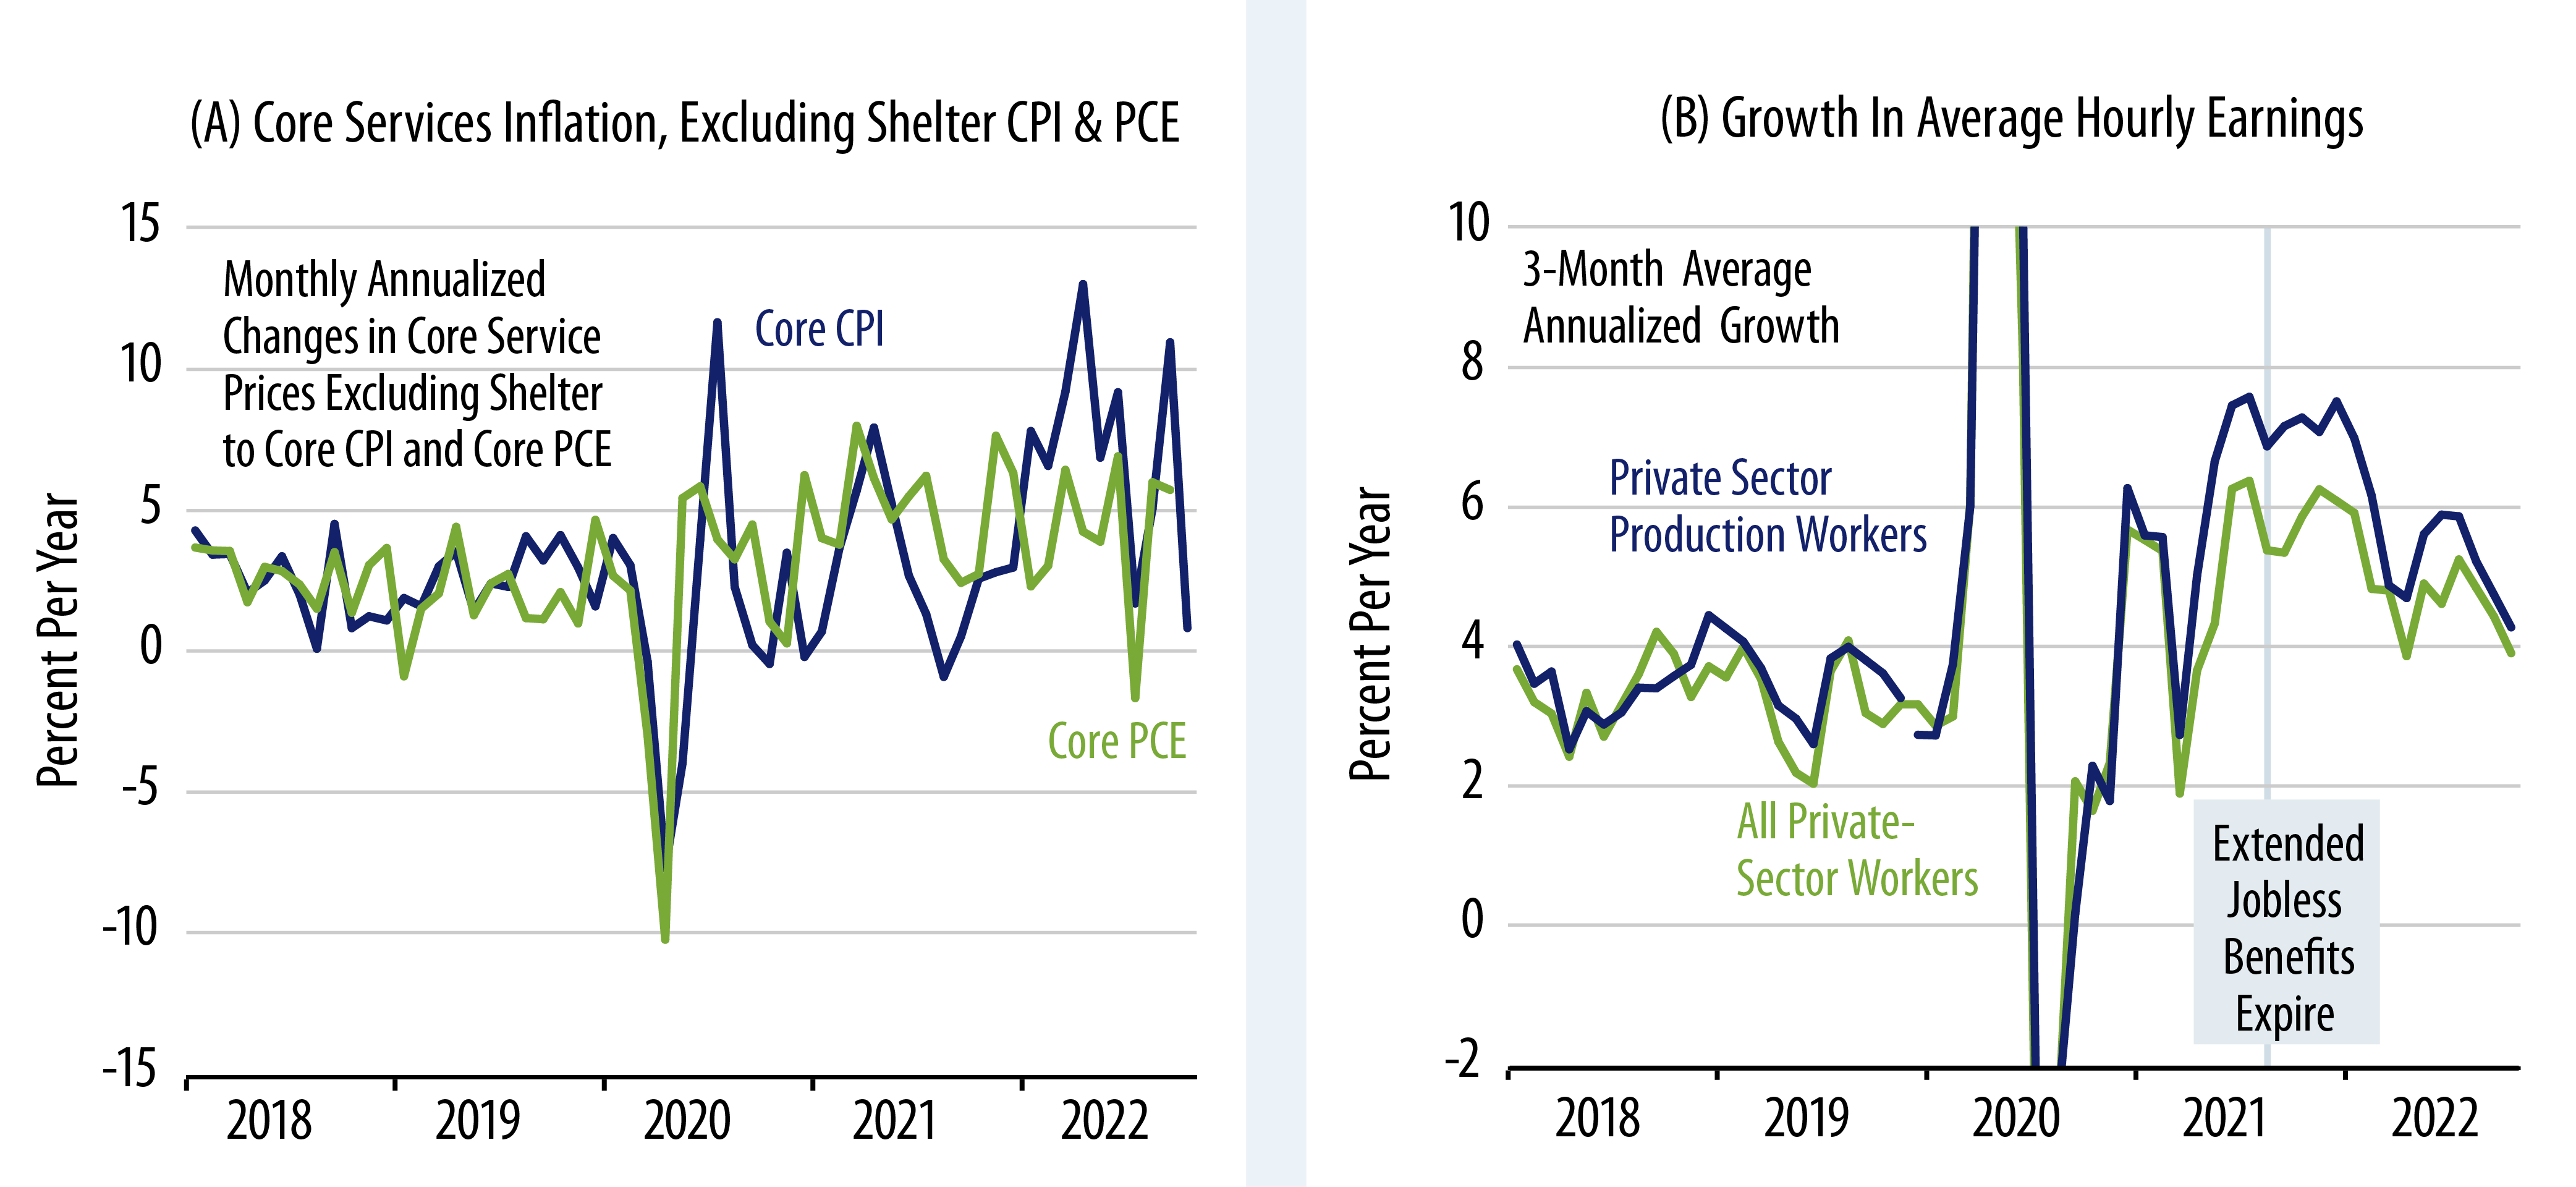
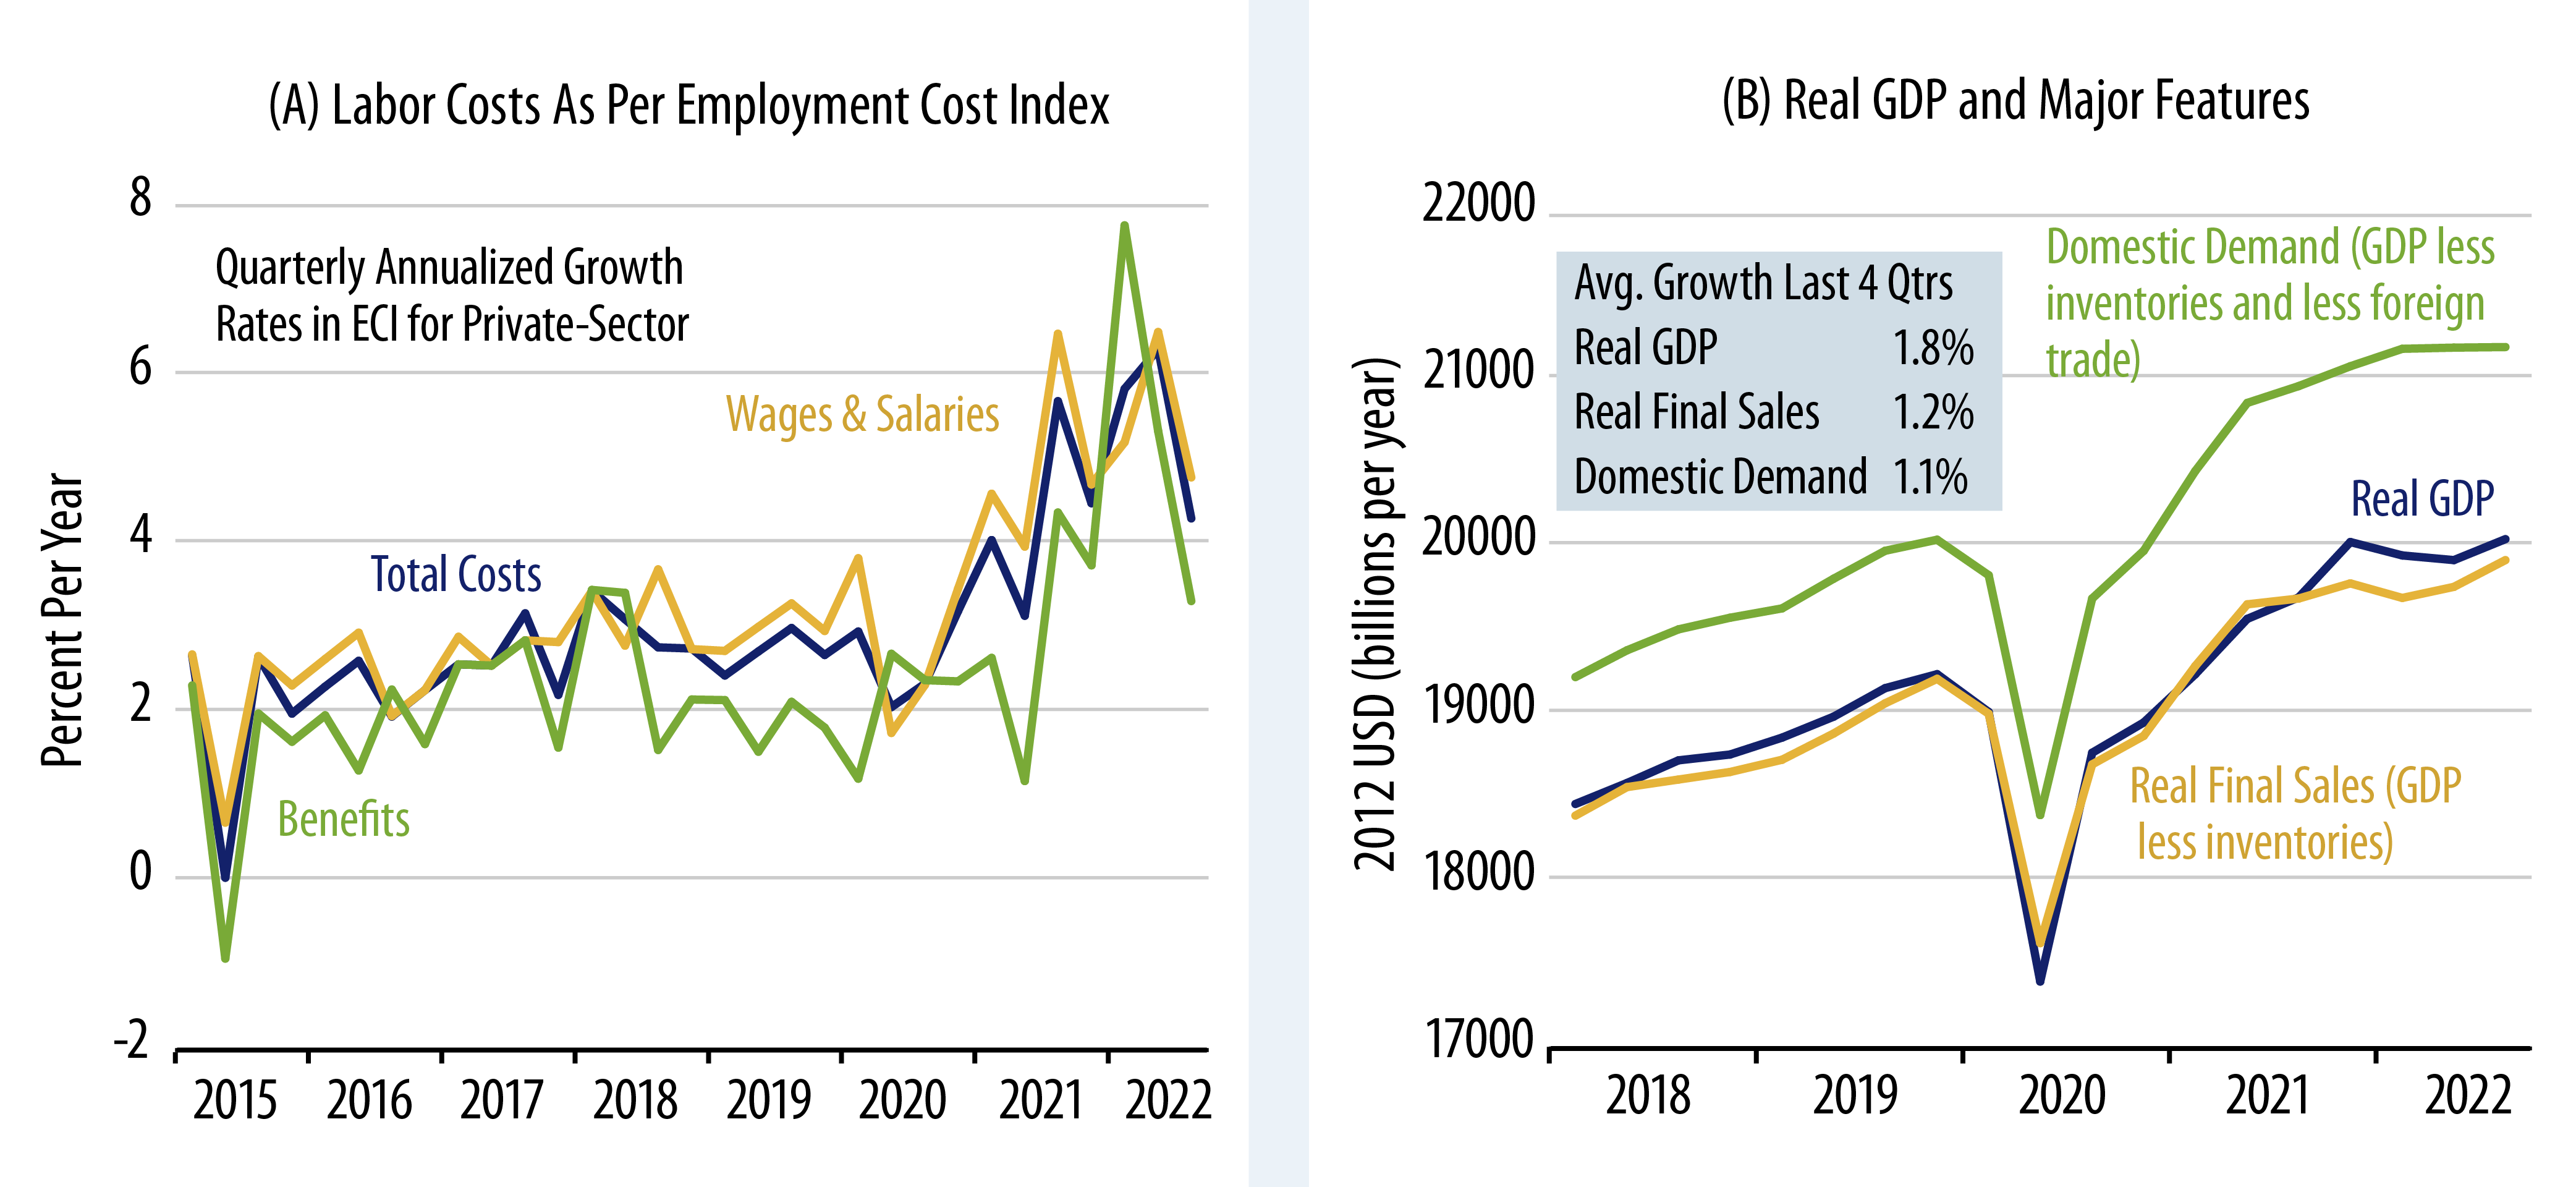
Then again, we mentioned wage inflation. Average hourly wage data included in the monthly payroll employment report have shown a reasonably steady deceleration throughout this year. Recently, the more reliable Employment Cost Index (ECI) data appear to have begun to reflect this slowing. Both measures show labor costs rising recently in the 4% to 5% range. This is not consistent with the Fed’s 2% inflation target, but neither is it consistent with recent service inflation rates above 7%, and it does mark a substantial deceleration from the rates of change seen six months to a year ago. So, even the current wage growth data point to some deceleration in services inflation in the near future. When and as signs of slowing job growth emerge, that would point to further slowing there.
Inflation Fundamentals: Demand, Supply and Fed Policy
During the Covid shutdown, the policy tools the Fed employed to boost the economy were exactly the ones it used to counter the housing bust and global financial crisis (GFC) of 2005-2009. Those policies failed to stimulate inflation—or even the economy—in the post-GFC expansion. We didn’t see why the same policies applied to the current economic dilemma would have any different effects. We did acknowledge that the supply side of the economy was constrained by (worldwide) government edicts in a way that was not the case during or after the GFC. However, we failed to foresee how those supply constraints—coupled with a decent recovery in demand—would drive a substantial increase in the aggregate price level.
Whether our primary error was misjudging the effects of Fed policy or failing to anticipate the effects of the supply constraint, the fact remains that inflation has run hotter and longer than we expected, and, in turn, interest rates and bond yields have climbed substantially. Where to from here? Whichever of these factors—or whichever combination of them—is responsible for inflation in 2021 and 2022, we think they all point to a similar reversal in 2023.
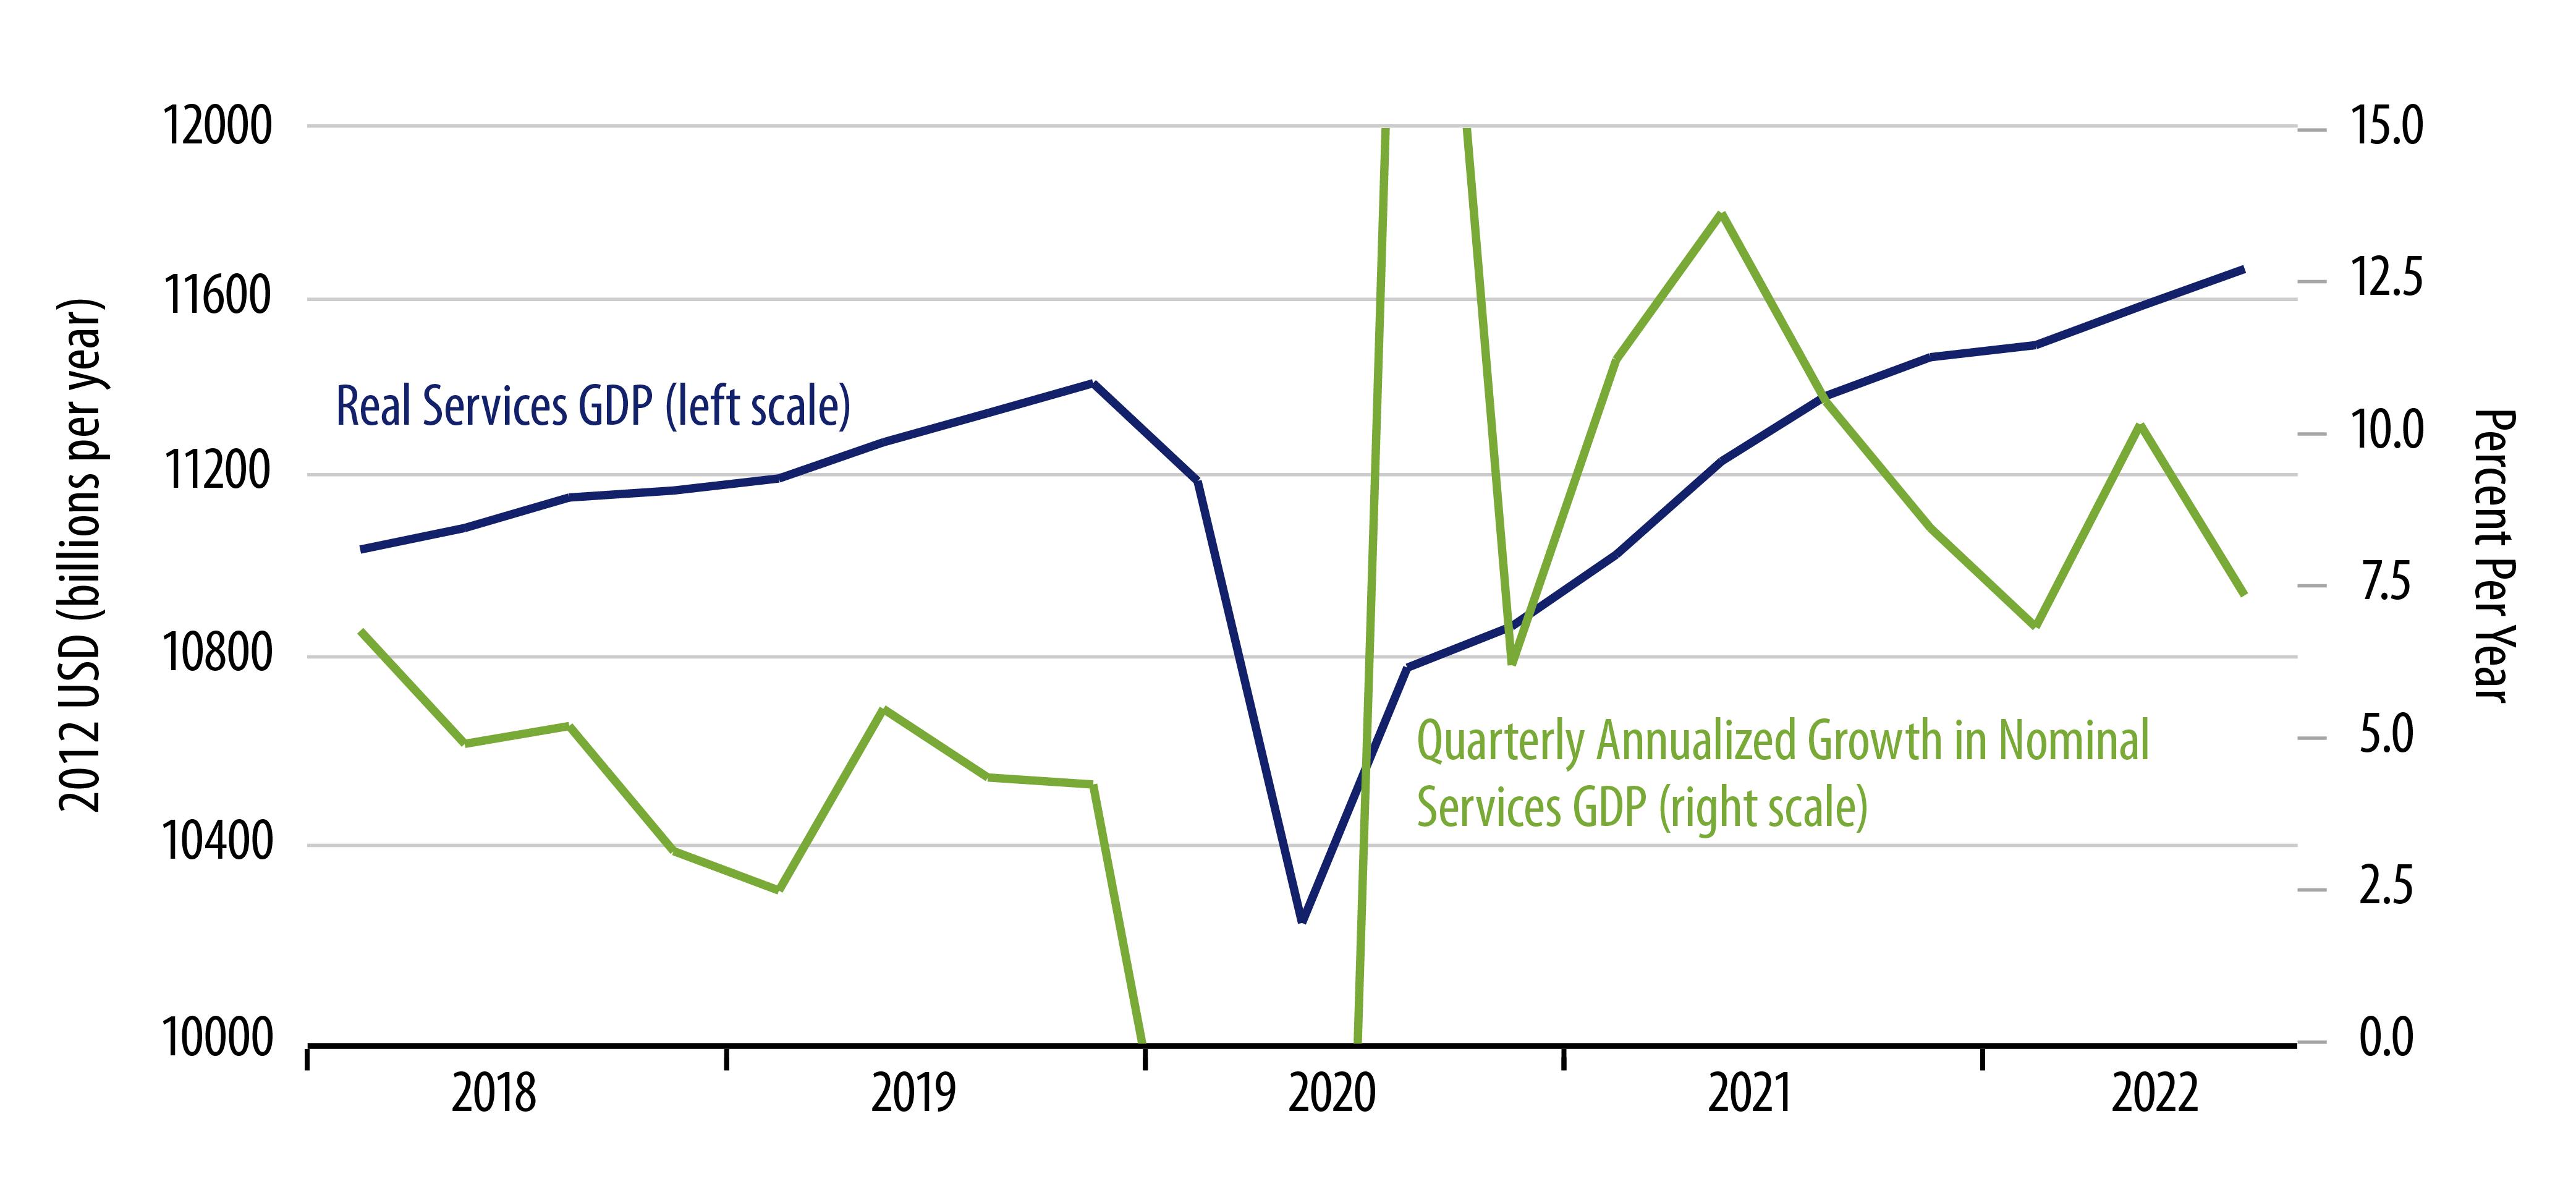
Concerning demand, at best, real aggregate demand fully recovered from shutdown declines and re-attained pre-Covid trends in mid-2021. It has since slowed below those preceding trends. Whether or not one thinks federal government stimulus programs actually stimulated or not, the vast bulk of those programs are long since expired. Real domestic demand grew at about a zero pace in 3Q22 and at only a 0.7% average pace for the year to date. What is more, growth in nominal domestic demand has decelerated steadily over the last year, growing at a 5% annualized rate in 3Q, just above the 4% +/- pace of the early 2010s that was consistent with 2% inflation then.
With the post-Covid recovery in real demand and real GDP fair-to-middling at best, it is hard to get any understanding of the current inflation picture without acknowledging that supply constraints are part of the story. Here, too, some relief is on the way. As already stated, homebuilding has swung sharply from boom to glut. For the goods sectors, current supplies of merchandise may be excessive, judging by merchants’ efforts to cut inventories and an accompanying plunge in global shipping fees.
As discussed in the previous section, any remaining supply problems are in services. There, most service sectors are still under-utilized in the wake of the Covid shutdown. The supply problems arise from staffing levels being even more constrained. The question is how much supply or growth in supply will be needed with aggregate demand growing slowly as it is.
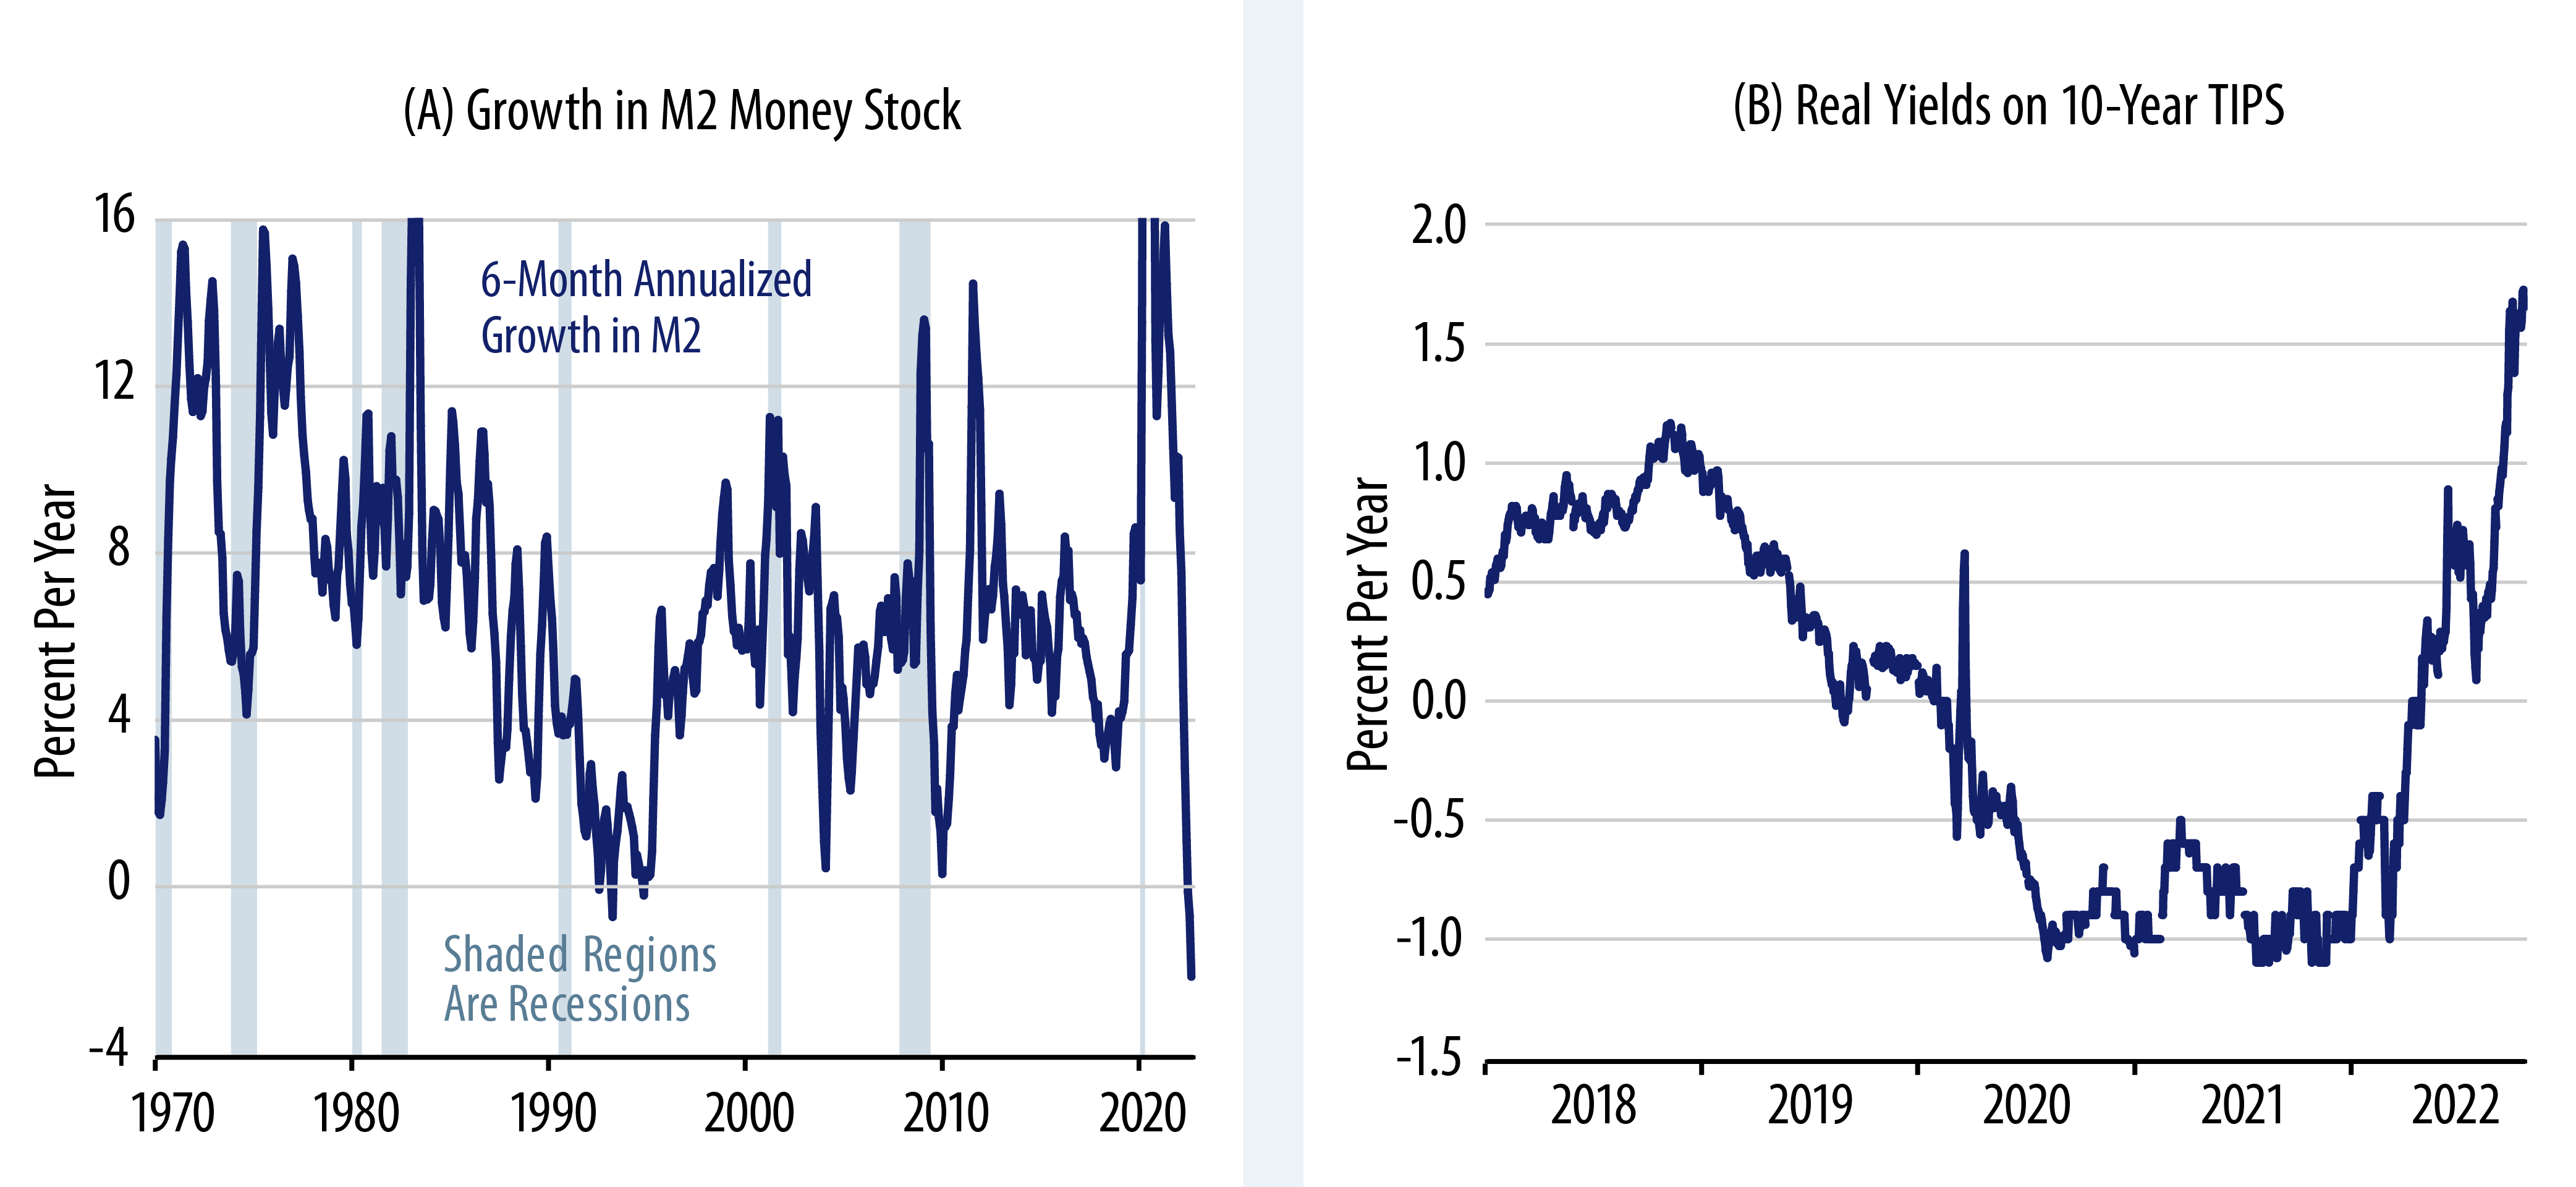
Which gets us to monetary policy. Some analysts touted (decried) the 20%+ growth in the M2 money stock as an excess that would generate inflation. We thought that growth came exclusively from households saving away stimulus checks, savings that are still largely unspent. Regardless of the causes and effects of the 2020-2021 M2 growth, the fact is that it has been reversed dramatically. M2 growth has plunged to zero for 2022 to date. In fact, the -2% rate of decline for the last six months is the weakest performance in the 64-year history of this aggregate (Exhibit 9 (A)).
When monetary economists talk about central bank policy working with “a long and variable lag,” the empirical evidence behind that is that it takes about two years for a (meaningful) swing in money growth to be fully reflected in the inflation rate. However, there is some effect of the money swing on inflation prior to then, and, indeed, the effects on nominal GDP growth are typically complete within a year. In other words, in the face of zero money growth over the past nine months, it is reasonable to expect that by early-2023, nominal GDP growth will have decelerated sharply further, imposing substantial downward pressure on inflation (via a weak real economy).
If you are more inclined to judge Fed policy by looking at interest rates, the conclusion is the same. Whether rates are high or low does not matter for near-term economic growth as much as whether rates are rising or falling. Already in 2022, rates on 10-year T-Notes have risen by 270 basis points (bps). Now, rising rates alone in the late-1960s failed to slow inflation or the economy, but that was because inflation expectations were rising faster than nominal yields, so that real yields were flat or falling until the mid-1970s.
Presently, we can analyze real yields on Treasury inflation-protected securities (TIPS), an instrument not available in the 1960s or 1970s. So far this year, real yields on TIPS have risen the same 270 bps as have nominal yields. Furthermore, credit spreads on long-term investment-grade issues have risen by 55 bps. So, the real yields paid by actual real private-sector borrowers are up on the order of 325 bps in a mere nine months.
Whether or not yields were too low last year, they had held at those levels for a number of years, so that it was reasonable to believe that the economy had fully adjusted to those rate levels. Now, yields are sharply higher than they were a year ago, and the economy is going to have to adjust to this change. This augurs for substantial restraint on private spending in the months to come.
Conclusion
Inflation has proceeded faster for longer than we anticipated, and the damage to fixed-income investments has been commensurate. However, we are not ready to give up on a falling-inflation scenario that can provide some comfort and respite to bond investors. Whether you focus on demand and supply as the driver of prices, or whether you focus on interest rates or the money stock as a measure of Fed policy, all these indicators point to a substantial moderation of inflation in the near future. Furthermore, looking at economic conditions “on the ground,” pricing in the goods and structures sectors is already moderating. Services prices could and should moderate in the not-too-distant future.