


KEY TAKEAWAYS
- Analyzing climate risk in a financial context is no easy task; there is no methodology similar to traditional risk analysis for measuring climate risk.
- We employ scenario analysis to analyze the impact of climate risk to fixed-income credit portfolios.
- The move toward a low-carbon economy generates a transition risk for the financial system, and therefore will have an impact on corporate bond issues.
- We use five potential pathways for carbon prices, according to five different scenarios for increases in global temperature, defined in the 2018 edition of the Summary for Policymakers, published by the IPCC.
- Results of stress tests show how the more ambitious the end-of-the-century temperature target, the higher the P&L impact; the estimated impact is more severe as the credit quality of the index decreases.
The Challenge: Integrating Climate Science with Financial Risk Assessment
While the fundamental tenets of Modern Portfolio Theory (MPT) with their focus on risk and return have been the fundamental ground on which most investments are made, the systemic risks posed by climate change1 are equally pressing and merit rigorous analysis.
While traditional risk analysis can make use of metrics such as volatility, tracking error, value-at-risk and others, usually estimated on the basis of past information, there is no similar methodology for measuring climate risk for investment portfolios. Forming the base of our assessment are metrics such as greenhouse gas (GHG) emission and weighted average carbon intensity (WACI)—to name a couple—and their impact on future temperature pathways and anomalies. We begin our assessment by acknowledging that future temperature pathways, by their very nature, are based on predictions and can vary depending on corporate decisions, country-specific action plans, geopolitical events, and regulatory and policy imperatives.
Scenarios linking future carbon prices to temperature rises display a wide range of dispersion. The “disagreement” across models for carbon price estimate that limit temperature rise by the end of the century suggests that there is no real consensus among climate science models, or at least that these models may not be as clear as the kinds of risk models investors are typically familiar with. There is not only uncertainty across models, but also model misspecification associated with potential flaws of some climate risk models’ approximations; this issue is not exclusive to climate science, but still foreign to most investors who need to select an appropriate model for risk management.
The Third Annual Survey of Climate Related Risk Management of Financial Firms, published in 2021 by the Global Association of Risk Professionals, notes that only 6% of firms surveyed think that climate risk is correctly priced. Maybe the risks to the environment and future generations that we discuss nowadays seem to be too distant compared to the more “near-term” risks considered in portfolio construction and risk management. Future risks are important, but so is current performance.
We believe that a good carbon price path should be one whereby companies have both the incentive to produce and distribute under new energy efficient technologies and capture carbon from the environment. If future carbon prices are set right, the socioeconomic implications of climate change may be lessened. While some companies claim to need time for new technologies to surface and become cost effective and for society to adapt to them, even absent socioeconomic, geopolitical and sheer survival impacts of continued fossil fuel use, it must be acknowledged that fossil fuels are finite resources, and, as depletion occurs, extraction costs increase, thereby creating a natural incentive to diminish reliance on fossil fuels.
While the financial industry is still at a nascent stage in terms of measuring climate risk, at least compared with its use of traditional risk metrics, this is not a reason for ignoring the challenges posed by climate risks—indeed, quite the opposite.
As regulatory and policy imperatives such as actions by central banks, changing consumer preferences, geopolitical challenges to sourcing energy and volatility of a limited resource such as fossil fuels become increasingly tangible, companies that are best-suited to adapt are best placed to mitigate the myriad of risks posed by climate change, including technological transitions intended to help humans adapt to new energy sources. Having an edge on approaches to mitigate climate risk helps to be ahead of others and anticipate future downsides.
Our Approach: Scenario Analysis
Carbon taxes are not yet truly effective in most places, so the past does not really include useful financial information about the future effects of climate change and/or the socioeconomic and geopolitical implications of higher temperatures. We employ scenario analysis, despite its limitations, to analyze the impact of climate risk to portfolios. The basis for our financial scenarios is the United Nations Intergovernmental Panel on Climate Change (IPCC)2 scenarios of future carbon prices. These scenarios are based on reference socioeconomic trajectories developed by the scientific community in order to create a common framework for thinking about the issues related to climate change.
In reality, incorporating climate change impacts into investment analysis is a dynamic problem in nature. Investors learn and change strategies as information and scenarios unfold over time. A good economic model incorporates a spectrum of future possible decisions in any given current decision-making process. Given the levels of uncertainty that climate risk brings to the discussion, constructing a fully dynamic approach to address climate change risk is out of scope at this time. We have to work with approximations; hence, our model assumes that portfolios remain unchanged over the investment horizon we’re considering. In other words, the future is collapsed into present value terms without any intermediate portfolio rebalancing. The interplay between society’s actions and future temperatures is not explicitly considered in our model, and we are aware that climate change is endogenous. We use the IPCC scenarios for carbon prices as of year 2030, given that uncertainties tend to increase as the horizon of the analysis extends into the future. For simplicity, we use the median prices of the IPCC scenarios in 2030, given the wide level of dispersion in the estimates of the different analyses. Since, with some exceptions, the current price of carbon in most parts of the world is low, and the need to contain emissions requires sharp increases in carbon prices in the future, we see our analysis as a stress test of portfolios. Scenario analysis can also be used for central hypothetical cases, but we feel that the scenarios we’re modeling are on the extreme (not the middle) part of the spectrum of impacts on corporate bonds.
Stress Test Example: Fixed-Income Credit Indices
In this paper, we focus solely on fixed-income credit portfolios. Extensions of our model will be described in future publications. As indirect carbon taxes are imposed on companies over time, production of goods and services is impacted, earnings are impacted and valuations change. If new technologies that alleviate the tax burden of emissions do not surface in time, some companies, likely most, will suffer, especially in the near-term. Others, perhaps the most (carbon) efficient and innovative, might actually benefit from the burden of carbon taxes to competitors, gain market share and perhaps even thrive. All these issues may impact credit spreads, and impact the likelihood that a company defaults or is downgraded (or vice-versa for those companies that thrive).
At Western Asset, we use our internally developed Credit Default Model (CDM), a module of our proprietary risk model, WISER (Western Information System for Estimating Risk), to assess the impact that the additional burden of higher carbon taxes creates for issuers. We also assess the potential instantaneous return impact to portfolios as companies’ valuations are impacted by a carbon tax and their credit spreads respond accordingly. It is difficult to envision a scenario where society adapts to higher carbon taxes that, in the near term, does not create a negative impact to most companies. Credit-spread narrowing and potential upgrades are hard to imagine over the few years after implementation of higher carbon prices. Different companies in different sectors, operating in different regions, are impacted differently in our model.
Our basic working assumption is that the move toward a low-carbon economy generates a transition risk for the financial system, and therefore will have an impact on corporate issuers. This analysis takes a bottom-up approach of the impact of future carbon prices on valuations and the financial health of companies. Higher carbon prices directly impact the profitability of companies by increasing their production and distribution costs, among other effects. This impact reduces a company’s value and affects the estimated probability of default of its issues, its credit rating and its borrowing costs.
Our scenario analysis uses information of Scope 1 and Scope 2 carbon emissions of companies. Future carbon prices from the IPCC scenarios are compared to current carbon prices to assess the potential marginal costs from emissions to corporate bond issuers. Western Asset’s WISER, through its CDM, uses a Merton3 style framework for assessing the likelihood of a default given additional carbon cost using options pricing insights. Our model estimates the likelihood that a borrower’s liabilities go above its assets, due to the additional expense created by carbon taxes, and uses that information to infer the newly predicted default likelihood of that issuer.
Decarbonization might be able to keep climate change in check. Countries can tax emissions, and/or create emissions trading mechanisms, and slowly steer their economies away from carbon by inducing companies to reduce emissions or generate new carbon efficient technologies. We attempted to include many kinds of differentiation among issuers in our model. There are many factors that drive carbon prices at the regional, industrial sector and company specific levels. Transport, industry, building and forestry are among the highest emitters. The timing and nature of the carbon tax policy, the removal of fossil fuel subsidies, regulatory aspects and availability of pollution trading schemes might also impact companies, but these are not explicitly considered in our model. We are using carbon prices as a proxy for the societal cost of investment, technological, and behavioral changes, subsidies, and other costs related to the large transition effort required, so our carbon prices should be viewed as effective ones. Transitioning to a lower-carbon economy may entail extensive policy, legal, technology, and market changes to address mitigation and adaptation requirements related to climate change. Depending on the nature, speed and focus of these changes, transition risks may pose varying levels of financial and reputational risk to organizations.
We use five potential pathways for carbon prices, according to five different scenarios for increases in global temperature, defined in the 2018 edition of the Summary for Policymakers, published by the IPCC. These scenarios are consistent with the commonly used Representative Concentration Pathway (RCP), and describe the evolution of all emissions to the end of the 21st century from all energy sources, regions and sectors. A graphical representation of the five scenarios used as the basis of our analysis is depicted in the IPCC graph in Exhibit 1, and we encourage readers to review the IPCC document for a detailed description of these scenarios.
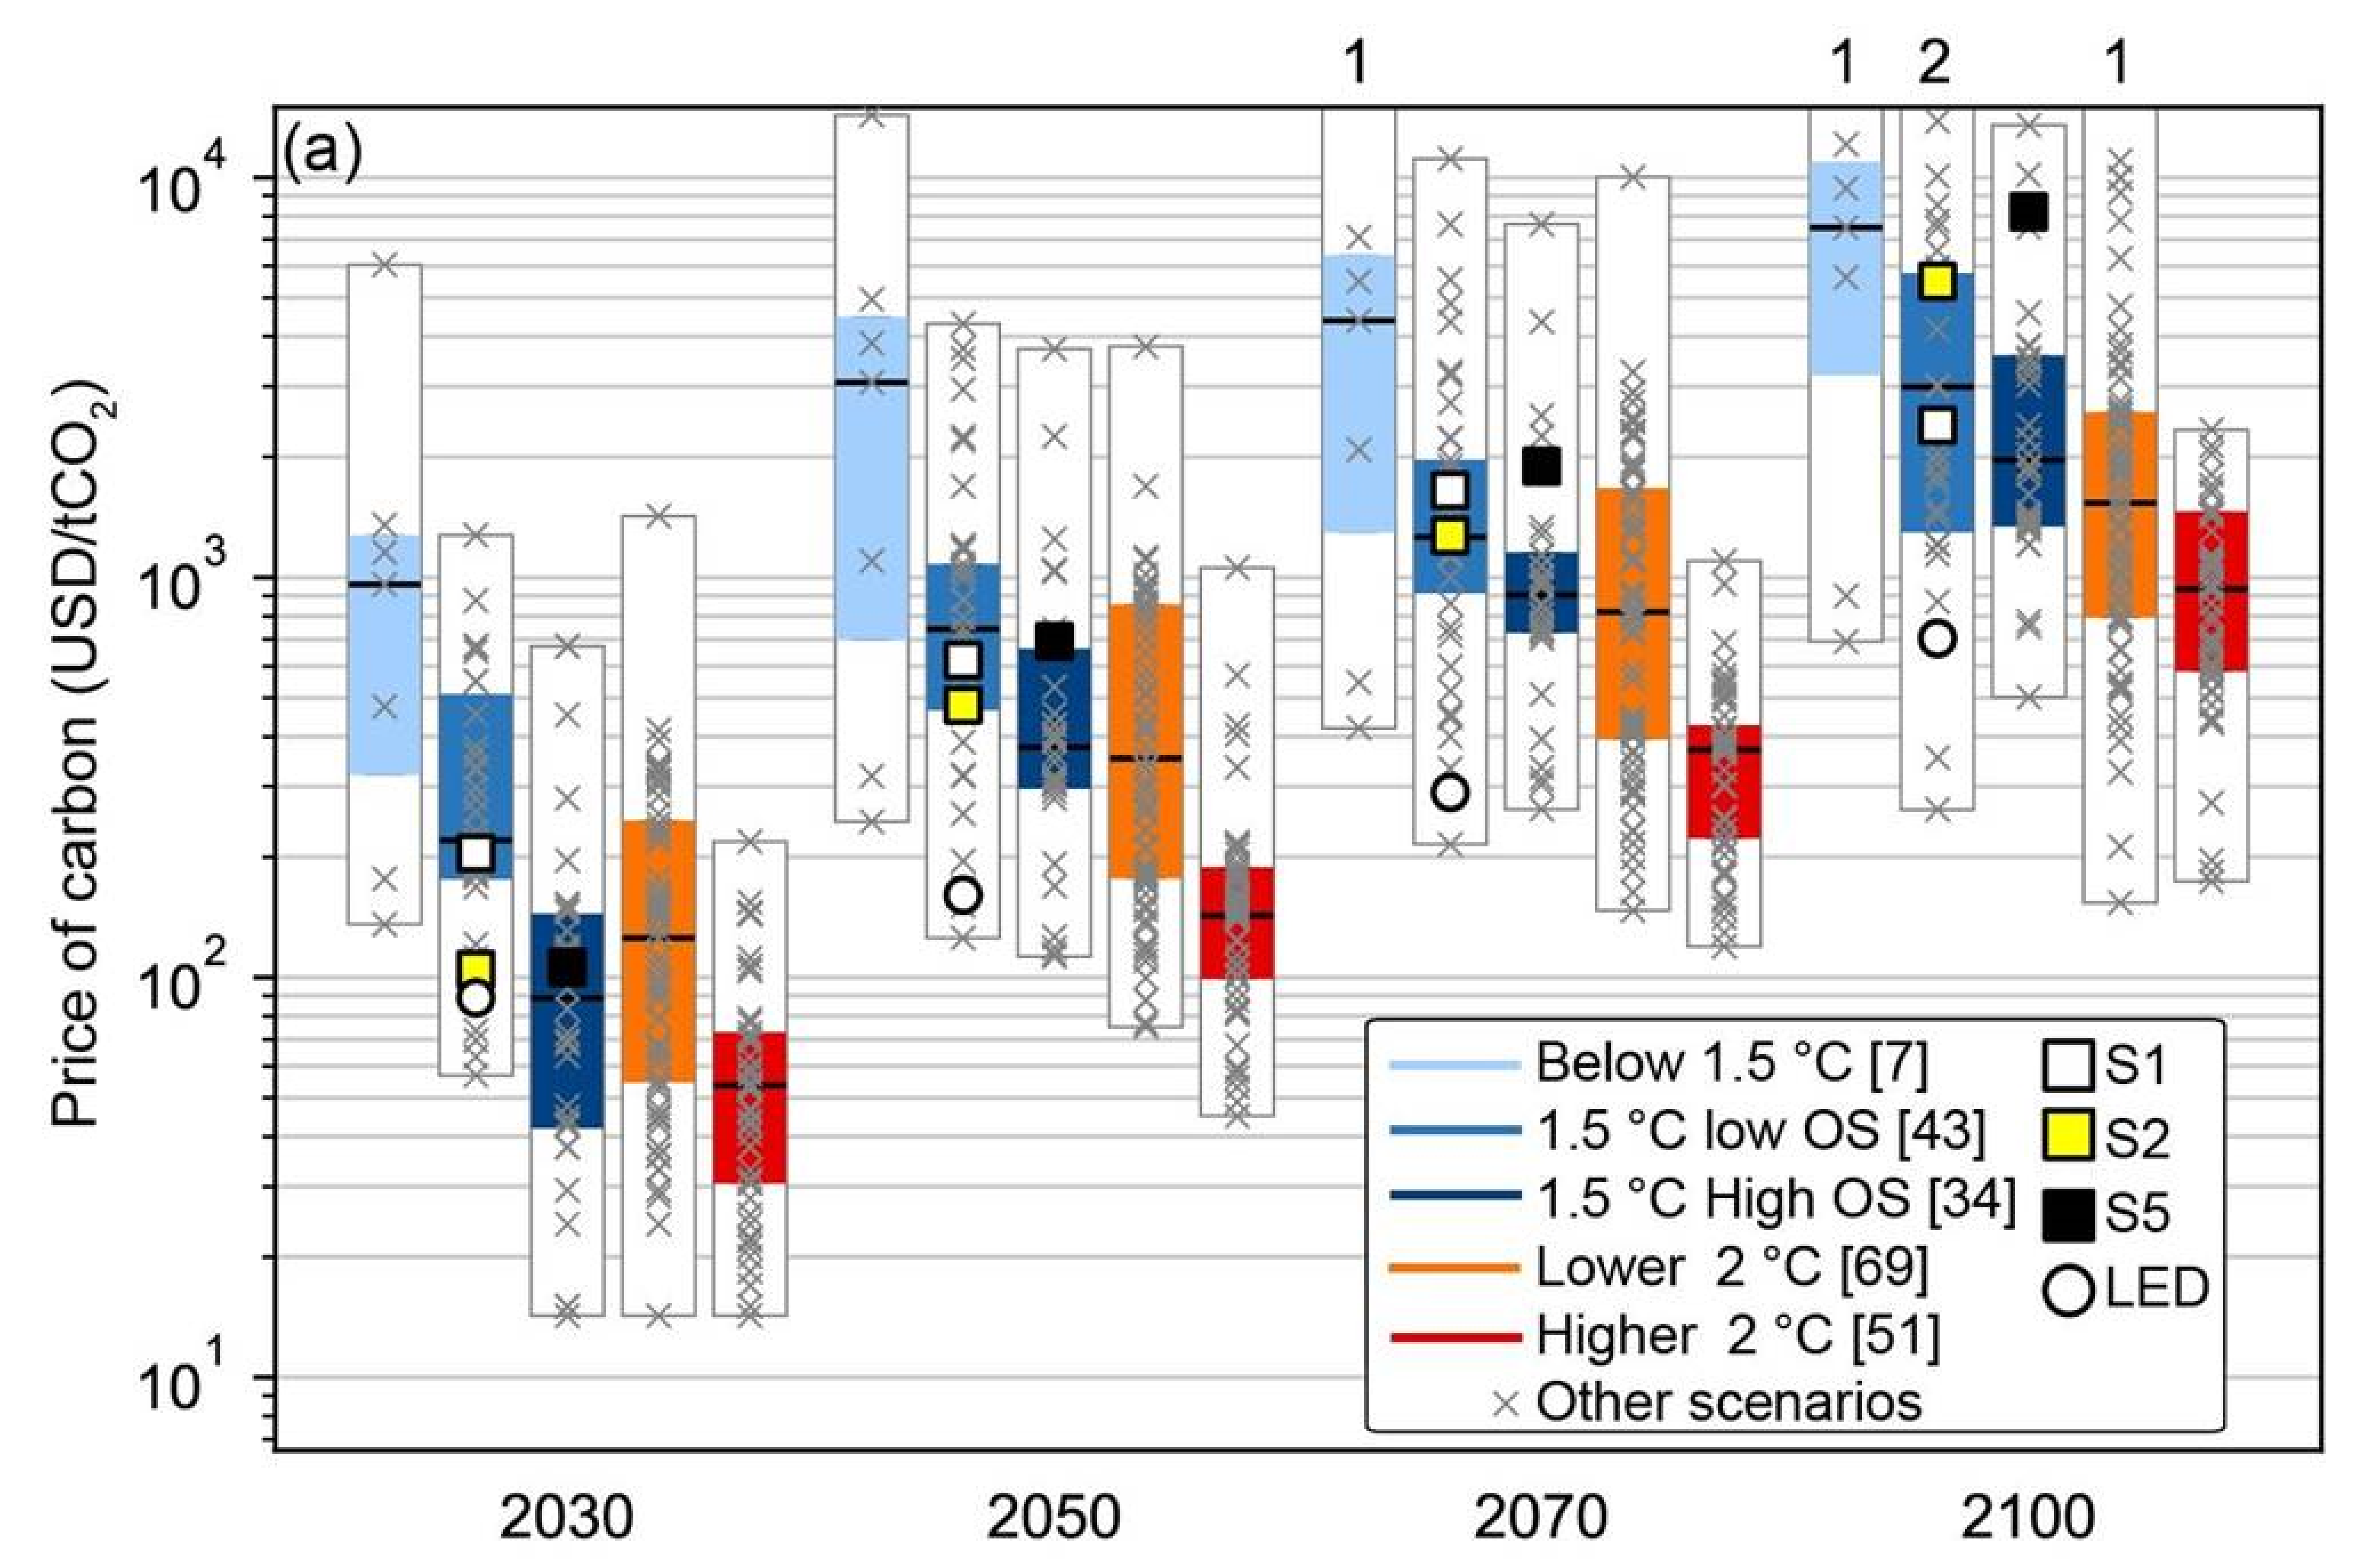
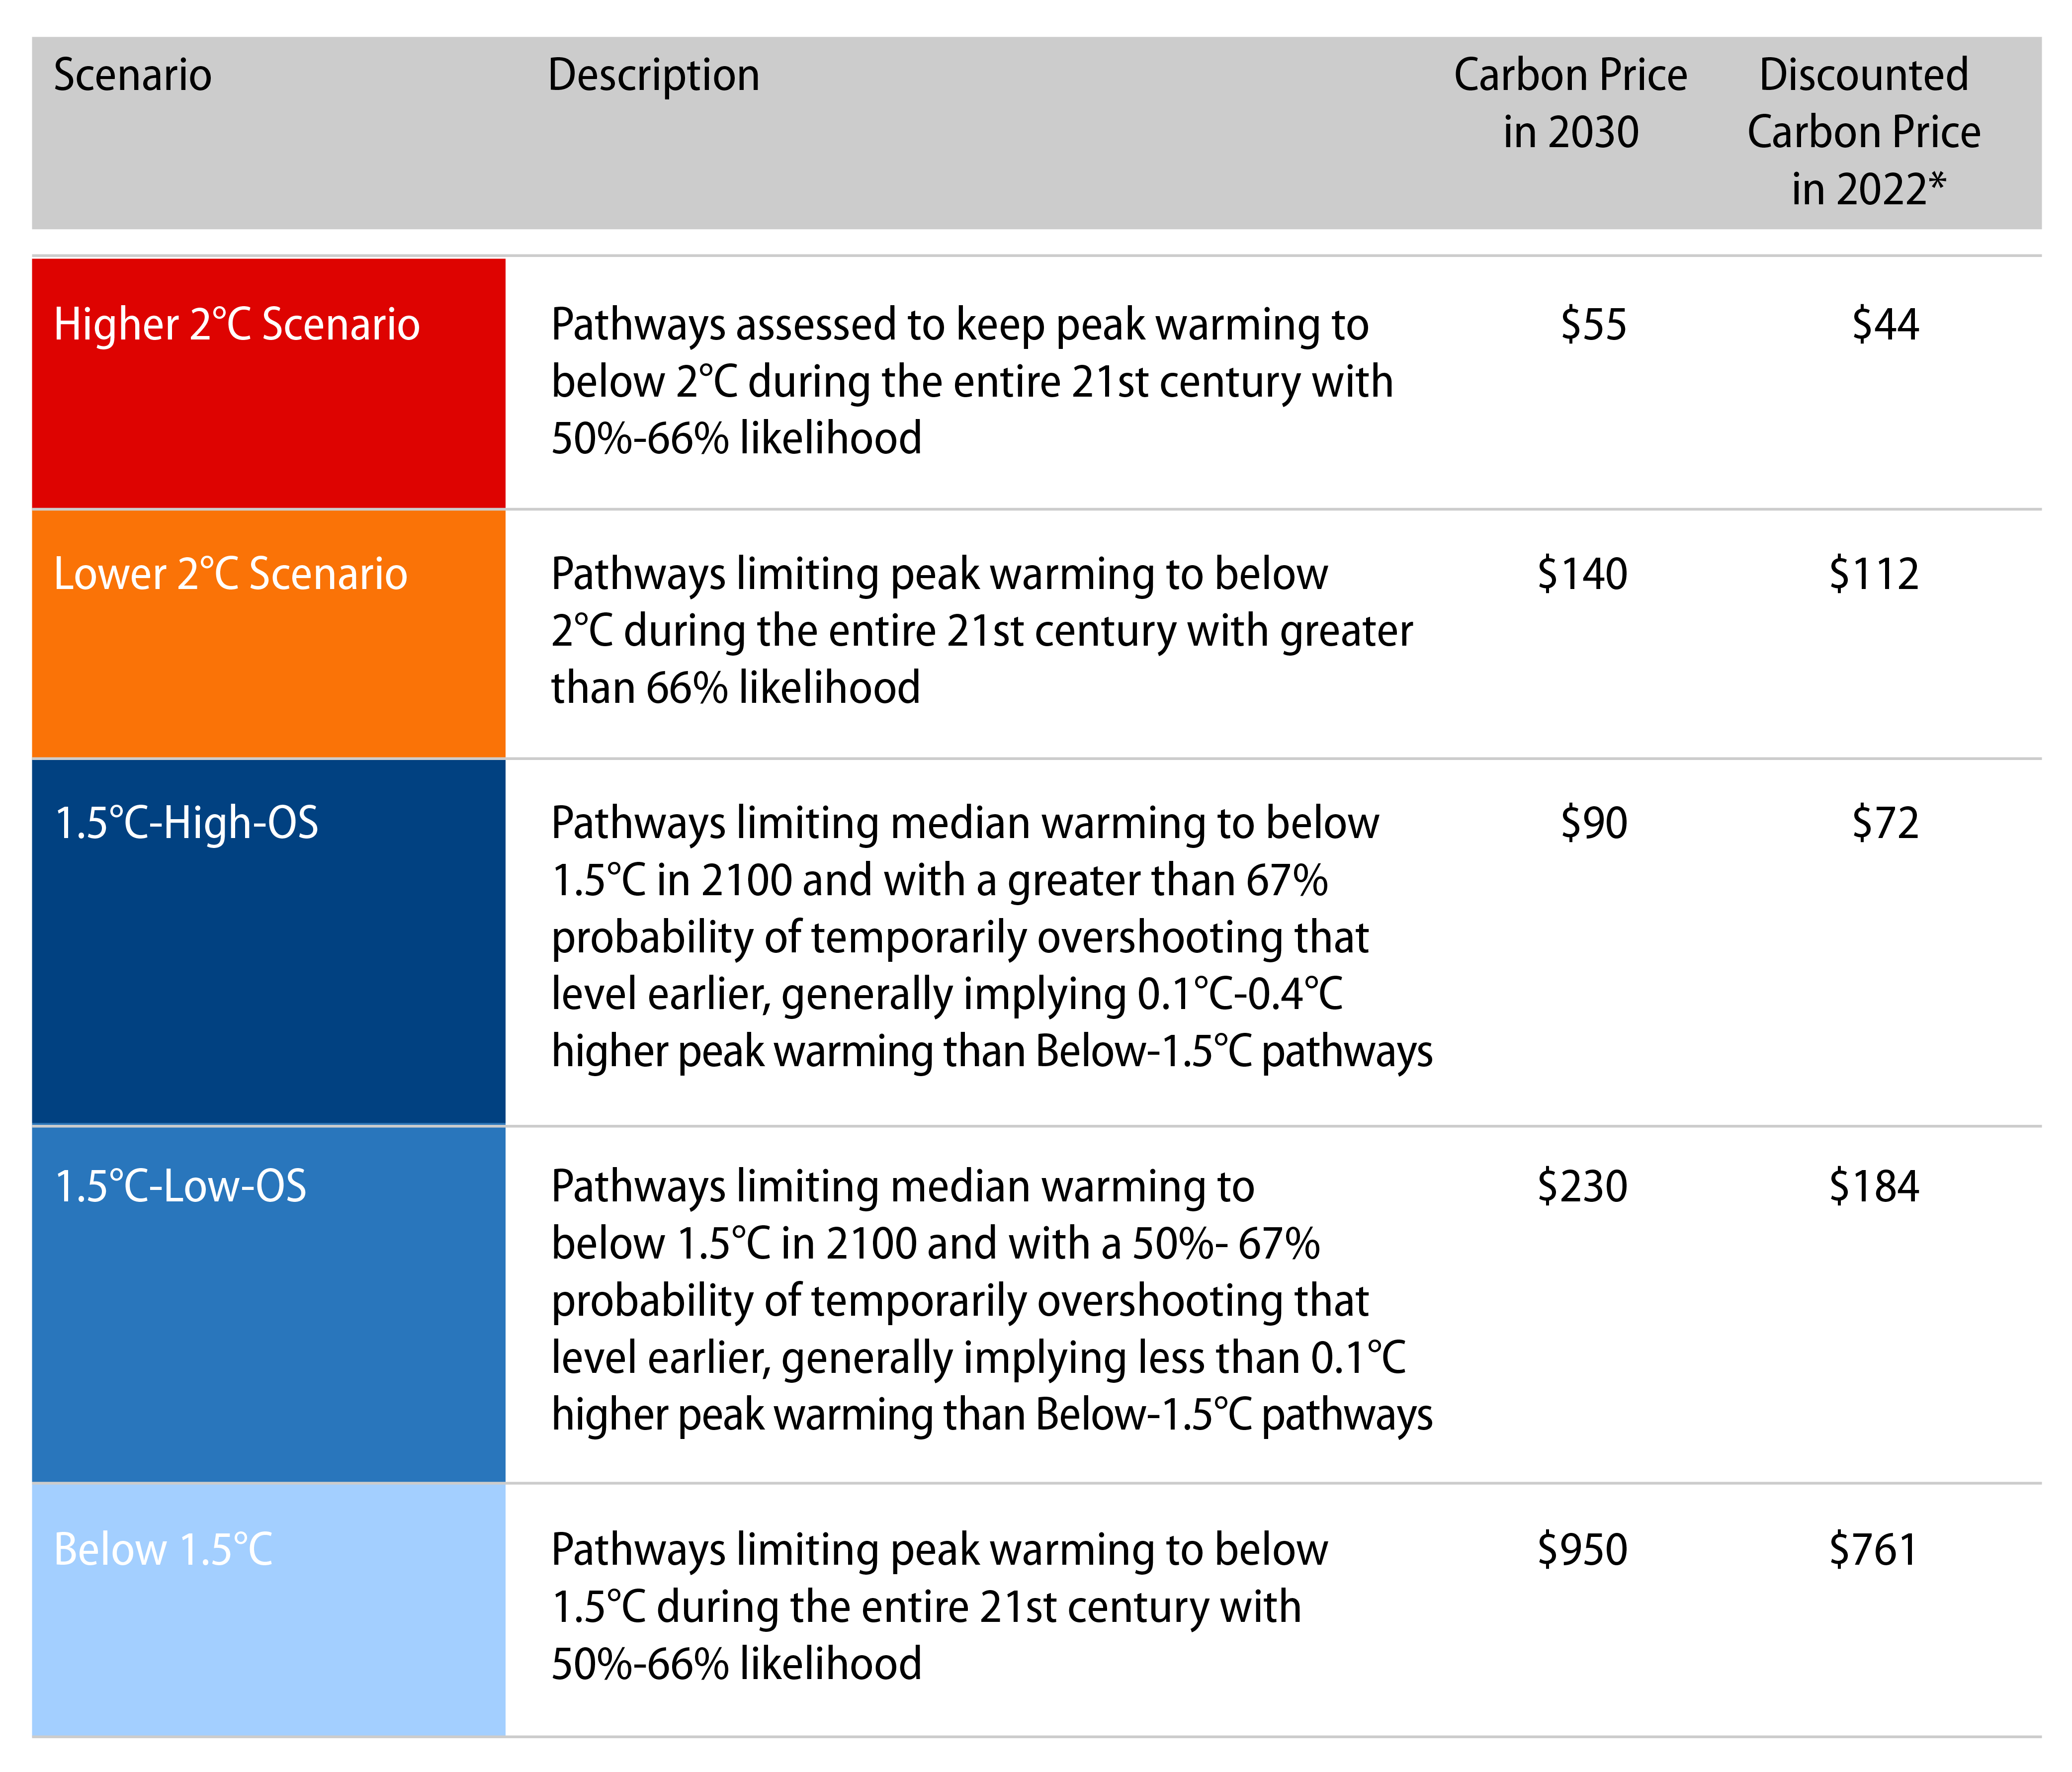
In order to analyze the potential impact of carbon prices in 2030 in today’s US dollars, we bring carbon prices to present value by discounting them at an assumed annual inflation rate of 2.5%. Exhibit 2 contains a brief description of the meaning of each IPCC scenario based on the median carbon prices in 2030 and the estimated future carbon prices at the end of January 2022 in US dollars.
We shock the current carbon price to the present value of scenario future carbon prices and assess the impact on the EBITDA4 of issuers today according to the tax burden on current emissions under each scenario. Future carbon taxes are assumed to apply universally, and depending on where each company operates, and the current carbon price scheme effective in that location (sometimes none, or even negative if fossil fuel subsidies are in place), shocks can be of different magnitudes. An estimated default probability for a corporate bond and ultimately for a credit fixed-income portfolio (aggregated by the weight of each corporate bond) is calculated, and an implied current rating for the portfolio is assigned on the basis of a historical default table. If the estimated rating is lower than the current rating, then a potential for a downgrade in the overall credit rating of the portfolio is a risk. Under our stress-testing framework, we can perform the analysis for portfolios, benchmarks and also in active terms.
In order to estimate the impact of the carbon price shocks on the value of each bond, each firm value is shocked under the assumption that the ratio between enterprise value and EBITDA remains constant. So, a negative 10% impact from taxed emissions on EBITDA is translated into a 10% decline in the stock price of the company, for example. Other formulations that associate the enterprise value changes to EBITDA shocks might be possible as well, especially in a dynamic framework, but we chose this one for simplicity. Then, a sensitivity of option-adjusted credit spreads changes to large stock price changes is estimated and a corporate bond price shock is derived by multiplying the change in its option-adjusted spread (sensitivity times stock price change) by its spread duration.
Not all companies will absorb a tax on their emissions in the same way. Companies with fixed assets that are less able to shift operations as conditions change may suffer in the future. Some companies have a dominant role in their sectors, so they might have pricing power to pass a portion of carbon tax costs to their customers. Also, if a company is already advanced in terms of their environmental scores5 compared to peers in the same sector or is already making progress on its emissions reduction path, it might have better chances to adapt6,7,8. We created z-scores for each of these different company-specific attributes and reward or penalize those companies that:
- Are/are not leaders in their segments,
- Score/do not score well relative to its peers in terms of environmental issues,
- Do/do not display a good trend in emissions.
As part of our risk management program, Western Asset already calculates default probabilities for each issuer in portfolios, and estimates their impacts on tracking errors, volatilities, value-at-risk and expected shortfalls. The additional impact of climate risk to issuers is expressed as an added (adjusted, as per z-scores) impact to EBITDA due to carbon price shocks, and its consequence to default probabilities and option-adjusted spreads. We assume that shocks occur once and instantly, a feature of the static framework.
This analysis encompasses companies with published carbon data and for companies that do not report carbon emissions metrics, we use sector averages as proxies. Publicly traded securities also not covered in this current analysis besides sovereigns are US Treasuries (USTs), mortgages, asset-backed securities (ABS), companies that do not have publicly available financial statements, and companies that do not report EBITDA.
We applied the described methodology to three different credit indices: Bloomberg Global Aggregate Credit Index USD Hedged, Bloomberg US Credit High Yield 2% Issuer Capped Bond Index and Bloomberg US Credit Index. Exhibits 3 and 4 summarize the results.
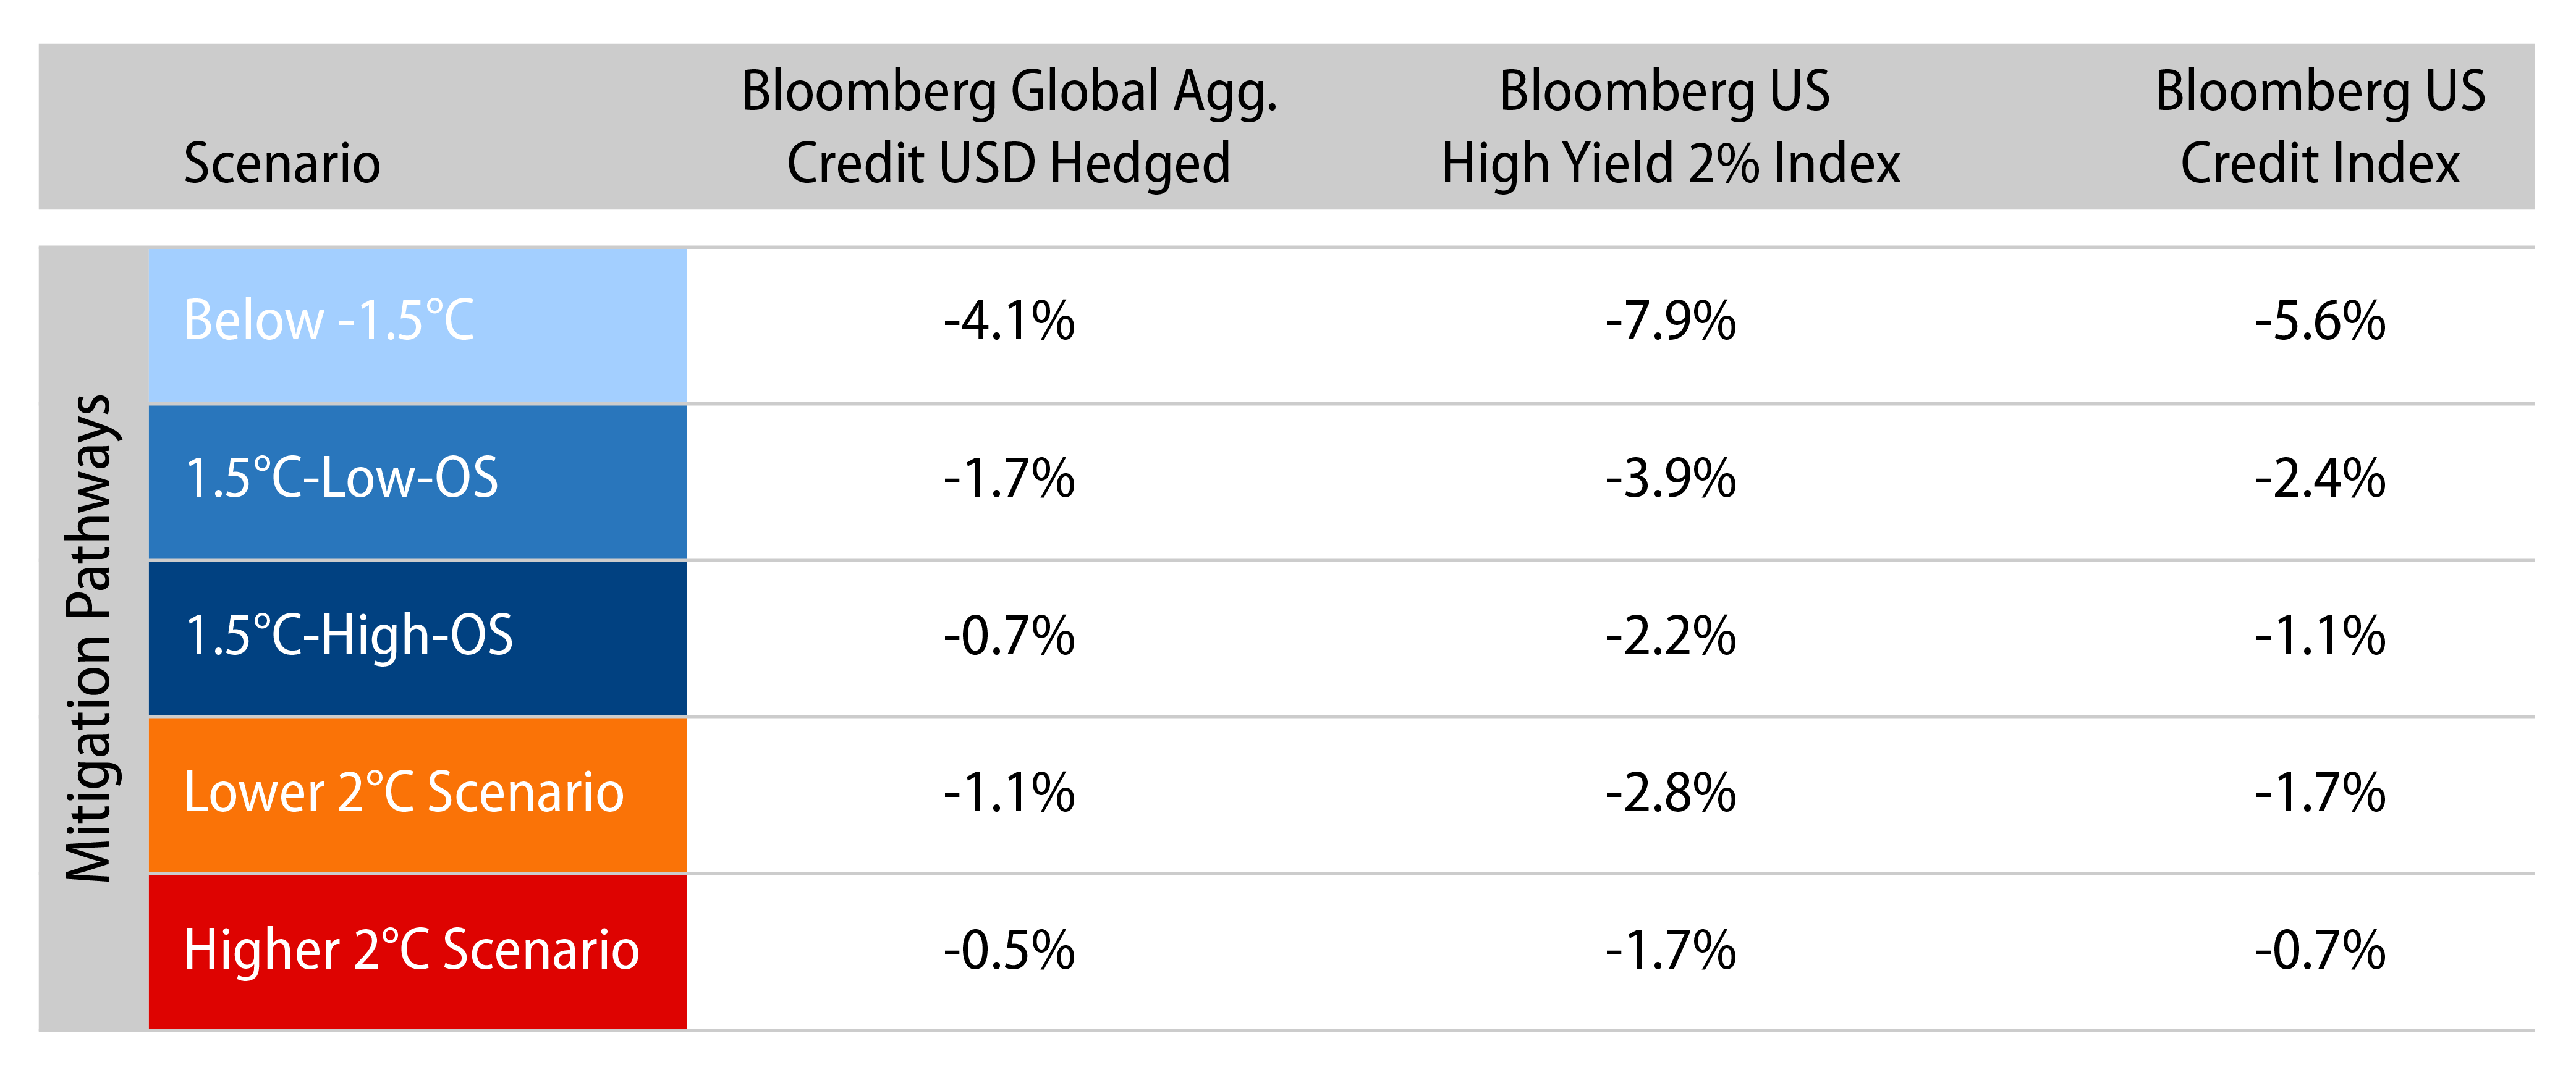
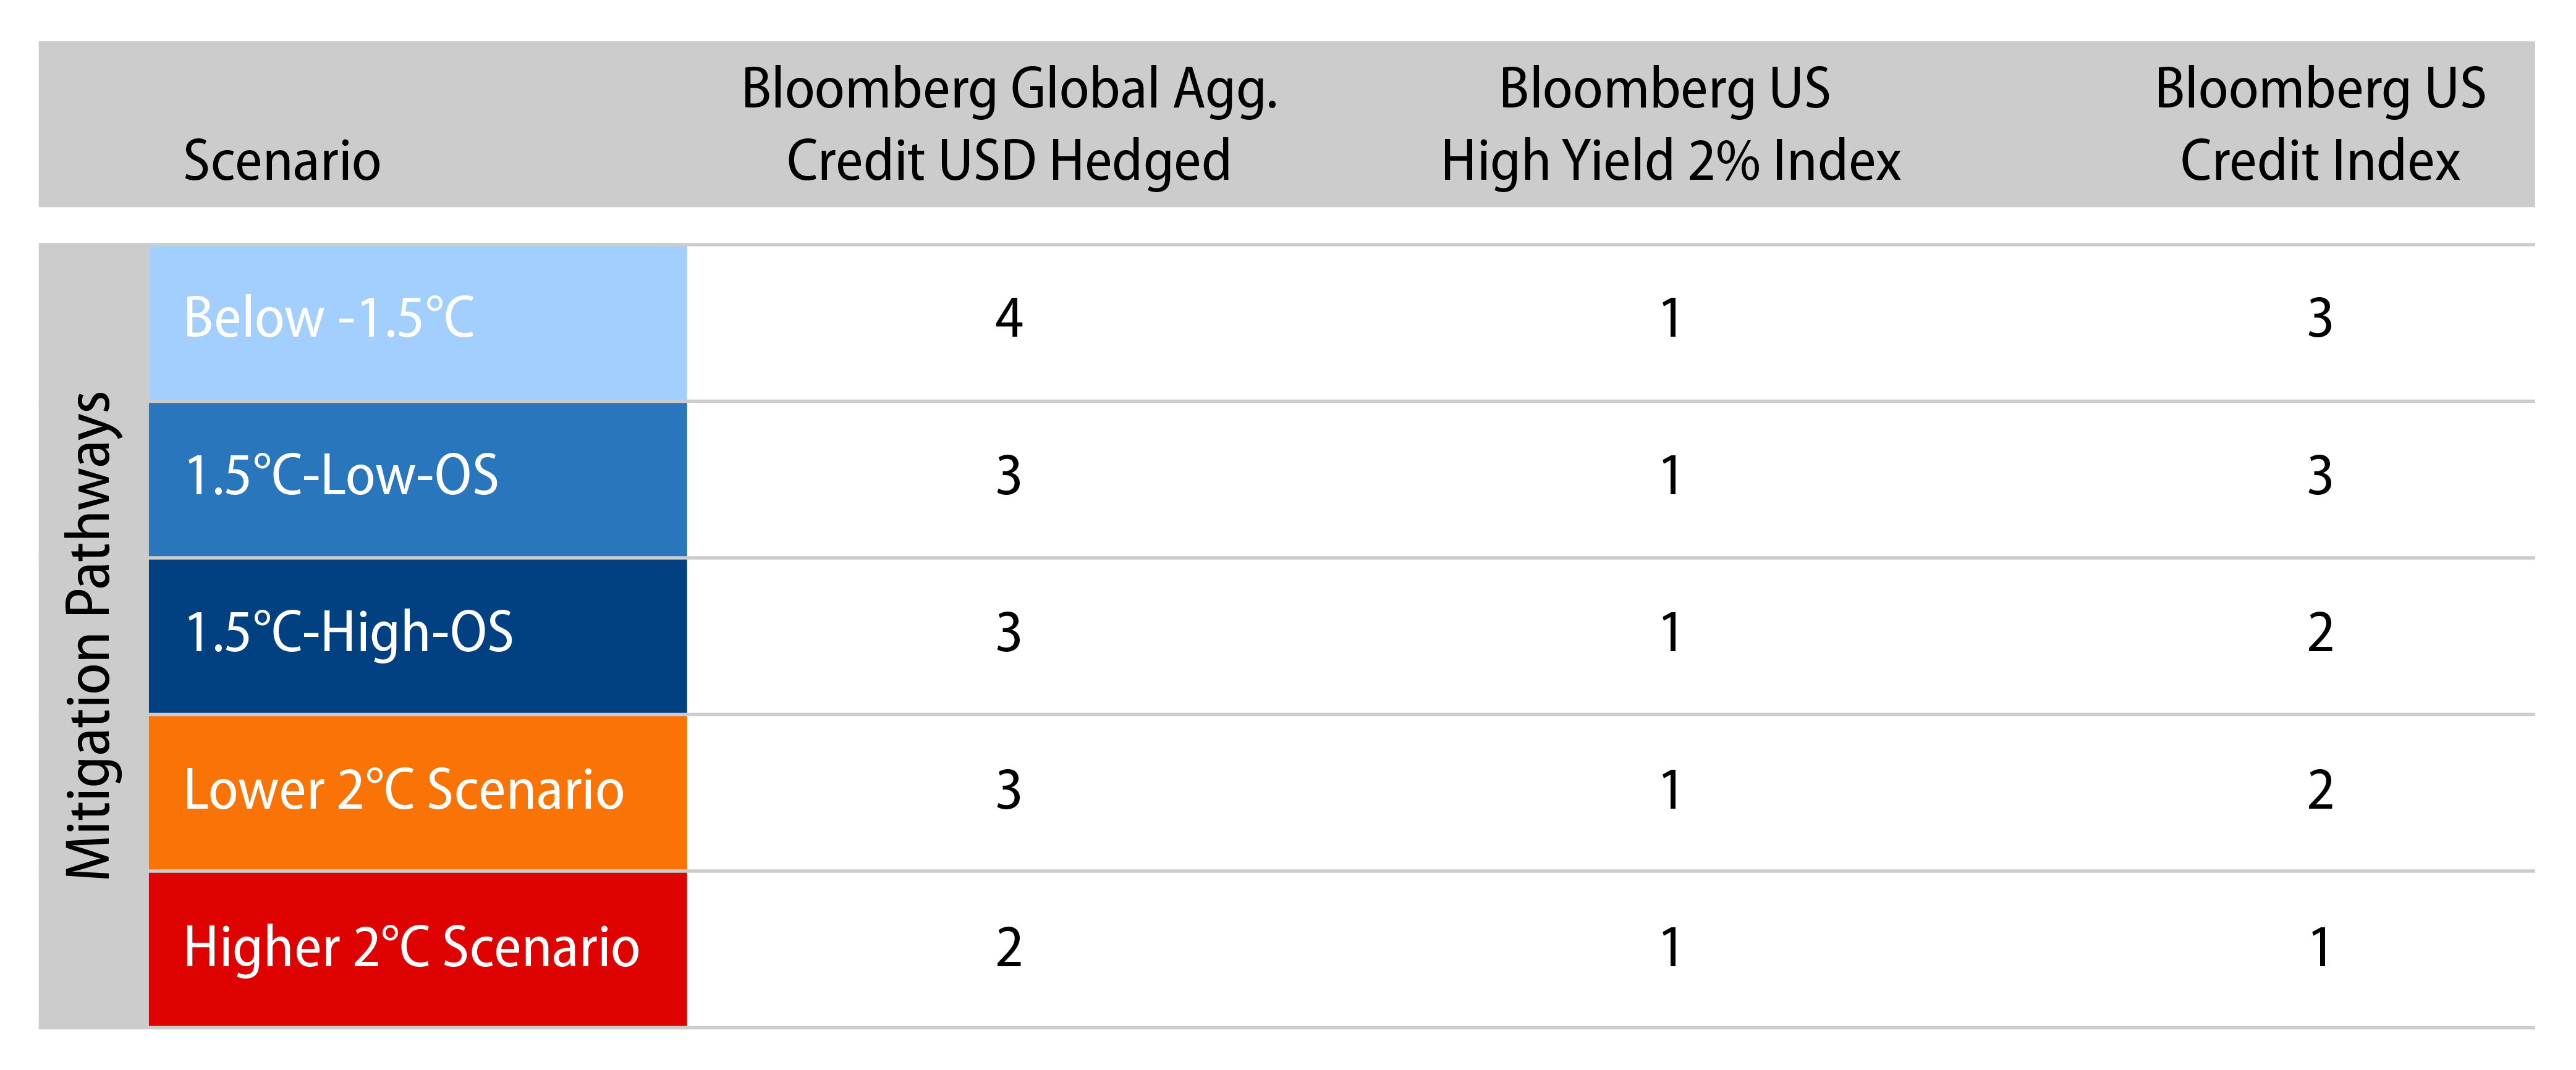
Results of stress tests show how the more ambitious the end-of-the-century temperature target is, the higher the impact in each credit index9; this is not surprising since the lower the temperature target, the higher carbon prices need to be. None of these estimates consider expected returns from carry and capital gains, given the instantaneous nature of the model.
We can see that the scenario Below 1.5°C is very ambitious; higher carbon taxes are associated with a higher negative expected return impact to the three indices. Additionally, the estimated impact is more severe as the credit quality of the index decreases. The Bloomberg US Credit High Yield Issuer 2% Capped Index has the largest negative return impact under all scenarios. Moreover, it is worth mentioning that the difference in estimated notches of credit downgrades is due to the implied initial rating of the indices, as estimated by the implied probabilities of default of the CDM given historical data. Higher initial credit rating portfolios tend to be more sensitive to smaller changes in probability of default. Therefore, the potential downgrades are more noticeable for the investment-grade indices than for high-yield index.
The magnitude of the estimated instantaneous return impacts to these three indices might surprise readers, considering how severe in terms of sociopolitical consequences climate risk is. Indices and diversified portfolios in general contain a mix of issues from companies that can be heavily impacted and not so impacted, depending on their sectors, regional operations and how they compare against peers. Also, these are 2030 estimated impacts that are brought to present value terms to the end of January 2022, and one can think about the current estimated losses at the current time as extracting value from future accrual, so the financial impact to the indices or portfolios is not negligible at the end of the horizon, 2030. We have applied the same model to estimate portfolio and active impacts, but we only focus on the indices in this publication.
Future Developments
Countries do not tax themselves and will not absorb the future increases in carbon prices in the same way that companies will have to. Subsequent publications by Western Asset shall illustrate our approach to sovereign bonds. Physical risks are also not in scope here, only transition risks—those that are directly impacted by higher future carbon prices. Losses from climate-related events, both in terms of revenue losses and physical assets impacted, also create an additional burden to companies operating in different parts of the world. Physical risk impacts to corporate and sovereign bond spreads are also being researched at Western Asset, and we will shortly publish an extension of our model that includes physical risks. Abatement costs due to new, cost-effective cleaner energy generation technologies and Carbon Capture and Storage (CCS) capabilities are not considered in this stress test. These abatement costs will certainly pave the way for the innovative companies to thrive at the expense of those that cannot adapt. Some companies will be able to lower their carbon tax burden through the adoption of new technologies, as long as they are cheaper to implement than paying for the carbon tax burden. Considering fossil fuel subsidies as an effective reduction on current carbon prices, up to the point where some countries currently practice negative effective carbon prices, is part of our research agenda.
Some Final Thoughts
Analyzing climate risk in a financial context is no easy task. We investors are in our infancy in terms of incorporating insights from climate science about the future of our planet into risk management and portfolio construction. Distributions of past returns unfortunately cannot tell us how assets react to climate change with enough confidence to create reliable models. Approximations are needed, and our model is not an exception.
There are financial instruments to protect homeowners from some risks related to climate events, such as fire and earthquake insurance, but these are shorter-term instruments, primarily renewed on an annual basis. There are also catastrophe (CAT) bonds and other insurance-linked securities (ILS) currently available in the marketplace that offer the option of protecting against climate-related damage. We do not know, however, if the longer-term climate risks are so systemic in nature that they cannot be diversified away, and, if climate-related events occur more often, there will still be shorter-term contracts available to hedge against these risks. Perhaps we will find a new meaning of systemic risk—climate change may impact the whole planet at once, and there may not be an easy and quick rebound ahead. Investors have not made progress in understanding what types of financial contracts and instruments will be needed to hedge against these risks. We are in nascent stages in understanding the impact that asset owners can have on climate policy. To the extent that investors start planning for the future, and alter their portfolio strategies, some of those longer-term climate-related risks become current risks. Not acting when other investors act and adapt might create performance and risk issues for portfolios. Our analysis humbly attempts to quantify some of those future climate-related risks.
- https://www.cftc.gov/sites/default/files/2020-09/9-9-20%20Report%20of%20the%20Subcommittee%20on%20Climate-Related%20Market%20Risk%20-%20Managing%20Climate%20Risk%20in%20the%20U.S.%20Financial%20System%20for%20posting.pdf
- Intergovernmental Panel on Climate Change (IPCC)—Panel (a) from Rogelj, J., D. Shindell, K. Jiang, S. Fifita, P. Forster, V. Ginzburg, C. Handa, H. Kheshgi, S. Kobayashi, E. Kriegler, L. Mundaca, R. Séférian, and M.V.Vilariño, 2018: Mitigation Pathways Compatible with 1.5°C in the Context of Sustainable Development. In: Global Warming of 1.5°C. An IPCC Special Report on the impacts of global warming of 1.5°C above pre-industrial levels and related global greenhouse gas emission pathways, in the context of strengthening the global response to the threat of climate change, sustainable development, and efforts to eradicate poverty [Masson-Delmotte, V., P. Zhai, H.-O. Pörtner, D. Roberts, J. Skea, P.R. Shukla, A. Pirani, W. Moufouma-Okia, C. Péan, R. Pidcock, S. Connors, J.B.R. Matthews, Y. Chen, X. Zhou, M.I. Gomis, E. Lonnoy, T. Maycock, M. Tignor, and T. Waterfield (eds.)]. In Press.
- Merton, Robert C. (1974). On the Pricing of Corporate Debt: The Risk Structure of Interest Rates Journal of Finance. 29 (2): 449–470.
- Earnings Before Interest, Taxes, Deductions, and Amortizations. The scenario carbon cost as a % of EBITDA of the company is calculated using current EBITDA of the company. For any company that has a negative EBITDA, an estimated EBITDA is assigned using the current market capitalization and market weighted average of its industry Price Earnings ratio estimates. We also use three years averages to avoid annual fluctuations in the results of companies due to special situations
- So for companies operating in Sweden, for example, where current carbon prices are already high, the impact is assumed to be zero, not negative, in scenarios with lower future than current carbon prices.
- We use MSCI’s E score to assess how each company is positioned relative to its peers on this dimension.
- We use the carbon emissions reported by each company and create an emissions momentum metric over the past three years of emission, based on publicly reported data.
- In our model, revenues are very sensitive to the additional burden of carbon taxes. Implicitly, we assume that prices of services and goods produce by companies are quite elastic, so even in the case of companies that score well relative to their peers, the ability to pass the tax burden to customers is quite limited.
- Not considering physical risks, which might change the overall conclusion, depending on the impact on issuers coming from sources beyond carbon price shocks.