KEY TAKEAWAYS
- The low-yield environment is neither overtly positive nor negative for LDI.
- Fixed-income is no worse and no better a hedge of plan liabilities in the current environment than it was when yields were higher.
- While asset yields are lower in the current environment, so are the yields of liabilities.
- Lower yields have been accompanied by lower credit spreads, at least over the past few years, which can make government credit more appealing than long credit.
- We believe that the relative return premium for equities over bonds is fairly low at present, suggesting that this is perhaps not the best time for DB plans to be moving into equities.
We often hear these days from pension plan sponsors that they “can’t do LDI in such a low-yield environment” or that “it makes no sense for our plan to buy bonds in such a low-yield environment.” Both these statements, as presented, reflect a fundamental misunderstanding of what LDI is.
As you already know, LDI stands for liability driven investing. LDI is not putting on an interest rate swap to match the duration of plan assets to that of plan liabilities. It is not even buying physical bonds to match those durations. It is not derisking your pension plan.
LDI is merely the realization that the returns on plan assets should match or exceed those on plan liabilities. Here is the essence of LDI:
- Assets return 15%, liabilities rise by 20%. Your plan had a bad year.
- Assets return zero, liabilities decline by 5%. Your plan had a good year.
Whether your asset returns were favorable or unfavorable depends only on how they fared relative to your liabilities. That is all LDI means or is intended to mean. All the finer points about allocating to swaps or putting on highly customized asset allocations to hedge liabilities flow from this simple principle. Because the aforementioned interpretations sound technical and require a lot of attention, they tend to dominate the LDI discussion in the minds of some plan sponsors or administrators. However, they are minor details when compared to the message that for a defined benefit (DB) pension plan, all that matters is the return on assets relative to the return on liabilities.
So, let’s apply the primary message of LDI to the current yield environment. Yes, yields are low. This implies low returns on fixed-income plan assets. However, it also implies low returns on plan liabilities. Based on these observations alone, fixed-income is no worse and no better a hedge of plan liabilities in the current environment than it was in the (bad old) days when yields were much higher.
Meanwhile, the related question is: can stocks and other “return-seeking assets” also be expected to achieve lower returns in this environment than previously? Similarly, what are the prospective returns for risk assets versus hedge assets versus liabilities? These are the primary questions a DB plan sponsor needs to address, and the simple observation that yields are low contributes nothing toward addressing them.
Liability Yields Have Declined Just as Much as Bond Yields
It should be obvious that the yield declines of recent years have also resulted in declines in the discount rates used to evaluate DB plan liabilities. Such discount rates are a measure of the “yields” on liabilities. And for DB liabilities, as for fixed-income assets, yield is a measure of prospective returns. In other words, the yield declines of recent years have wrought declines in the expected returns of both fixed-income assets and DB plan liabilities.
Exhibit 1 plots yields on long bonds against those of a relatively young DB pension plan that uses spot yield curves to evaluate its cash flow liabilities as per FASB protocols. The three bond yields shown are those estimated by Bloomberg Barclays for long Treasuries, long AA corporate bonds and long BBB corporates.
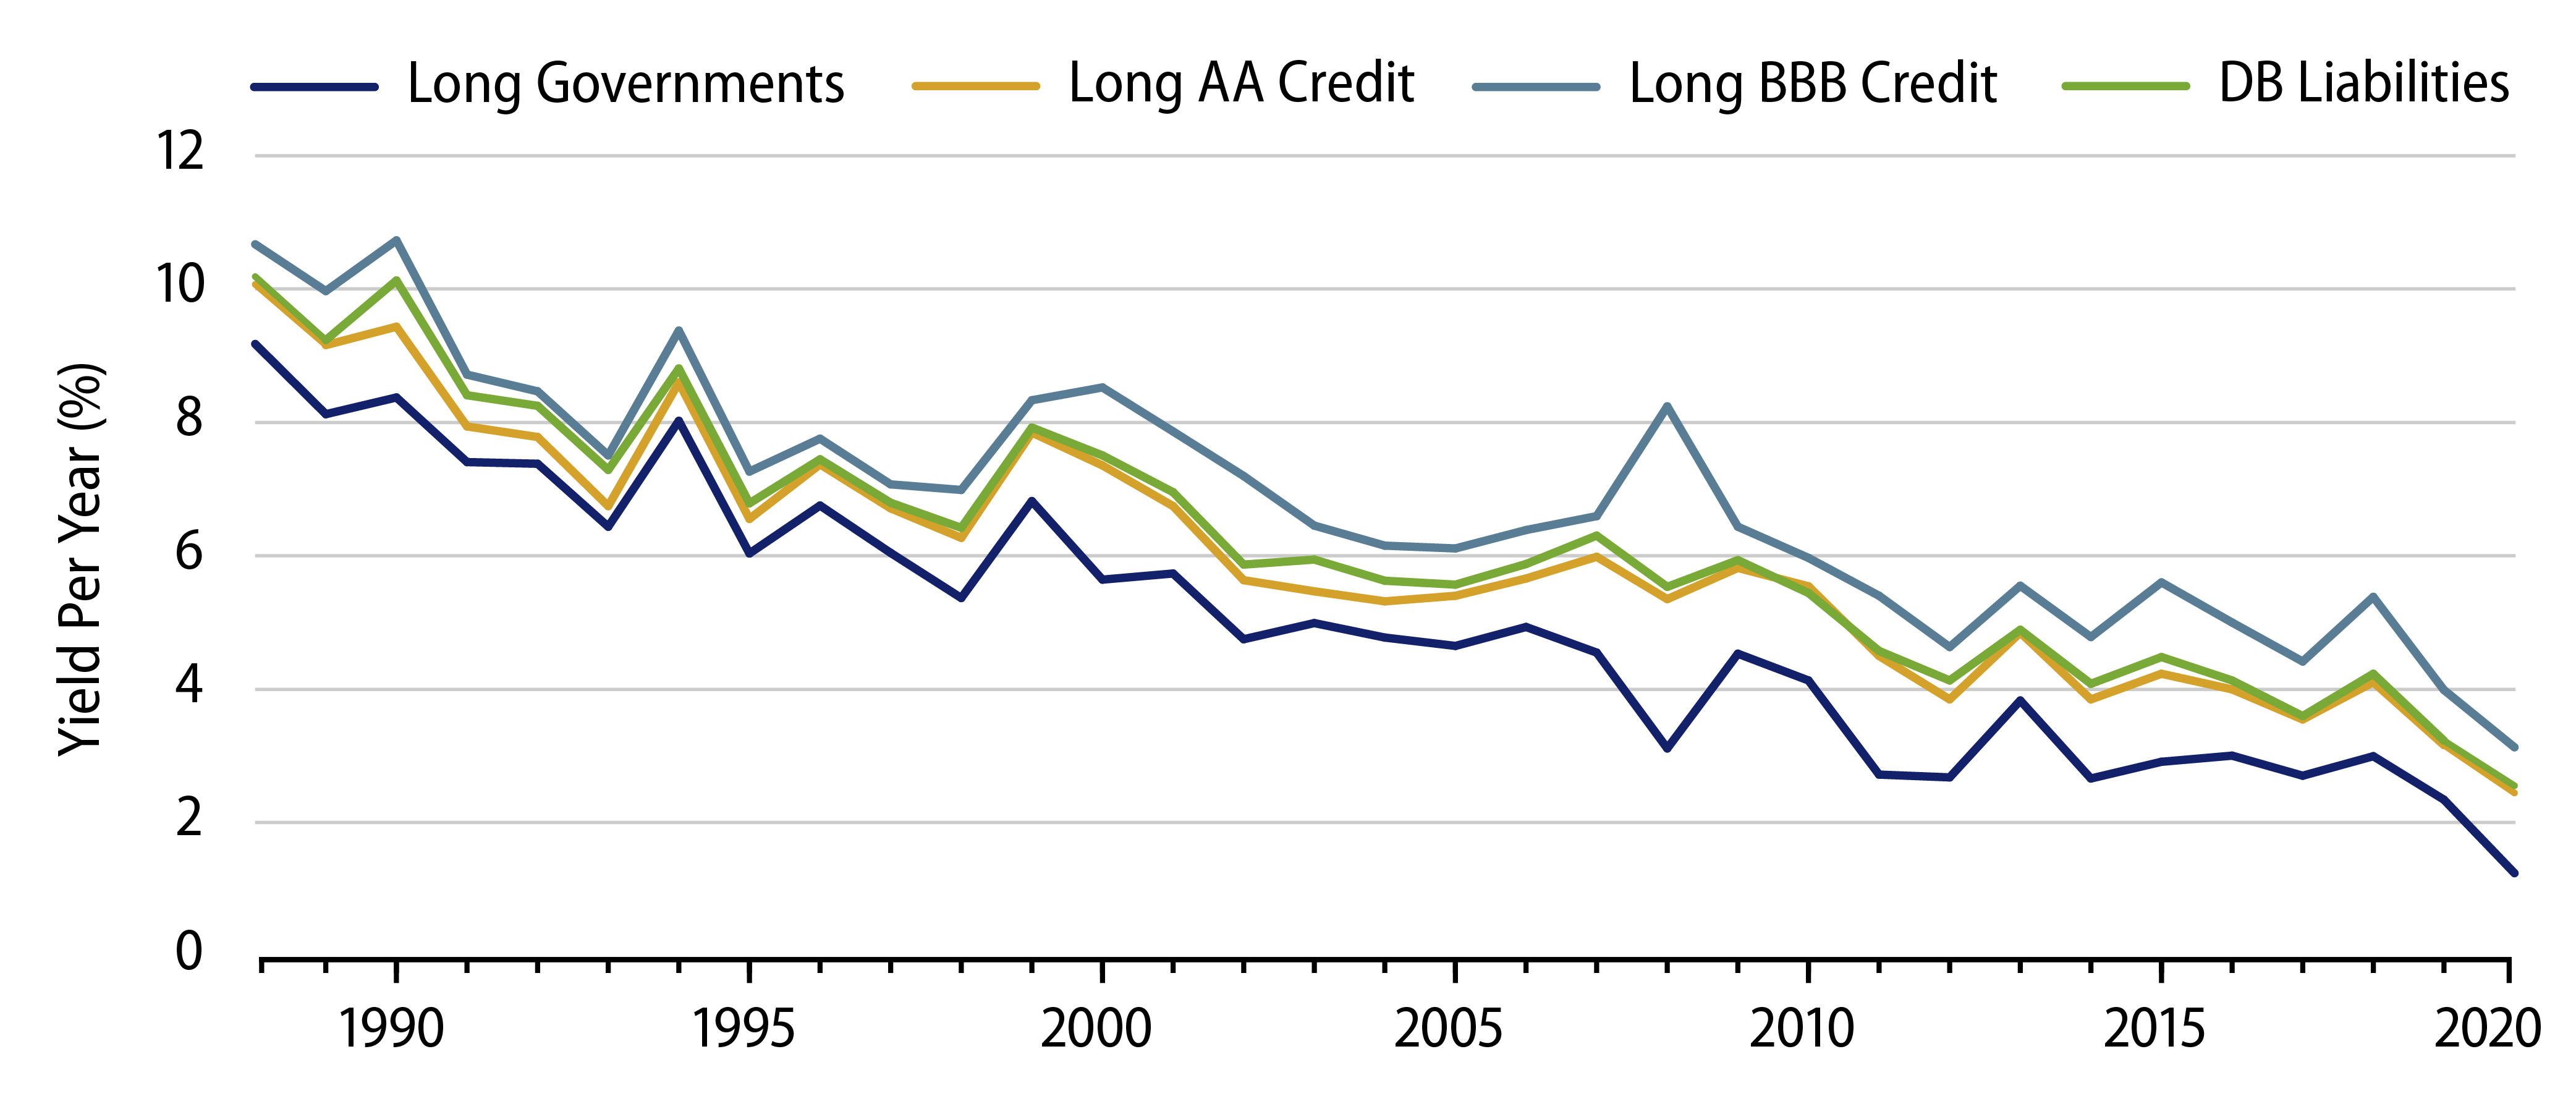
It is not surprising that yields on this plan’s liabilities track so closely with long AA yields. After all, the spot curve the actuary provides is based on AA yields, and the duration of the plan in question is reasonably close to that of Barclays’ long AA universe. The point of the chart is merely that asset and liability yields have trended lower together.
Since LDI dictates that we should be concerned with how fixed-income assets behave relative to plan liabilities, the relevant comparison is not the absolute levels of the asset and liability yields, but the levels of asset yields relative to those of liabilities. We want to know about the spread of bond yields over liability yields, with some consideration for the extra risks (both spread risks and default risks) that the assets might present.
Current Yields Argue More for Long G/C Than Long Credit
The fact is that lower yields have been accompanied by lower credit spreads, at least over the past few years. Exhibit 2 presents credit spreads in the way most relevant for DB plans. Since DB liabilities are evaluated for accounting purposes via AA yields, AA spreads measure the yield “deficit” suffered by Treasuries relative to DB liabilities. We show the spreads of Barclays long credit and long government/credit (long G/C) relative to those of Barclays long AA credit as a measure of the yield premia offered by long credit and long G/C vis-à-vis DB liabilities.
As you can see in Exhibit 2, long AA spreads have moved lower in recent years, while the premia of long credit and long G/C spreads over long AA spreads have held steady or even increased a bit on net, especially so for long G/C. The lower AA spreads mean that despite the lower level of yields, Treasuries are actually a more effective hedge of liabilities now than they were five to 10 years ago. That is, the yield given up by investing in Treasuries rather than credit is less than what it had been, whereas Treasuries still enjoy their lack of spread risk and (mostly) lack of default risk.
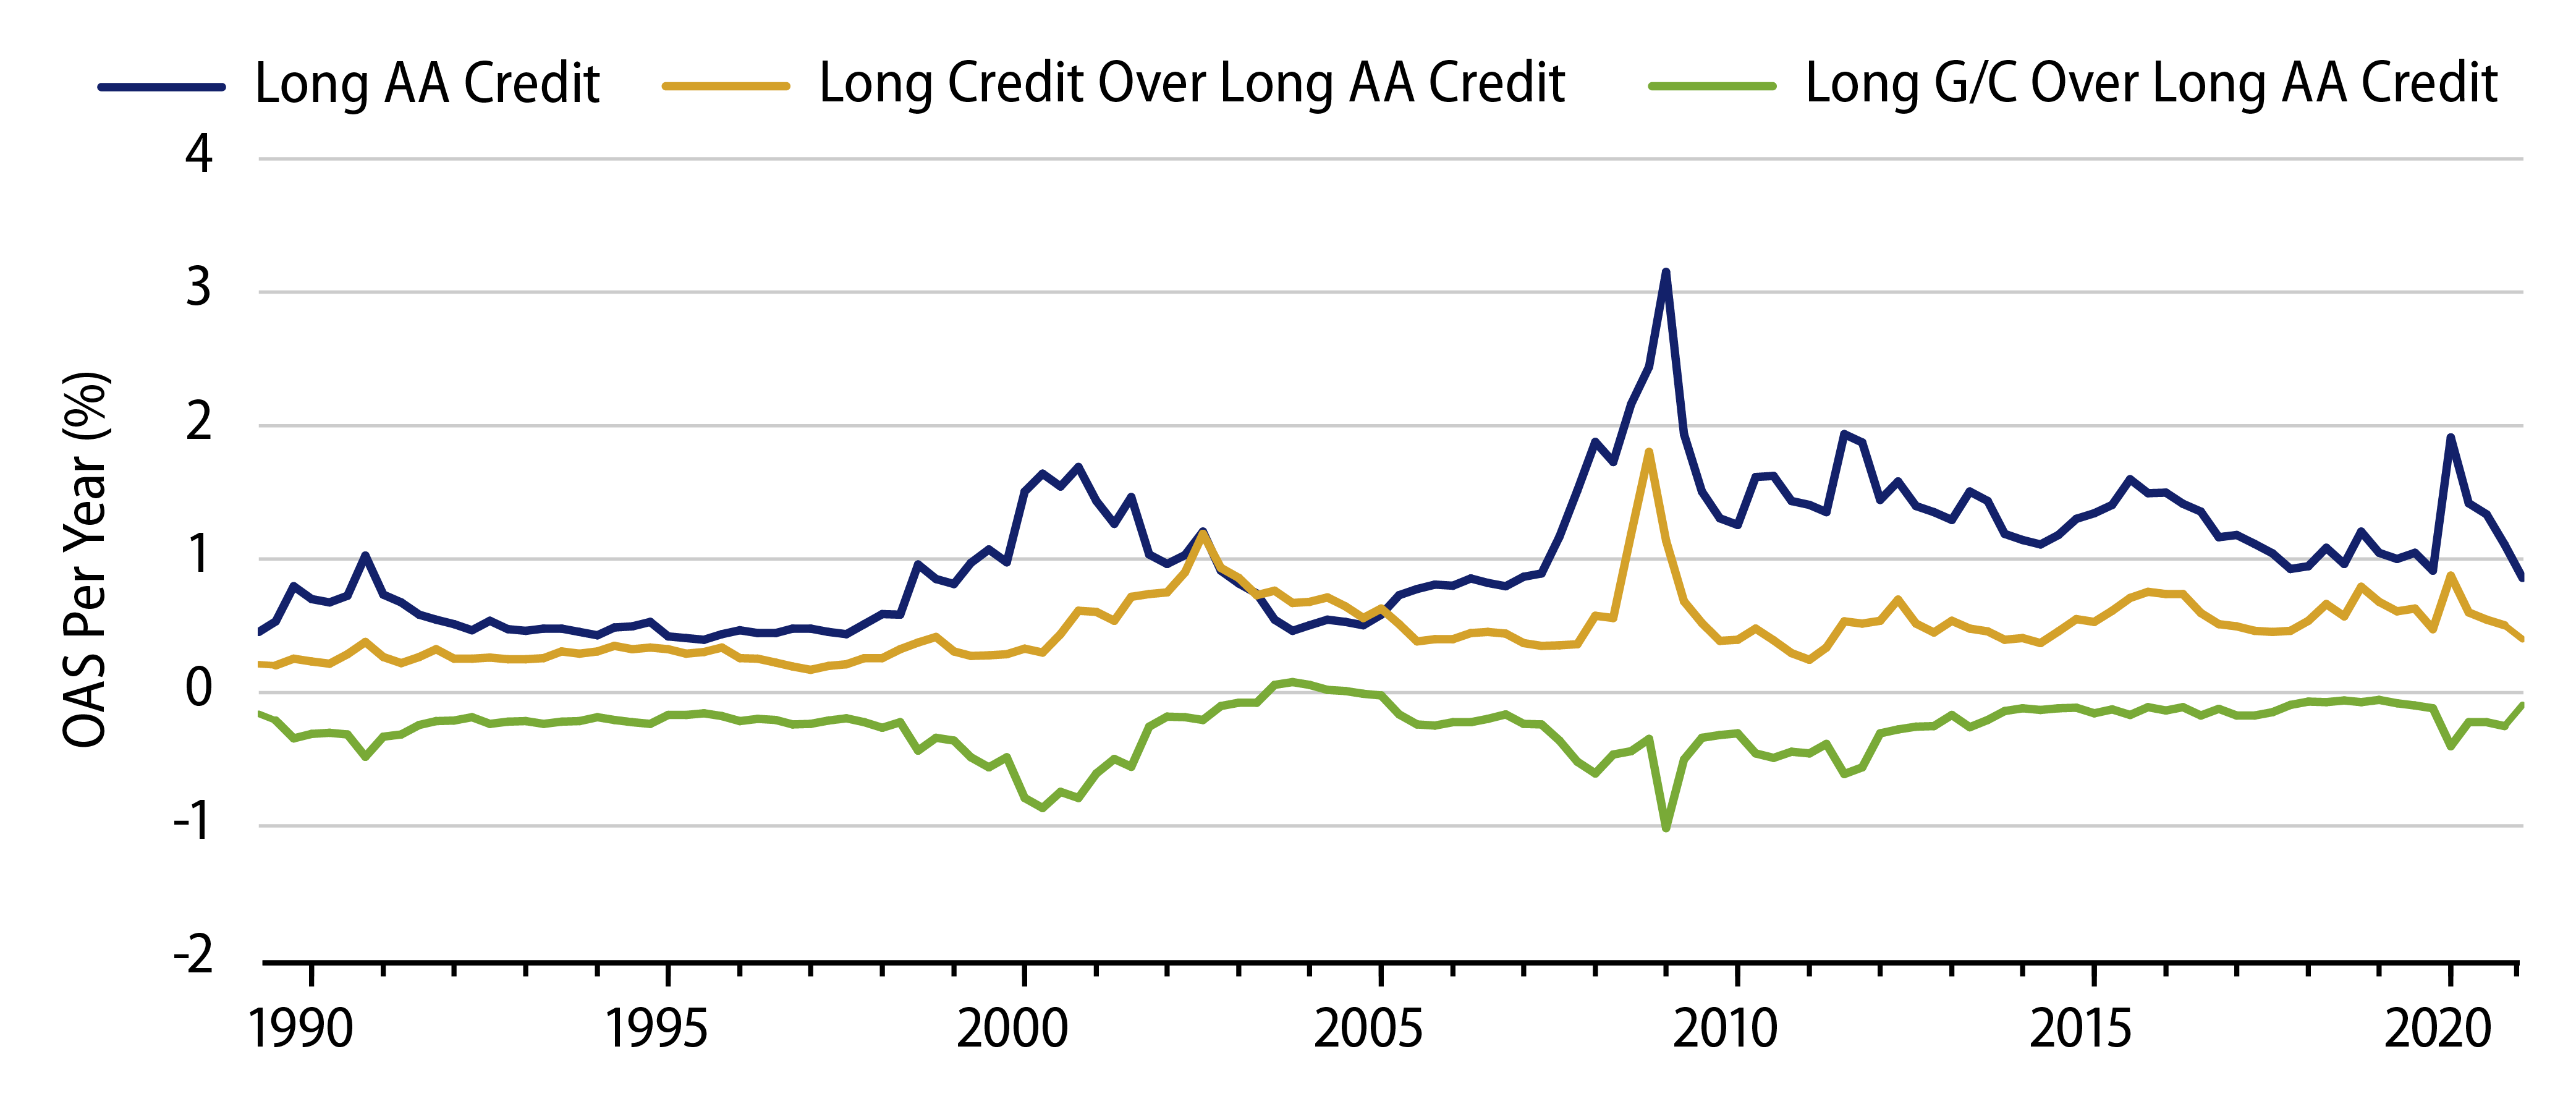
The relatively elevated levels of long credit spreads over long AA spreads indicate that long credit is just as attractive a hedge of DB liabilities as it has been through most historical experience. Long G/C currently offers a more attractive hedge of liabilities than it did through most of the past 30 years.
Unlike liabilities, credit returns will still suffer hits from occasional downgrades and defaults, not to mention higher spread risks than are faced by the liabilities.1 However, the spread premia long credit and long G/C now offer look to be just as substantial a compensation for those risks as what we have seen previously other than at the peak spreads seen during the global financial crisis of 2008 (GFC).
The bottom line is that for liability-hedging purposes, both long G/C and long credit allocations are more attractive than was the case when AA yields were higher.
Prospective Equity Returns Have Declined Just as Much
Of course, as we said at the outset, for LDI purposes, it’s all relative. Fixed-income might look more attractive as a hedge of liabilities now than it did previously, but for determining whether and how much to hedge, the relevant question is how long G/C and long credit look relative to return-seeking assets. To address that question, we need to analyze how prospective returns on equities (and other risk assets) have changed as yields have declined.
Unlike fixed-income, equity returns are open-ended. Buy into a fledgling start-up, and who knows how high (or low) your returns might be? For the broad stock market, however, the range of outcomes is more defined. Broad market valuations (P/Es) have moved historically in a wide but bounded range. Furthermore, earnings growth for the broad-based corporate sector is bounded by the growth of corporate sector output.
Corporate earnings (profits) are capital’s share of corporate output. Labor, suppliers and the government take the rest. For the aggregate corporate sector, “suppliers” are just other corporations, so that aggregate corporate output typically can be split across shares of workers (wages), government (taxes) and capital (profits). Over the long term, the corporate share of output is bounded above by workers’ and governments’ demands, so that eventually, aggregate corporate profits can grow no faster than aggregate corporate output.
Meanwhile, the Capital Asset Pricing Model posits that the market value of a corporation equals the present value of the after-tax cash flow that the corporation can be expected to provide over time. Apply that statement to the aggregate corporate sector, invoke the finding that aggregate corporate after-tax cash flow (earnings) will tend to grow at the same rate as output, simplify the math, and you end up with the following formula:
“Current earnings yield” is just the inverse of the market P/E. In other words, the higher the market P/E, the lower the return on the broad stock market that can be expected going forward, and vice versa. Similarly, the slower corporate output can be expected to grow, the lower the expected return on equities, and vice versa.
Again, for any individual stock, the sky’s the limit on the upside, with failure (bankruptcy) the limit on the downside. For the broad stock market, where most DB plans live, equity returns are more range-bound, and they will tend to rise and fall with valuations and with the fortunes of the corporate economy.
The latter point is lost on many investors, who tend to transfer the “no-limits” possibilities of individuals stocks onto the market as a whole. Everyone knows and acknowledges that higher returns—falling yields—on bonds today mean lower returns in the future. This is just as relevant for equities, but not many investors realize it.
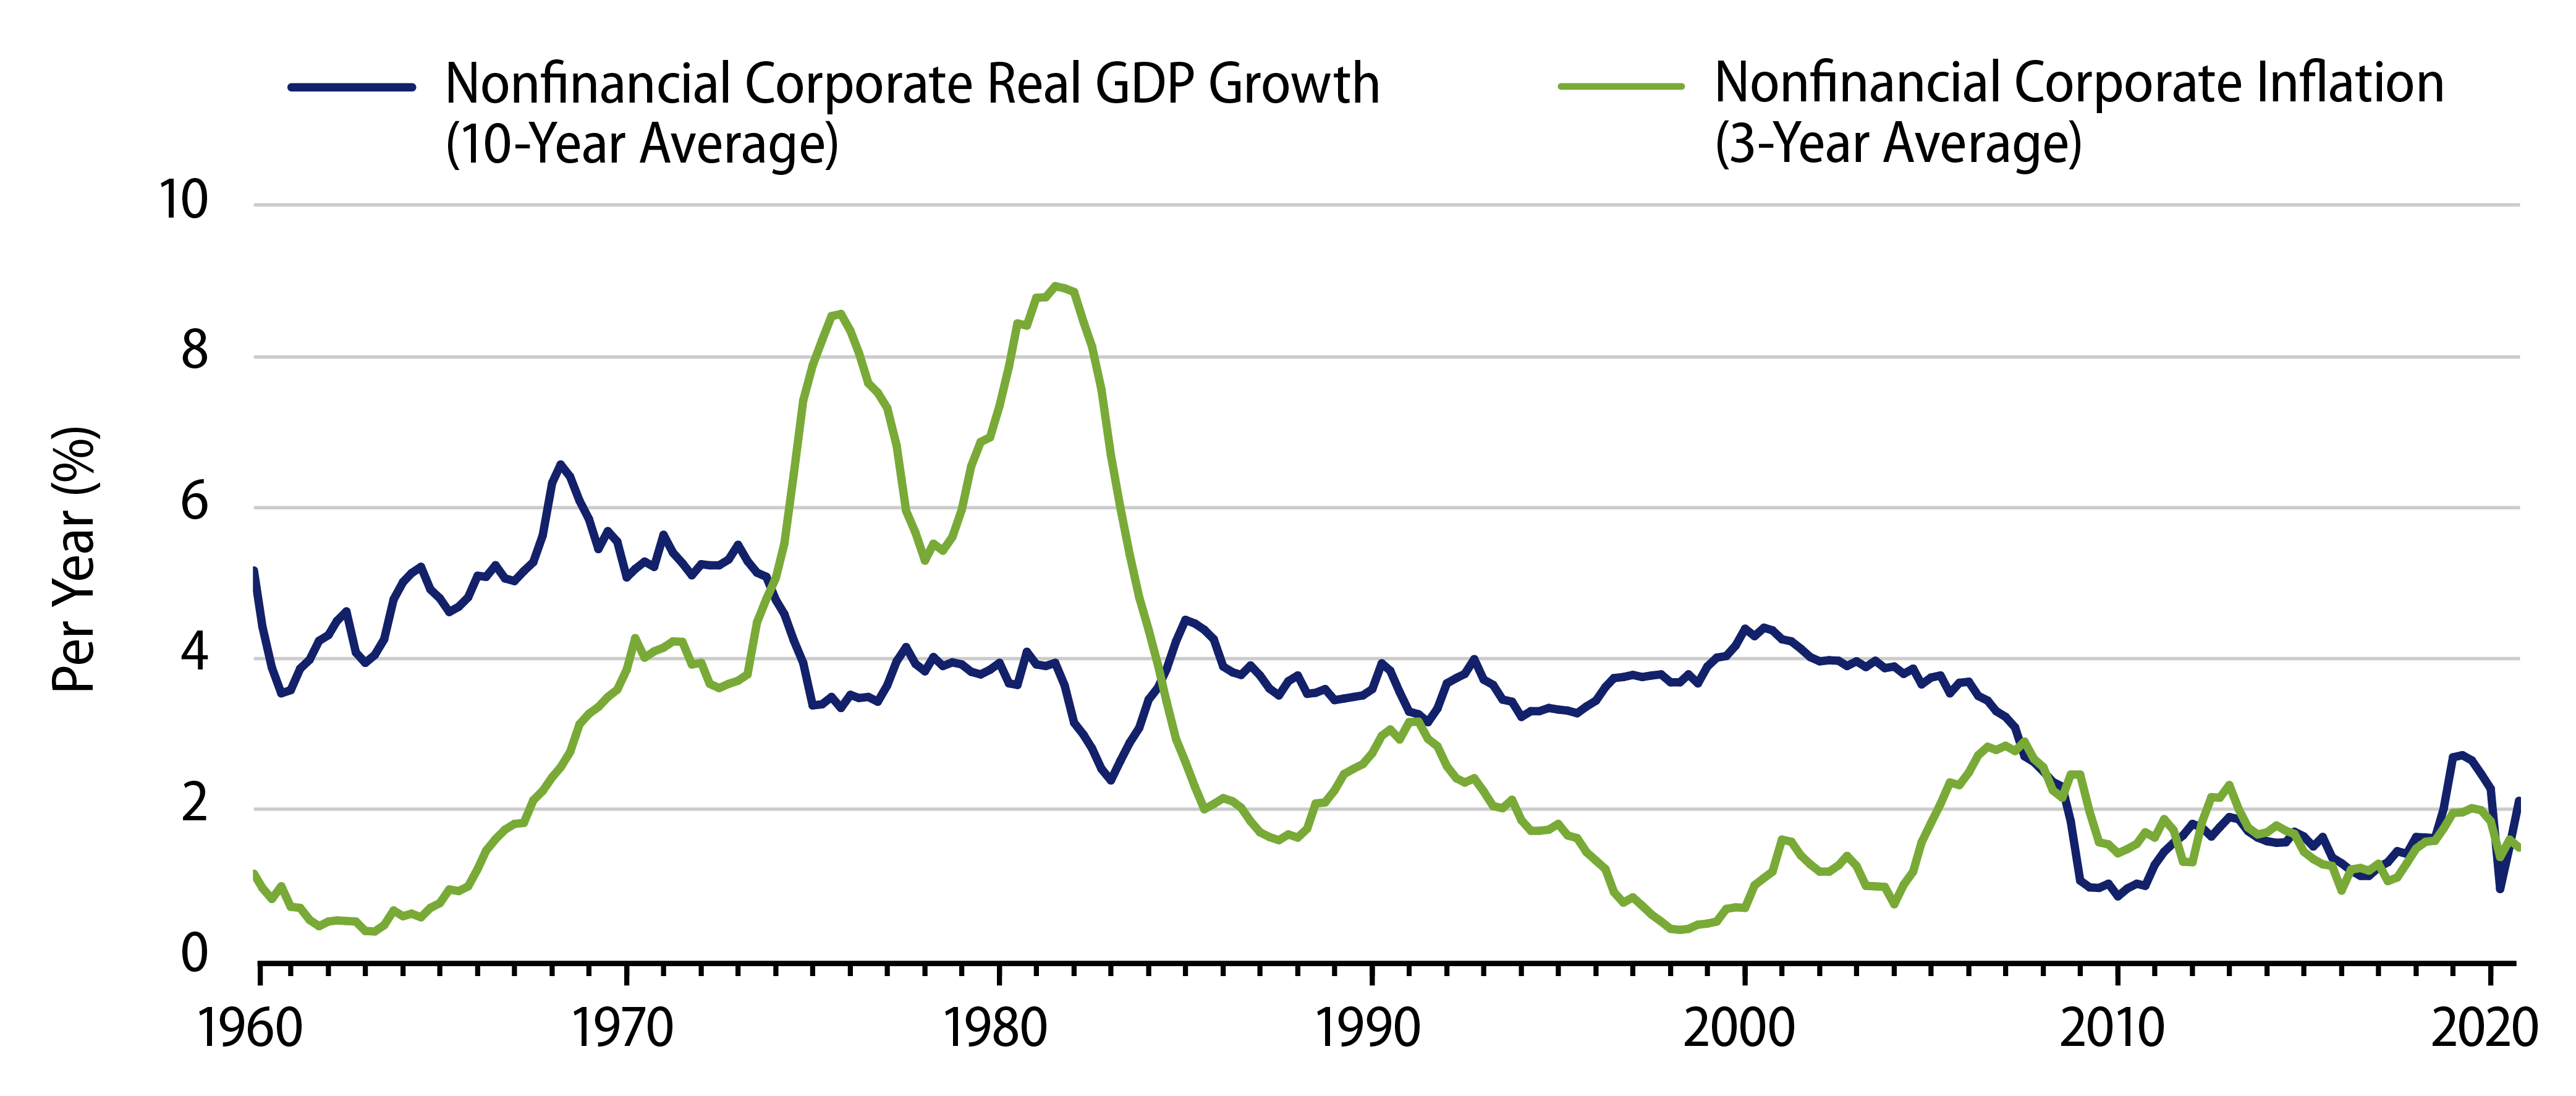
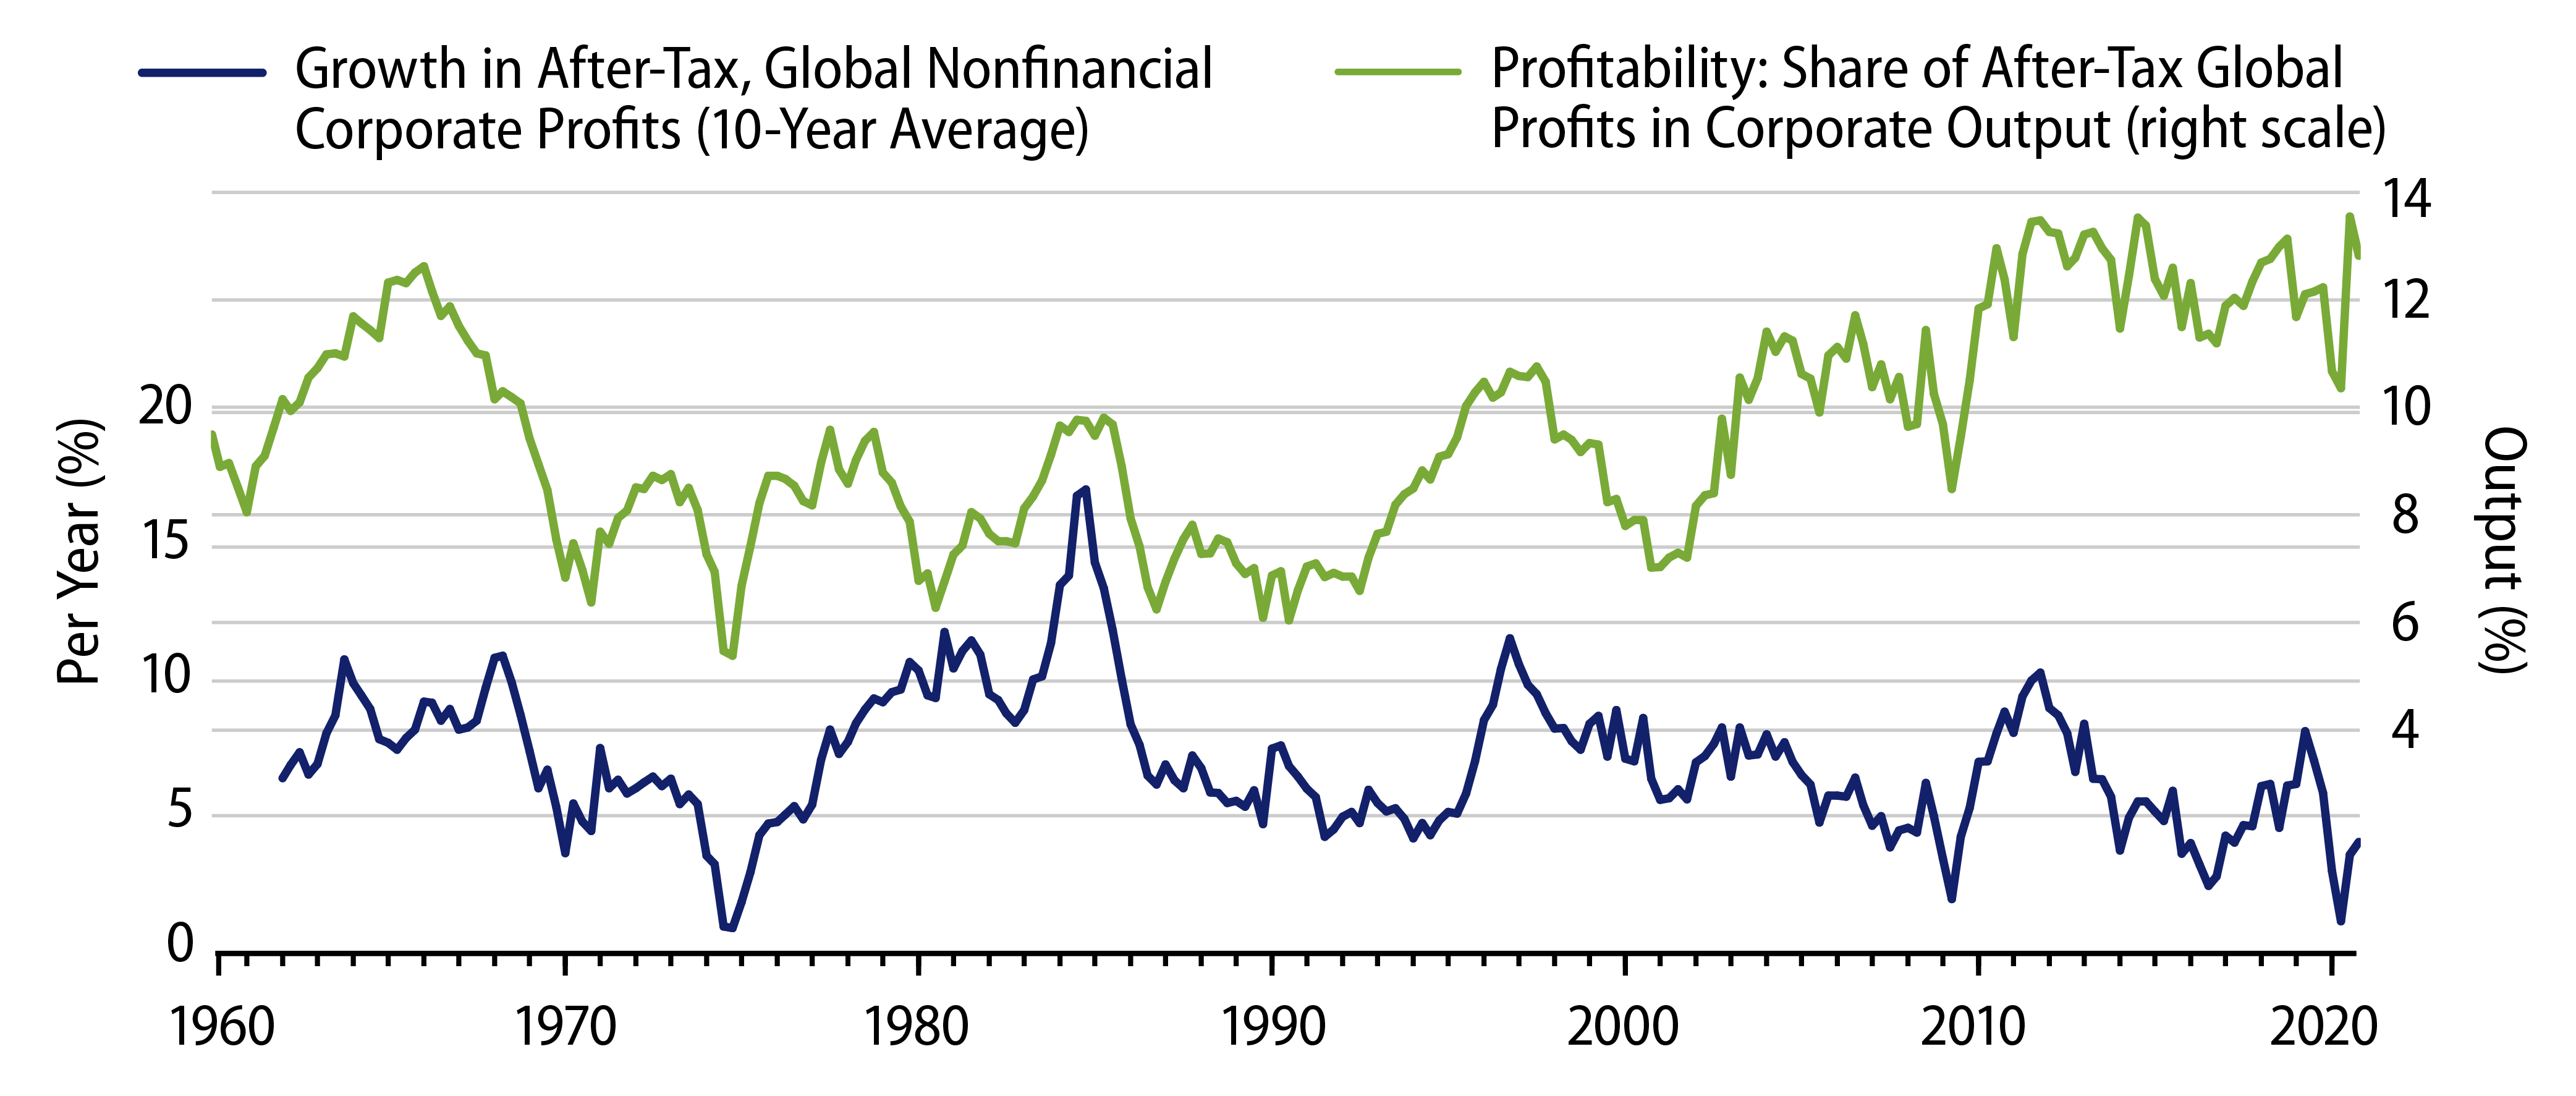
The next few charts show trends in earnings and valuations for the aggregate corporate sector. Note in Exhibit 3 that both real growth and corporate sector inflation have been on declining trends for years. Note for Exhibit 4 that growth in after-tax (global) corporate profits has shown a similar deceleration, and note further that the share of corporate profits in corporate output has been relatively high but not rising ever since the GFC.2 Finally, Exhibit 5 shows that nonfinancial corporate valuations have become quite high recently.
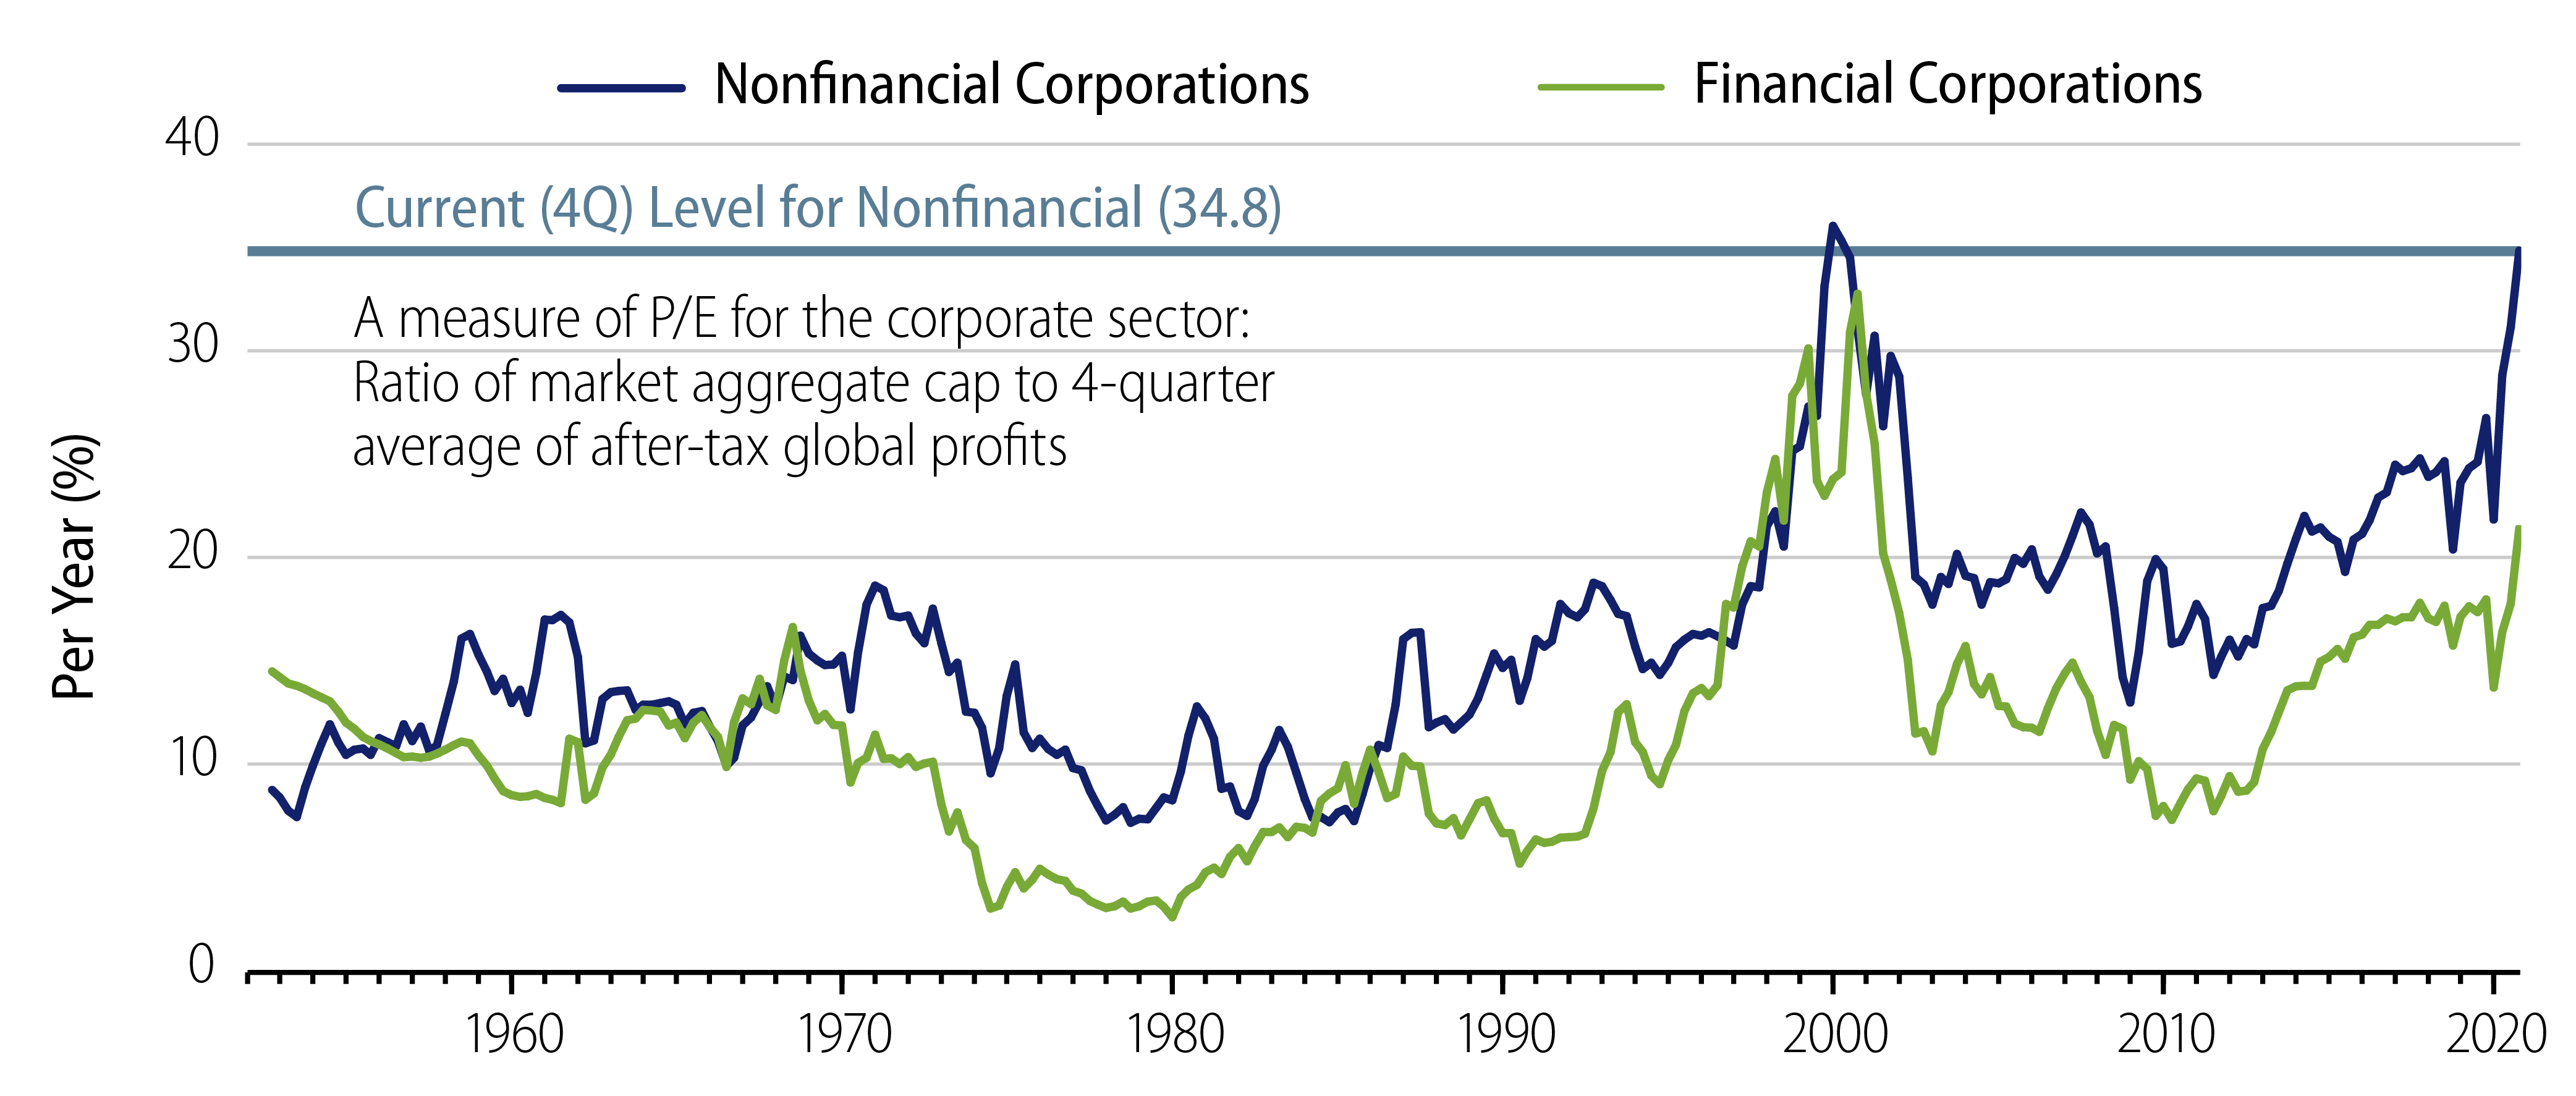
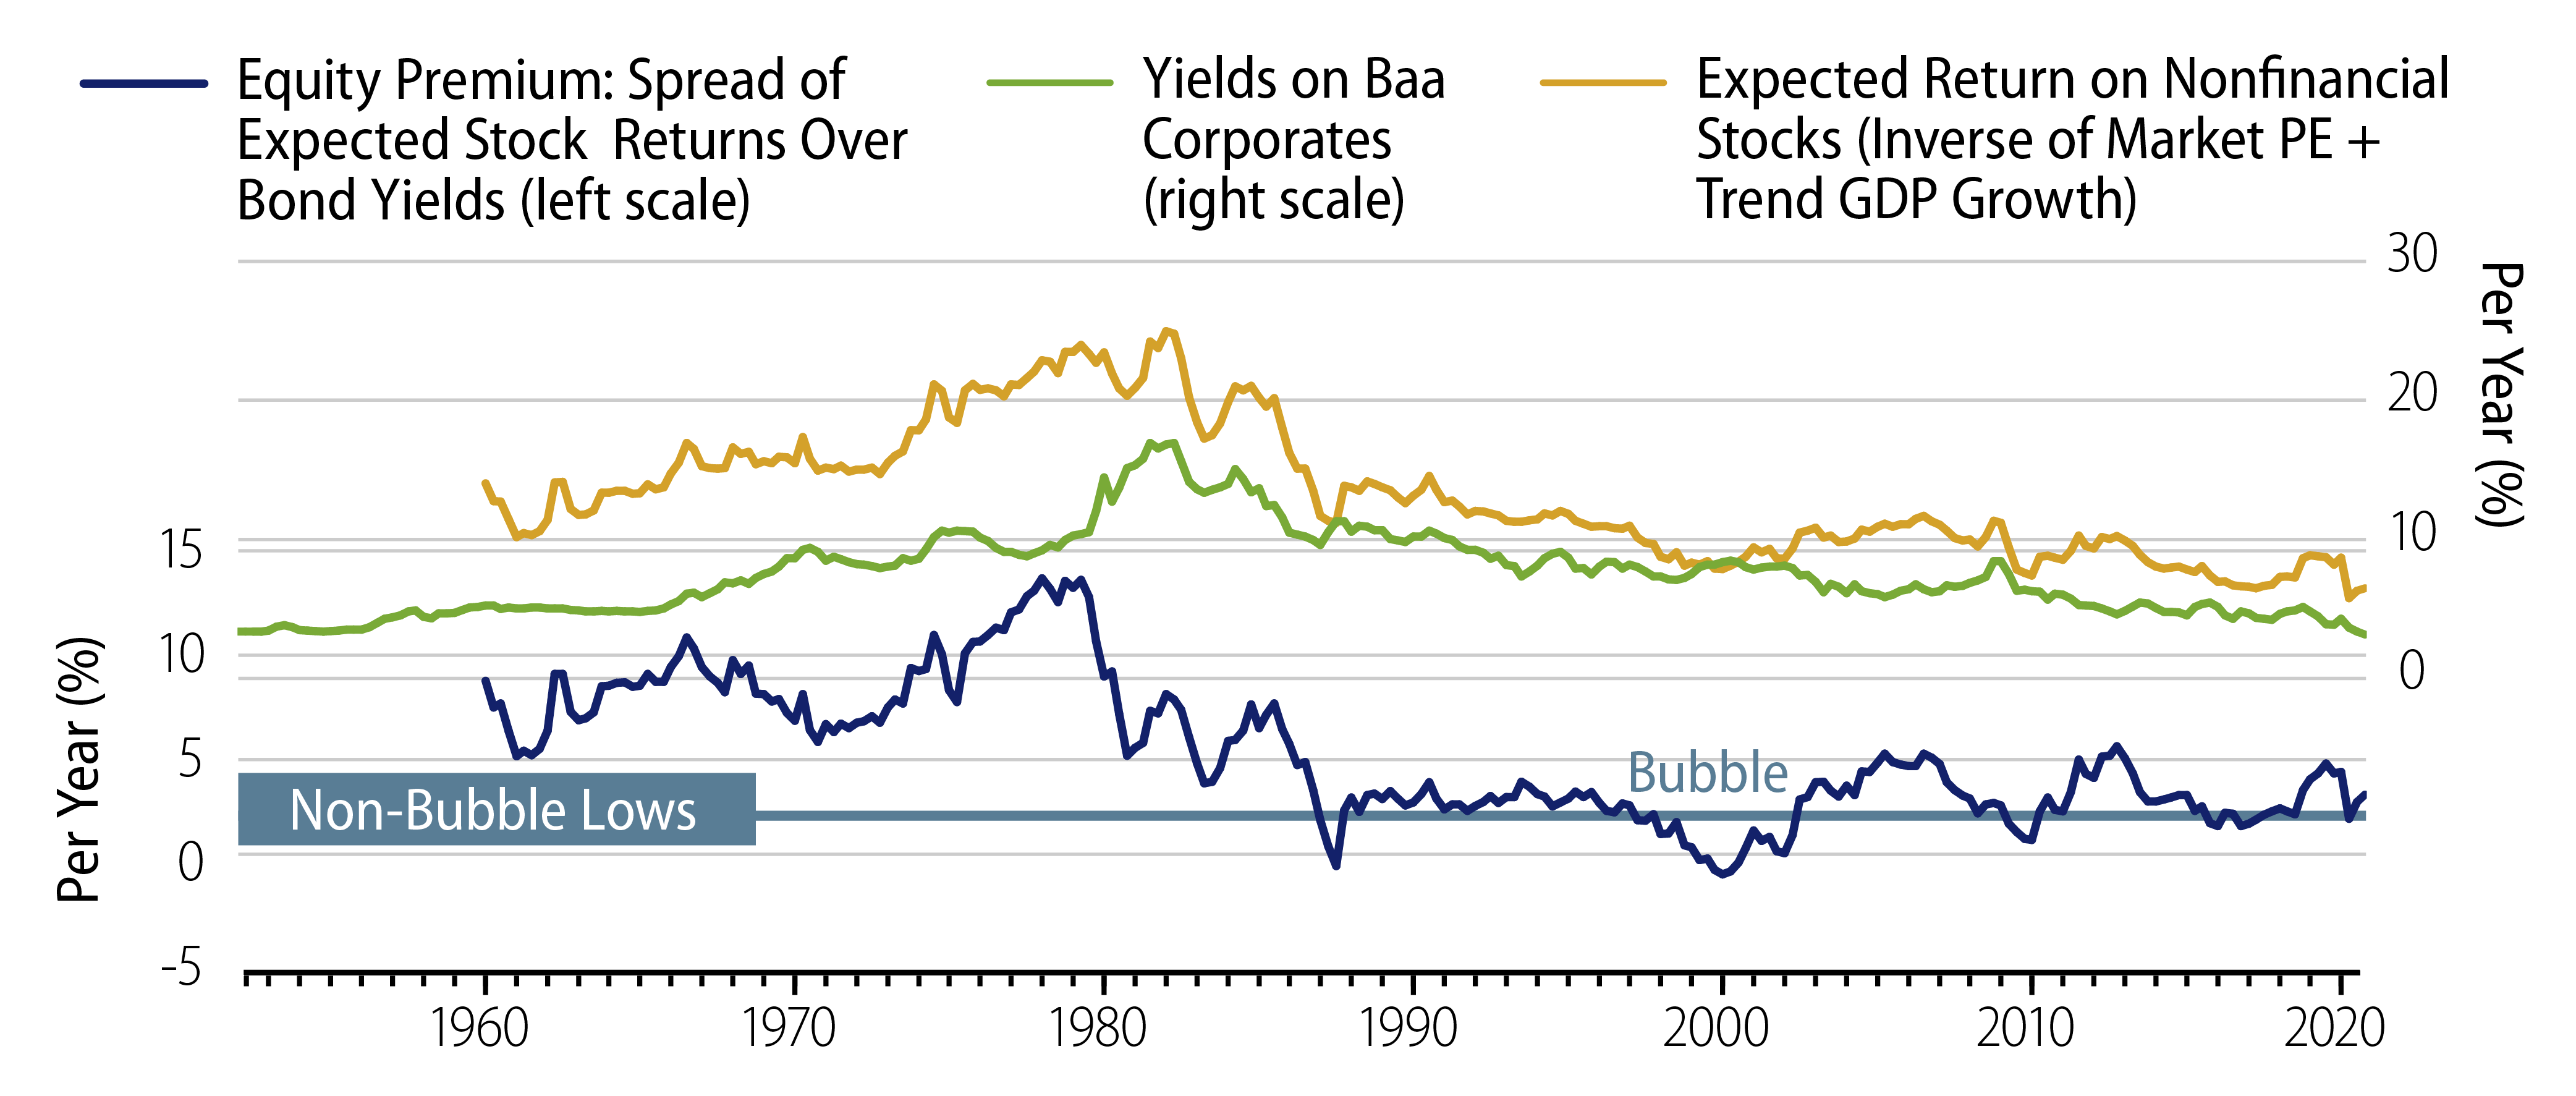
All these facts would tend to suggest that prospective returns on equities have been declining, and, in fact, when the Prospective Return on Stocks formula is converted into a running series on prospective equity returns, as in Exhibit 6, you can see those prospective returns trending lower. This is right in line with bond yields throughout the last 40 years. Also shown there is the resulting estimated equity premium: the amount by which equity returns can be expected to exceed those on (long Baa) corporate bonds.
Yes, equities still offer a return premium over corporate bonds (and Treasuries). However, this premium has declined substantially over the past year. As of year-end 2020, it stood at levels as low as any point in post-war history other than 1) 1987, the eve of the Black Monday stock market crash, 2) 1999, the peak of the dot-com bubble, or 3) 2010, the eve of the 2010-2011 stock selloff.
None of this implies the stock market is overvalued. None of this implies that DB plans should get out of stocks.
The point of these charts is to substantively point out that the low levels of yields everyone bemoans are accompanied by similarly low prospective returns on equities.
On a risk-return basis relative to DB liabilities, long G/C and long credit portfolios look as good or better versus equities as they have at most points in history. Not only is the low level of yields per se no cause to eschew LDI thinking, it provides no real reason for DB plans to reduce fixed-income exposure or to load up on equities.
If your plan is severely under-funded, then, yes, you will have to take steps to improve funded status, and one of those steps will likely be an increase in your allocation to risk (return-seeking) assets. But the need for that step is dictated by your plan’s funded status, not by current market pricing. If anything, current market pricing should make you more inclined to bite the bullet and contribute substantially to the plan, as the high valuations on equities and low credit spreads make risky allocations less likely than previously to substantially improve funded status.
Tying Up Loose Ends
We have produced and tracked a measure of prospective returns on equities that indicates those prospective returns have declined in line with bond yields. No doubt, if you are a stock bull, you don’t believe any of this, and further evidence is unlikely to change your mind, but we’ll produce some anyway. Exhibit 7 takes the prospective equity returns plotted in Exhibit 6 and compares them to realized returns over subsequent five-year periods.
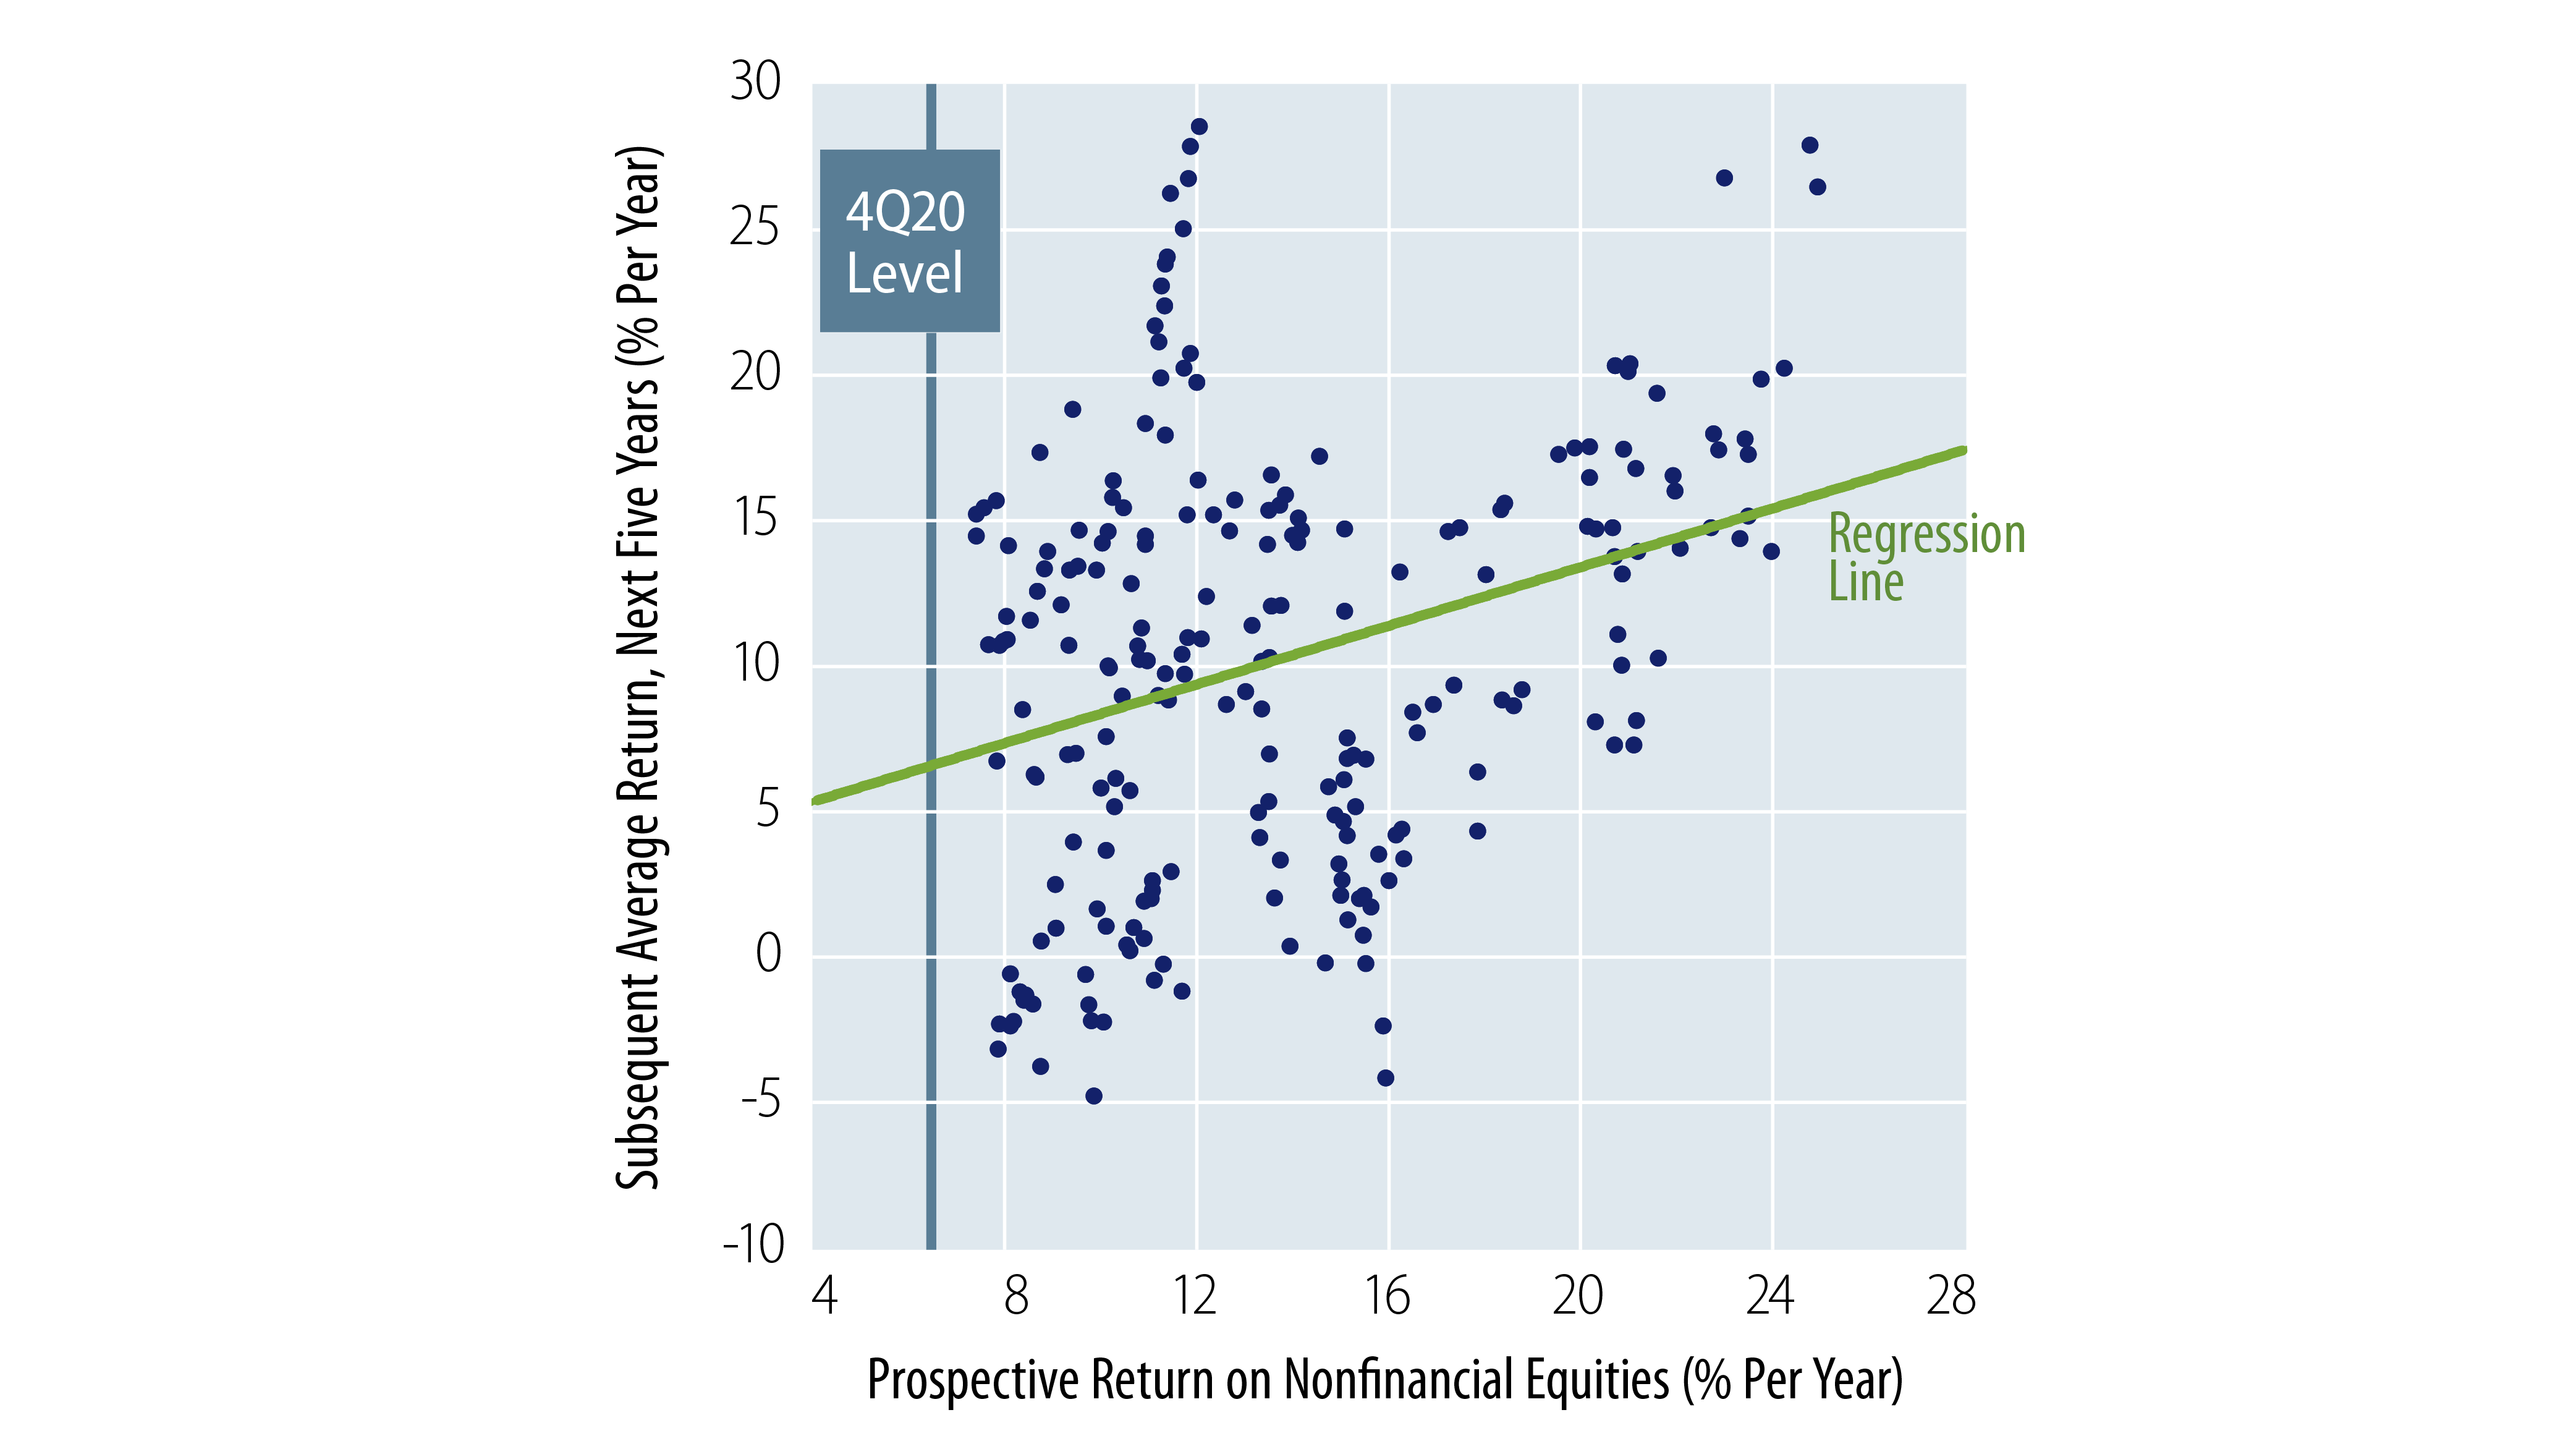
In other words, if our measure suggested prospective equity returns of, say, 8% annually at a point in time, what were actual realized stock returns over the following five years, and similarly for other points in time? We take five-year holding periods to try to abstract from short-term events buffeting the market. 10- or 20-year holding period returns would be preferable (less buffeted by short-term factors), but would also cut down the range of experience our chart can cover.
The scatter of dots displayed in Exhibit 7 is certainly suggestive of a direct relationship between our prospective returns measure and actual, subsequent returns. The higher the prospective equity return, the higher the subsequent realized return, and vice versa. There have been periods when high prospective returns did not (immediately) result in high realized returns, such as the early-1970s, when rising inflation battered stocks. There have been periods when low prospective returns did not (immediately) mean low realized returns, such as the 1990s bubble, when the market defied gravity—for a while. Generally, however, the dots plotted here tend to align along an upward-sloping arc, with the (computer-generated) trend line suggesting the typical relationship. This relationship is in line with financial market theory.
Based on market pricing as of December 31, 2020, one might expect broad equity markets to return 6.5% per year going forward. This beats the 3.2% yield available on long BBB bonds then, but not by as much as typically has been the case in history.
Meanwhile, we have not made any attempt to estimate prospective returns on other risk assets, such as alternatives, real estate, etc. We leave it to the reader to make the ultimate judgment there, but it would seem that the luster of hedge funds has dimmed in recent years, while real estate valuations seemed to have increased lately at least as much as have equity prices.
Conclusion
For a DB plan, which has a well-defined liability target for its asset allocation to meet or exceed, the level of yields per se does not matter at all. What matters are the yields available on its assets relative to those on its liabilities and the prospective returns on return-seeking assets relative to those on hedge assets. While fixed-income yields have declined across the board in recent years, prospective returns on equities (and other risk assets?) appear to have declined in tandem and just as much.
While long AA spreads have declined recently, the spread premium for long credit over DB liabilities has not declined. This indicates that long credit and long G/C portfolios are just as attractive as hedges of liabilities today as they were when yield levels were more elevated. Meanwhile, our best estimates are that the relative return premium for equities over bonds is relatively low at present, suggesting that this is not a propitious time for DB plans to be moving into equities. This is the simple message of LDI.
- In other words, spread duration is a dubious concept when applied to liability hedging. Historically, when spreads fluctuate, spreads for lower-quality bonds will move more than do spreads for higher-quality bonds. So, even if an allocation to credit has the same duration as a plan’s liabilities, thus ostensibly the same spread duration, the credit allocation will still typically fluctuate much more in value in response to spread changes than will a plan’s liabilities. This is a point we have made repeatedly in our previous papers over the years.
- The data in Exhibit 3 exclude financial sector output, and Exhibit 5 distinguishes between valuations in the nonfinancial and financial sectors. Given the torrent of regulations imposed on financials over the past 20 years intended to improve the safety of the banking system, the earnings prospects for financials are quite different from those for nonfinancials, so that this bifurcation of P/Es makes sense. These regulations improve the attractiveness of financial sector bonds even while they appear to hamper the prospects for bank stocks. So, our separate handling of nonfinancial and financial equities here does not at all conflict with our long-standing overweight to financial sector bonds.


