KEY TAKEAWAYS
- The present inflation experience differs from that of the late-1960s and 1970s in important respects.
- Then, inflation emerged after more than five years of fast growth and sharply lower unemployment than previously. Now, inflation’s emerged after one year of economic growth that failed to offset declines inflicted by Covid and despite an unemployment rate higher than previously.
- Current inflation gives workers and merchants cause for complaint in a way that its 1960s predecessor did not, inflicting declines in real incomes that were not seen in the late-1960s or early-1970s.
- There has been more disparity recently between goods and services price increases than was the case in the 1960s and 1970s—an indication of the monetary nature of the 1960s inflation versus the supply-constraint-driven nature of the current experience.
- Presently, after a hugely less buoyant recovery than the 1960s and with higher prices inflicting pain, prices will be under intense, downward pressure. With monetary tightening piling on as well, those effects will be even more intense.
By now, you have no doubt often heard that US inflation today is the worst since that of the late-1960s and 1970s. What you may not have heard amid all the hand-wringing and recriminations is that the current experience differs markedly and importantly from that of nearly 60 years ago. Here, we’ll detail some of those differences with an eye toward better understanding what we are going through and how we may be able to get out of it.
1960s’ Party versus 2020s’ Foundering
William McChesney Martin, Chairman of the Federal Reserve (Fed) in the 1960s, is known for saying that the Fed’s job was “to take away the punch bowl just as the party gets going.” He meant that right when economic growth was getting strongest and most frothy, with inflationary pressures building, it was the Fed’s job to put a damper on growth to prevent those inflationary pressures from sustaining or proliferating.
While it is questionable how successful McChesney Martin or his 1970s’ successors in that role were, the metaphor itself is accurate. Indeed, current Fed Chair Jerome Powell is intent on playing that same role. The problem is that while the US economy had indeed “partied heartily” in the 1960s, when inflation first started to stir then, current experience has been far less exuberant.
After a brief 1960-1961 recession that likely influenced the 1960 election outcome, the Kennedy-Johnson administration took office in early-1961 with a firm intent to boost economic growth and bring down unemployment. With an economy already emerging nicely from recession and boosted by stimulative administration policies, the effects were evident in the very rapid growth that followed.
From the cycle peak in 1Q1960 through 4Q1965, that is, even upon averaging recession declines with early-expansion growth, real GDP had enjoyed 4.9% average annual growth. Unemployment had dropped from a low of 5.2% at the April 1960 expansion peak to 4.0% as of December 1965.
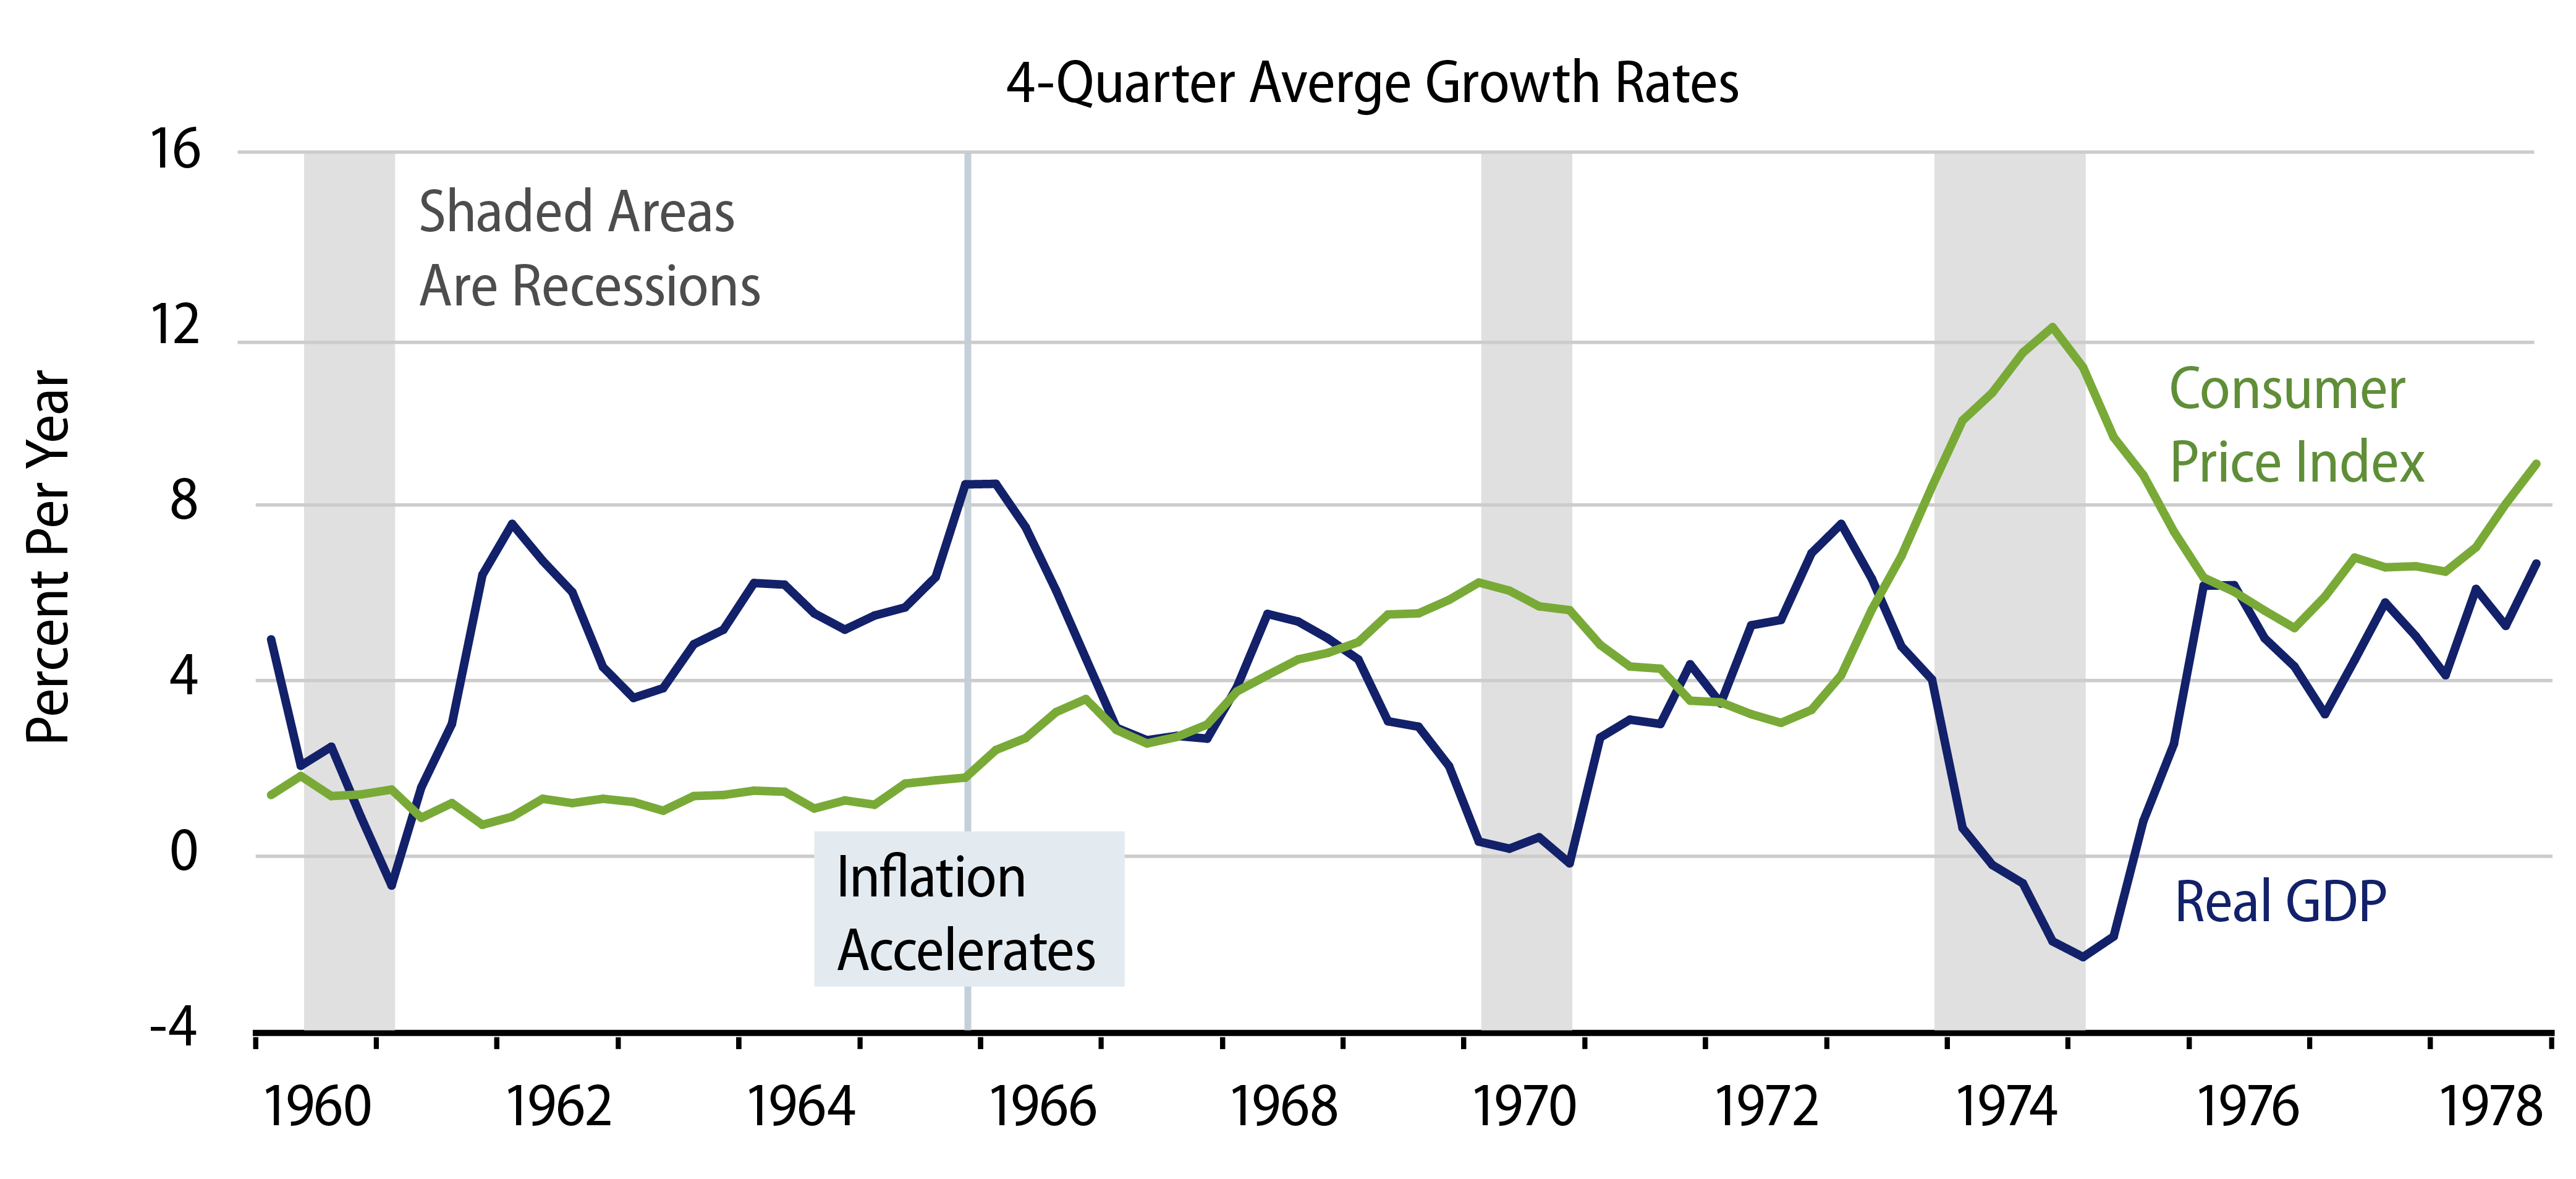
By any perspective, US economic growth had accelerated substantially, and, indeed, it was in 1965 that inflation began to pick up. After 1.2% average inflation over 1960-1964, inflation rose to 1.9% in 1965 and was headed sharply higher in 1969. At that point, the McChesney Martin Fed, true to his word, began to tap on the brakes. However, he was overruled by a President Lyndon Johnson focused on the 1968 election and financing the Vietnam War. With Fed restraint removed and federal policies stimulative, rapid growth resumed.
Despite a credit crunch slowdown induced by the Fed’s brief restraint, real GDP growth averaged 3.9% per year from 4Q1965 through the expansion peak in 3Q1969, this on top of the scorching growth of the preceding five years. Unemployment fell further, to 3.5%, even with a massive influx of maturing Baby Boomers clogging the labor force.
By 1969, CPI inflation had gotten above 6%. Not even the Johnson Administration could prevent the Fed from addressing that problem. Indeed, the US economy fell into recession in late-1969. Economic growth was much less buoyant in subsequent years than it had been in the 1960s.
The fact remains, though, that by the time inflation had become a cause célèbre in the late-1960s, the US economy had experienced its strongest run in recorded history, with real GDP growth averaging 4.5% per year in the nine and a half years from the 1Q1960 cycle peak to the 3Q1969 cycle peak. This compares to 2.8% peak-to-peak average economic growth over the seven-plus years of the two preceding 1950s business cycles.
Political rhetoric to the contrary notwithstanding, the current US economy has not experienced a growth surge anything remotely like the 1960s experience. Rather than a sharp acceleration, growth in the current expansion is decelerated on net from even that of the widely decried post- global financial crisis (GFC) expansion. Similarly, unemployment was still well above pre-Covid levels last year when inflation began to pick up.
Yes, GDP grew very strongly in 3Q2020. However, that growth followed an even sharper decline in GDP in 2Q2020. Even now, six quarters later, the economy has still not re-attained pre-Covid growth trends. Averaging recession and expansion together, as we did for the 1960s, real GDP growth averaged only 1.2% per year from 4Q2019 through 1Q2022. In comparison, even folding in the long, steep GFC recession with the sluggish post-GFC expansion, real GDP growth averaged 1.7% per year peak to peak between 2Q2008 and 4Q2019.
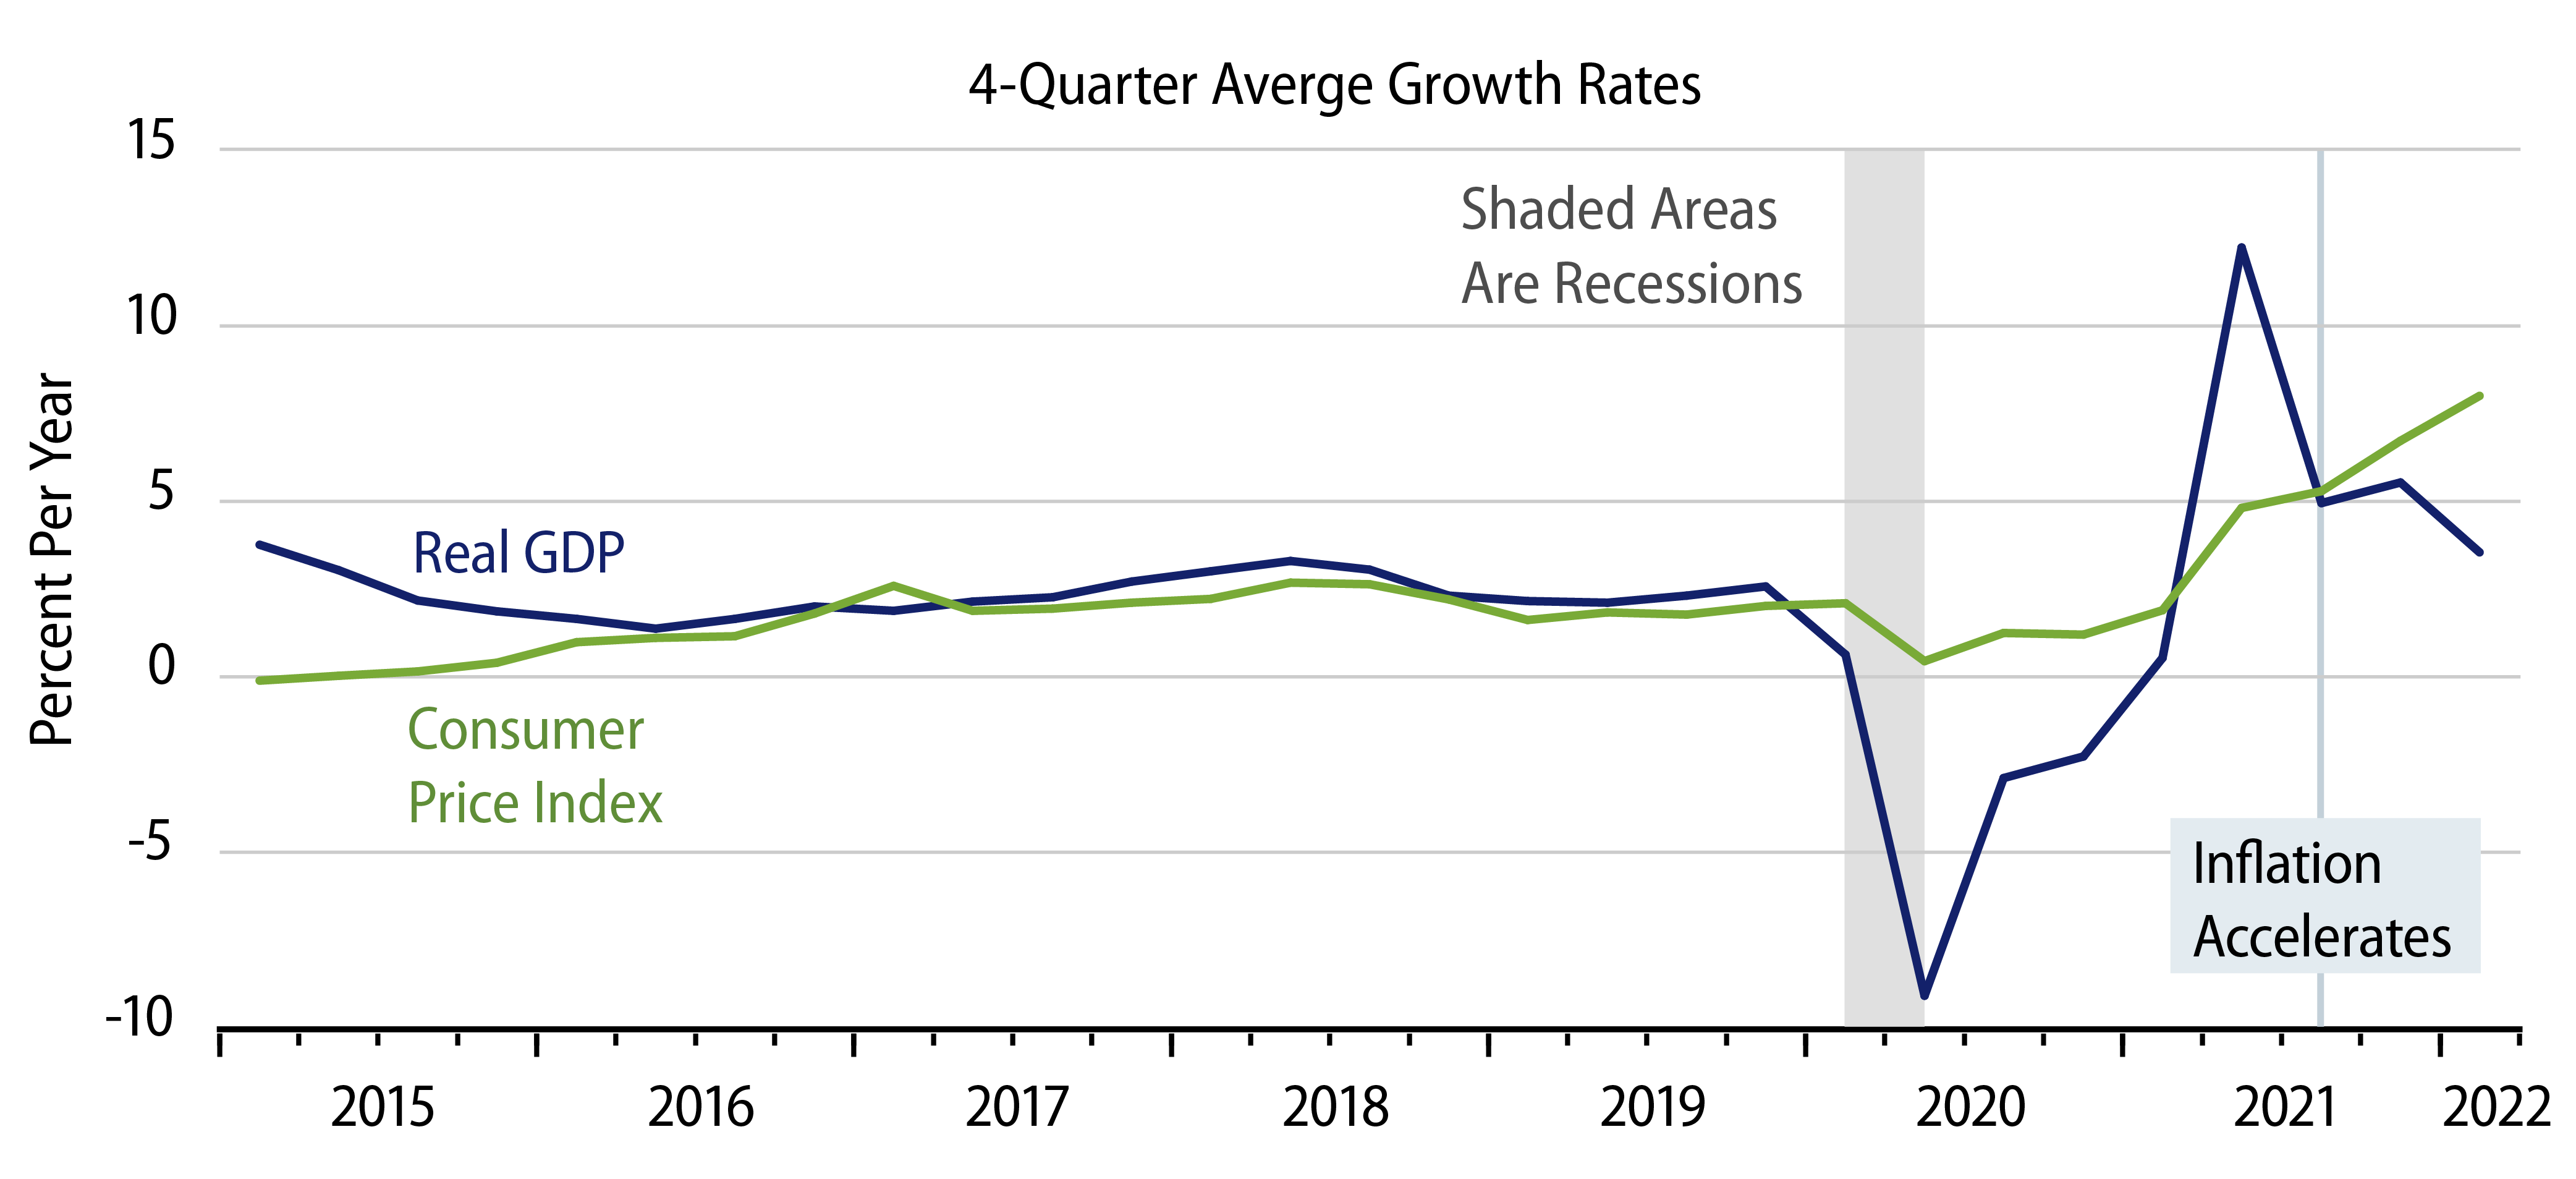
As for unemployment, it was at 3.5%, with stable inflation, in late-2019, just prior to the Covid outbreak. It was at 4.7% late last year, when inflation accelerated, and it has since dropped only to 3.6%—slightly higher than in December 2019.
In summary, in the late-1960s, inflation emerged only after more than five years of much faster growth and sharply lower unemployment than was seen previously. Presently, inflation emerged after only one year of economic growth that failed to fully offset the declines inflicted by the Covid recession and despite an unemployment rate higher than that in place prior to the recession. No parties this time.
The Pain of Higher Prices Then and Now
People always complain about inflation. J.M. Keynes said that inflation “engages all the hidden forces of economic law on the side of destruction, and it does so in a manner in which not one man in a million is able to diagnose.” In other words, workers see their wages rise and interpret that as a reward for their efforts, but any accompanying inflation is seen as a separate, malevolent development that robs them of hard-won benefits. Merchants feel the same way about higher costs draining the profits from higher prices they are able to charge.
Of course, unlike in Keynes’ time, modern media keep everyone all too aware of inflation. Folks are confounded by it anyway. And, in fact, the current inflation really does give workers and merchants cause for complaint in a way that its 1960s’ predecessor did not.
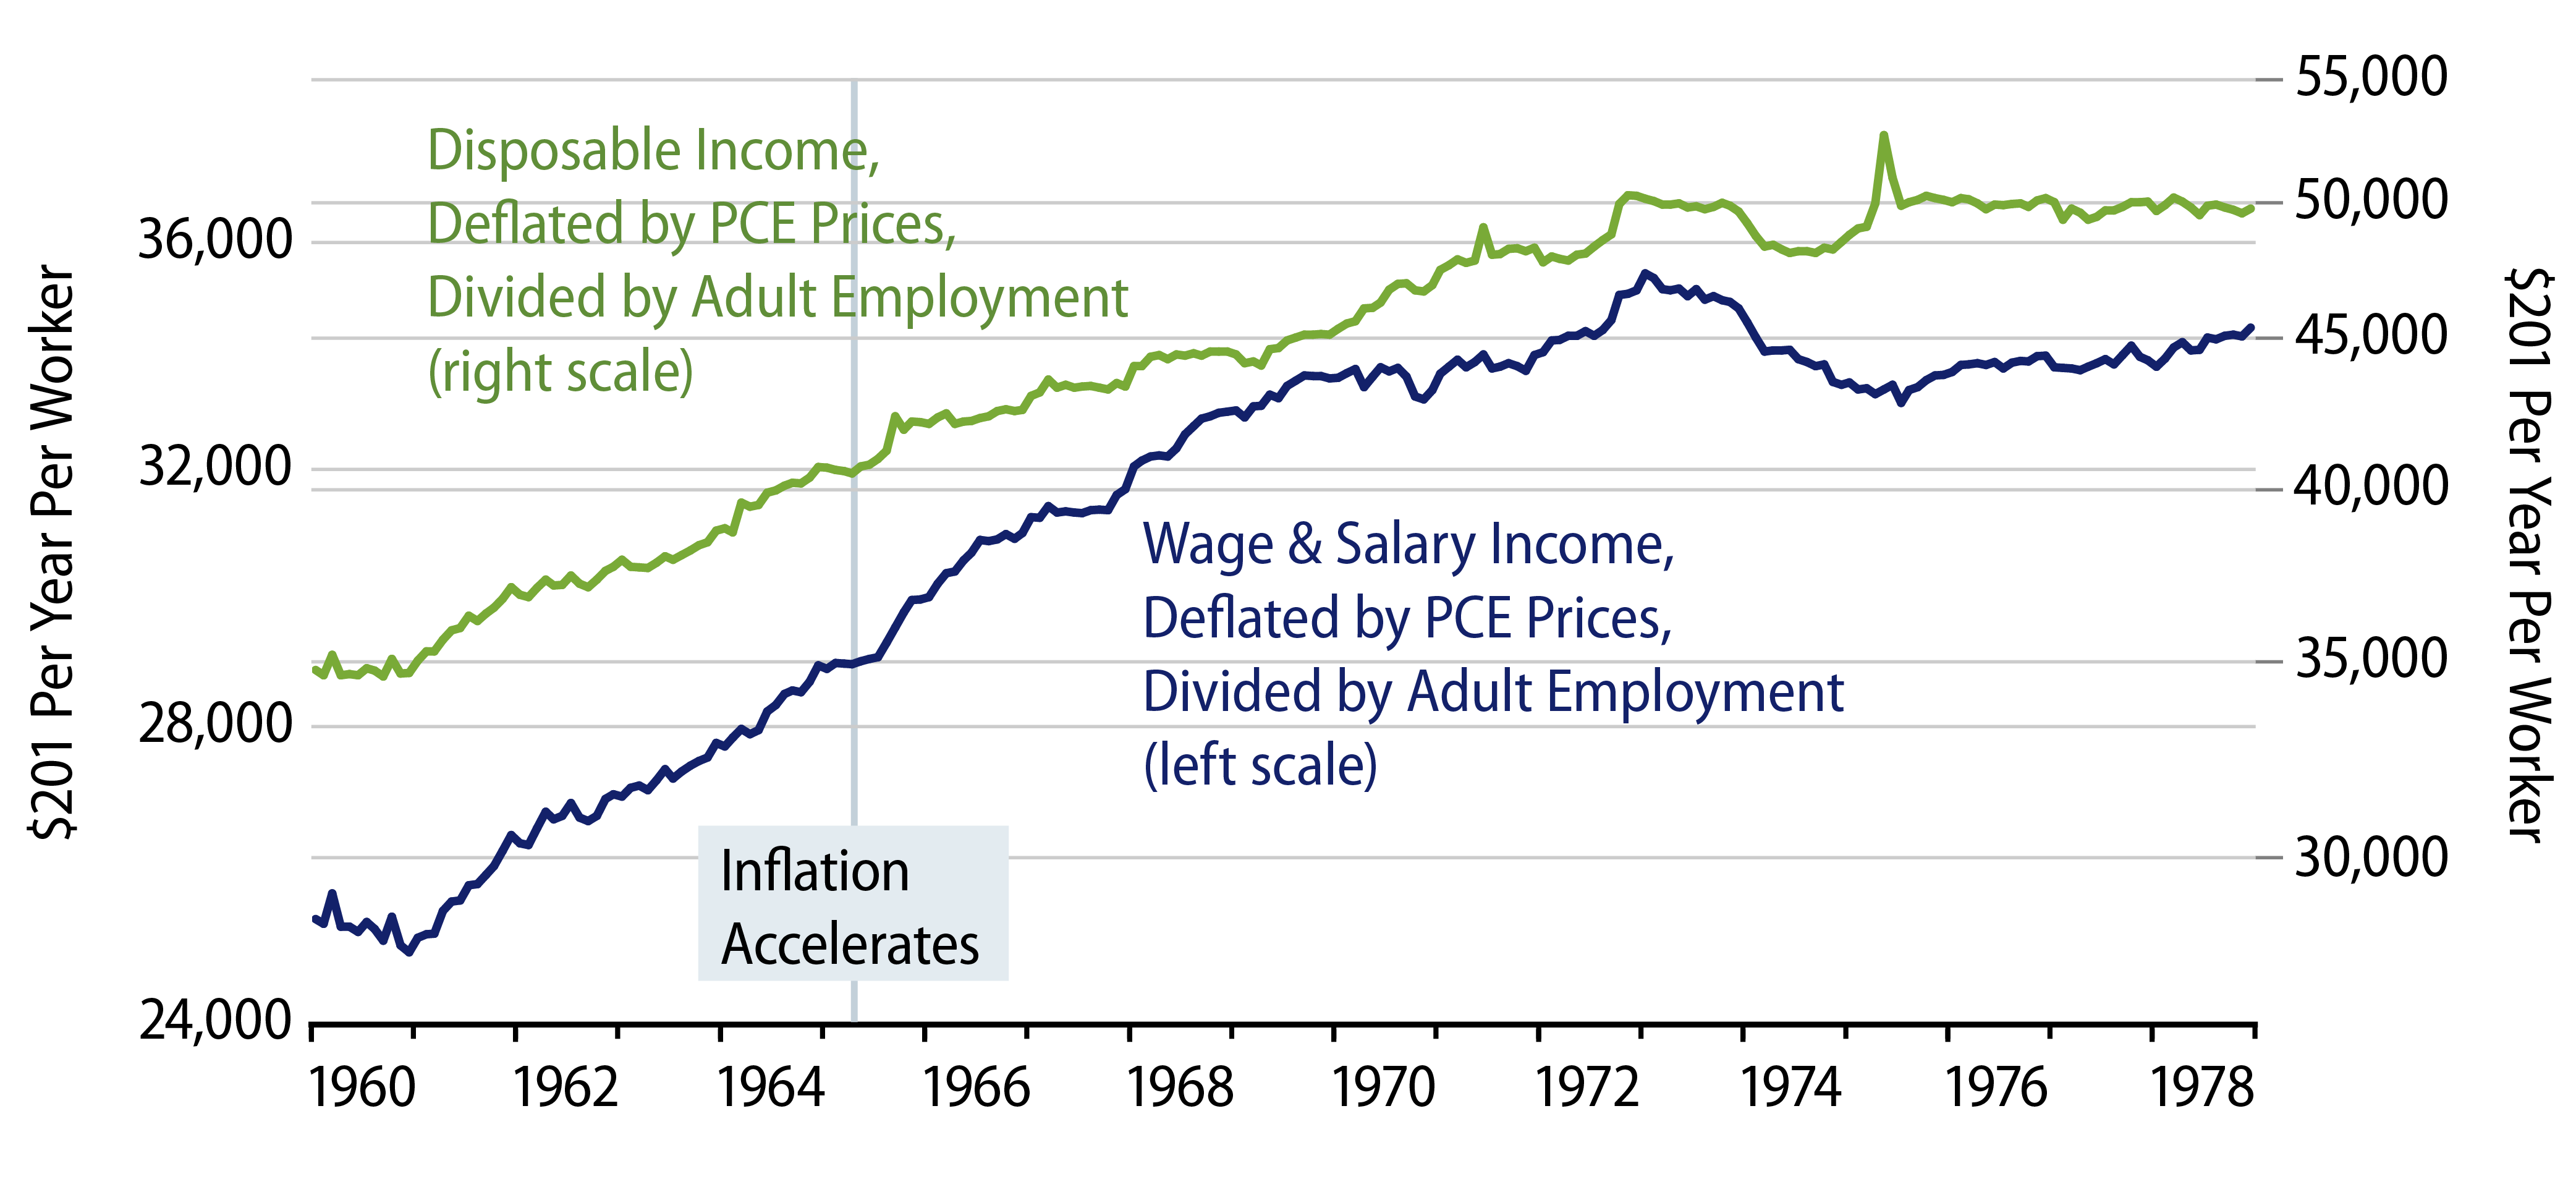
That is, amid the booming economy that drove inflation in the mid-1960s and after, workers’ wages and incomes were rising fast enough initially to more than offset the bite from higher prices. Exhibit 4 shows real per-worker income during the 1960s. Despite the acceleration in inflation, real incomes continued to grow rapidly during the early years of that inflation. Workers could grouse that inflation was biting into their income gains, but living standards were still rising despite the inflation.
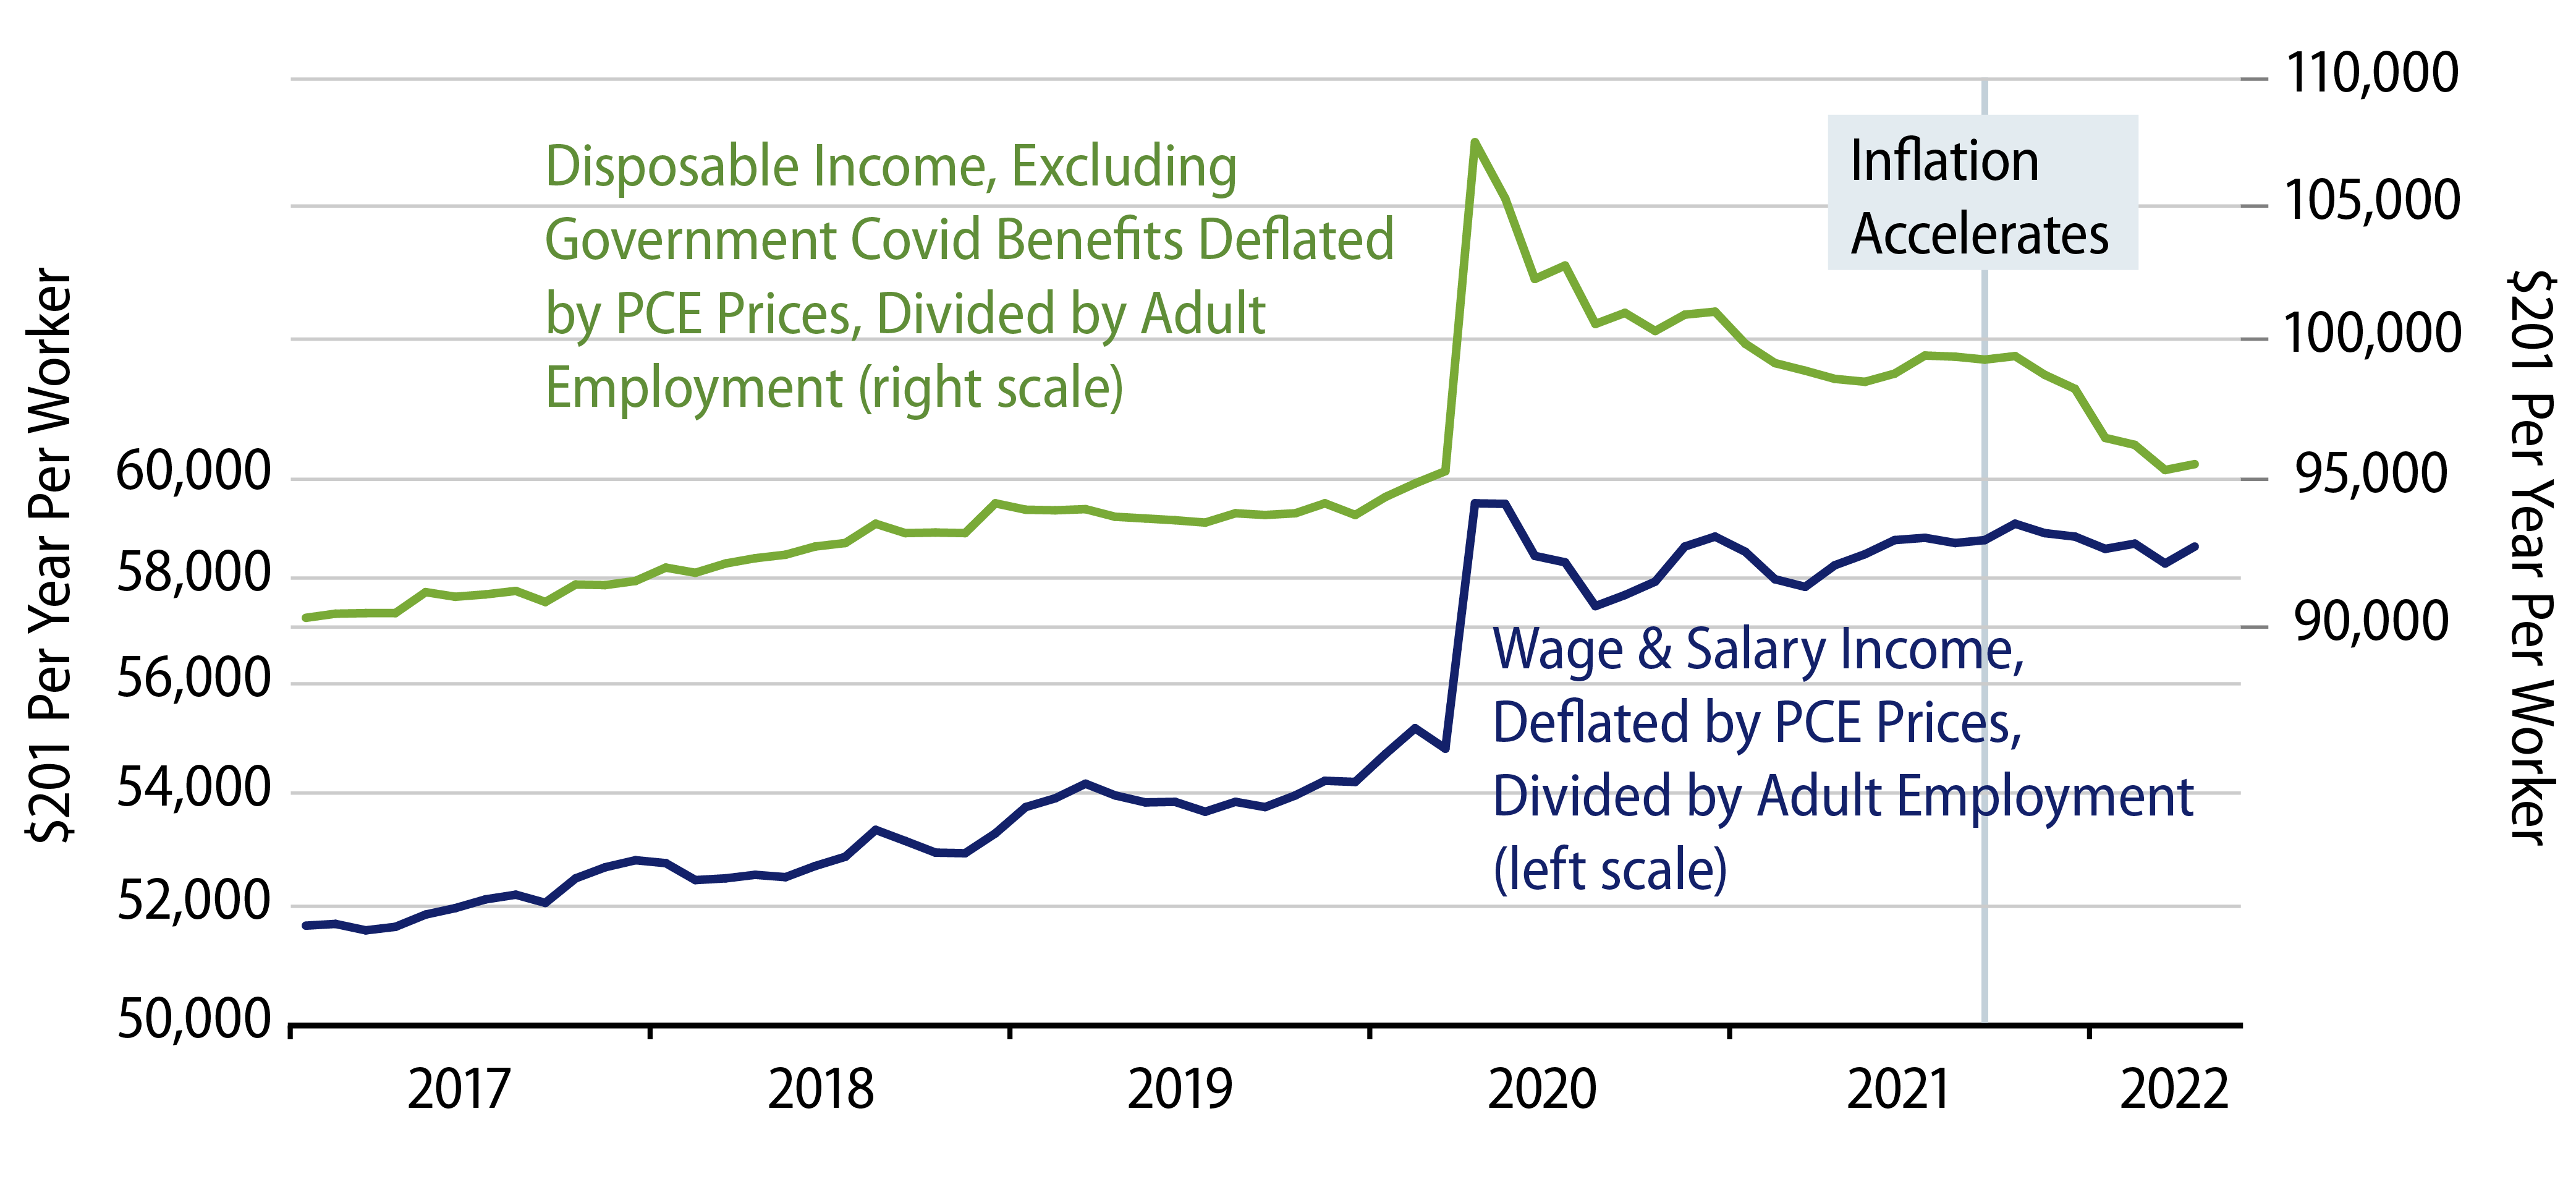
That is not happening presently. From the very outset of the current inflation episode, real per-worker incomes have been flat or falling. Even with purported excess demand for labor and “the hottest labor market in decades,” neither real wages nor real incomes have been able to increase recently in the face of rising prices. Unlike its predecessor 55 years ago, the current inflation is inflicting real economic pain on workers and merchants alike.
Parties and Hangovers
Most really good parties are followed by really bad hangovers. After the roaring growth of the 1960s with concomitant inflation, the 1970s saw a struggling economy and generally accelerating inflation.
General wage and price controls from August 1971 through 1972 severely distorted growth and pricing then. While most controls had been removed by late-1972, price ceilings were still in place in 1973 on domestic oil and gas production. So, when the Arab oil embargo in late-1973 led to sharp increases in global oil prices, price ceilings here in the US converted that into gas lines and rationing, further despoiling the economic environment.
Meanwhile, a US economy that had not experienced peacetime inflation since the California Gold Rush had to deal with effects of rising prices on labor contracts, tax codes and stock markets. Economic turmoil in the 1970s was perhaps on par with the supply-chain disruptions in still-restrained sectors we see today.
It is important to remember, however, that turmoil and energy shortages came only after nearly a decade of buoyant growth and only after eight years of accelerating inflation. That 1970s hangover succeeded a long, hardy party.
Presently, we are suffering through economic pains and dislocation comparable to—perhaps even more virulent than—that seen in the 1970s. And, as we have documented here, any “party” we have enjoyed while getting here has been dramatically shorter and certainly less exuberant than what the 1960s provided.
That contrast is what has led us, in posts filed over the past two years, to attribute the inflation to factors other than monetary policy. Admittedly, the Fed was trying to stimulate growth and inflation two years ago when it embarked on the latest rounds of quantitative easing (QE). However, if those efforts had really been successful, we should have seen more party and less pain than what has been the case.
Inflation Much More Dispersed Now
A famous adage is that “A rising tide lifts all boats.” Apply this maxim to the effects of monetary policy, and the resulting principle is that expansionary monetary policy tends to stimulate faster spending, thus faster price increases essentially everywhere in the economy. Money is fungible. It doesn’t just stay in one sector when it is circulating.
One aspect of a monetary inflation is that it generates faster price increases across the board, as much in one sector as another. We would argue that this was true of the inflationary episode of the 1960s and after. It is NOT true of the current experience. It would be beyond the scope of this analysis to exhaustively analyze the item-by-item dispersion of price increases at various points 55 years ago and presently. However, a good indication can be provided by looking at aggregate inflation of goods and services.
It is well known that services prices typically rise faster than goods prices. This has been the case at all times and across all developed economies over the postwar era. This disparity seems to reflect faster productivity growth in manufacturing than in services, while both compete for the same labor. In any case, the charts in Exhibits 5 and 6 adjust for this disparity by plotting goods prices and services prices on different axes. For both measures, the span of the axes is the same, so an equal 1% acceleration or deceleration in goods and services inflation will show up as equal vertical movements on the charts.
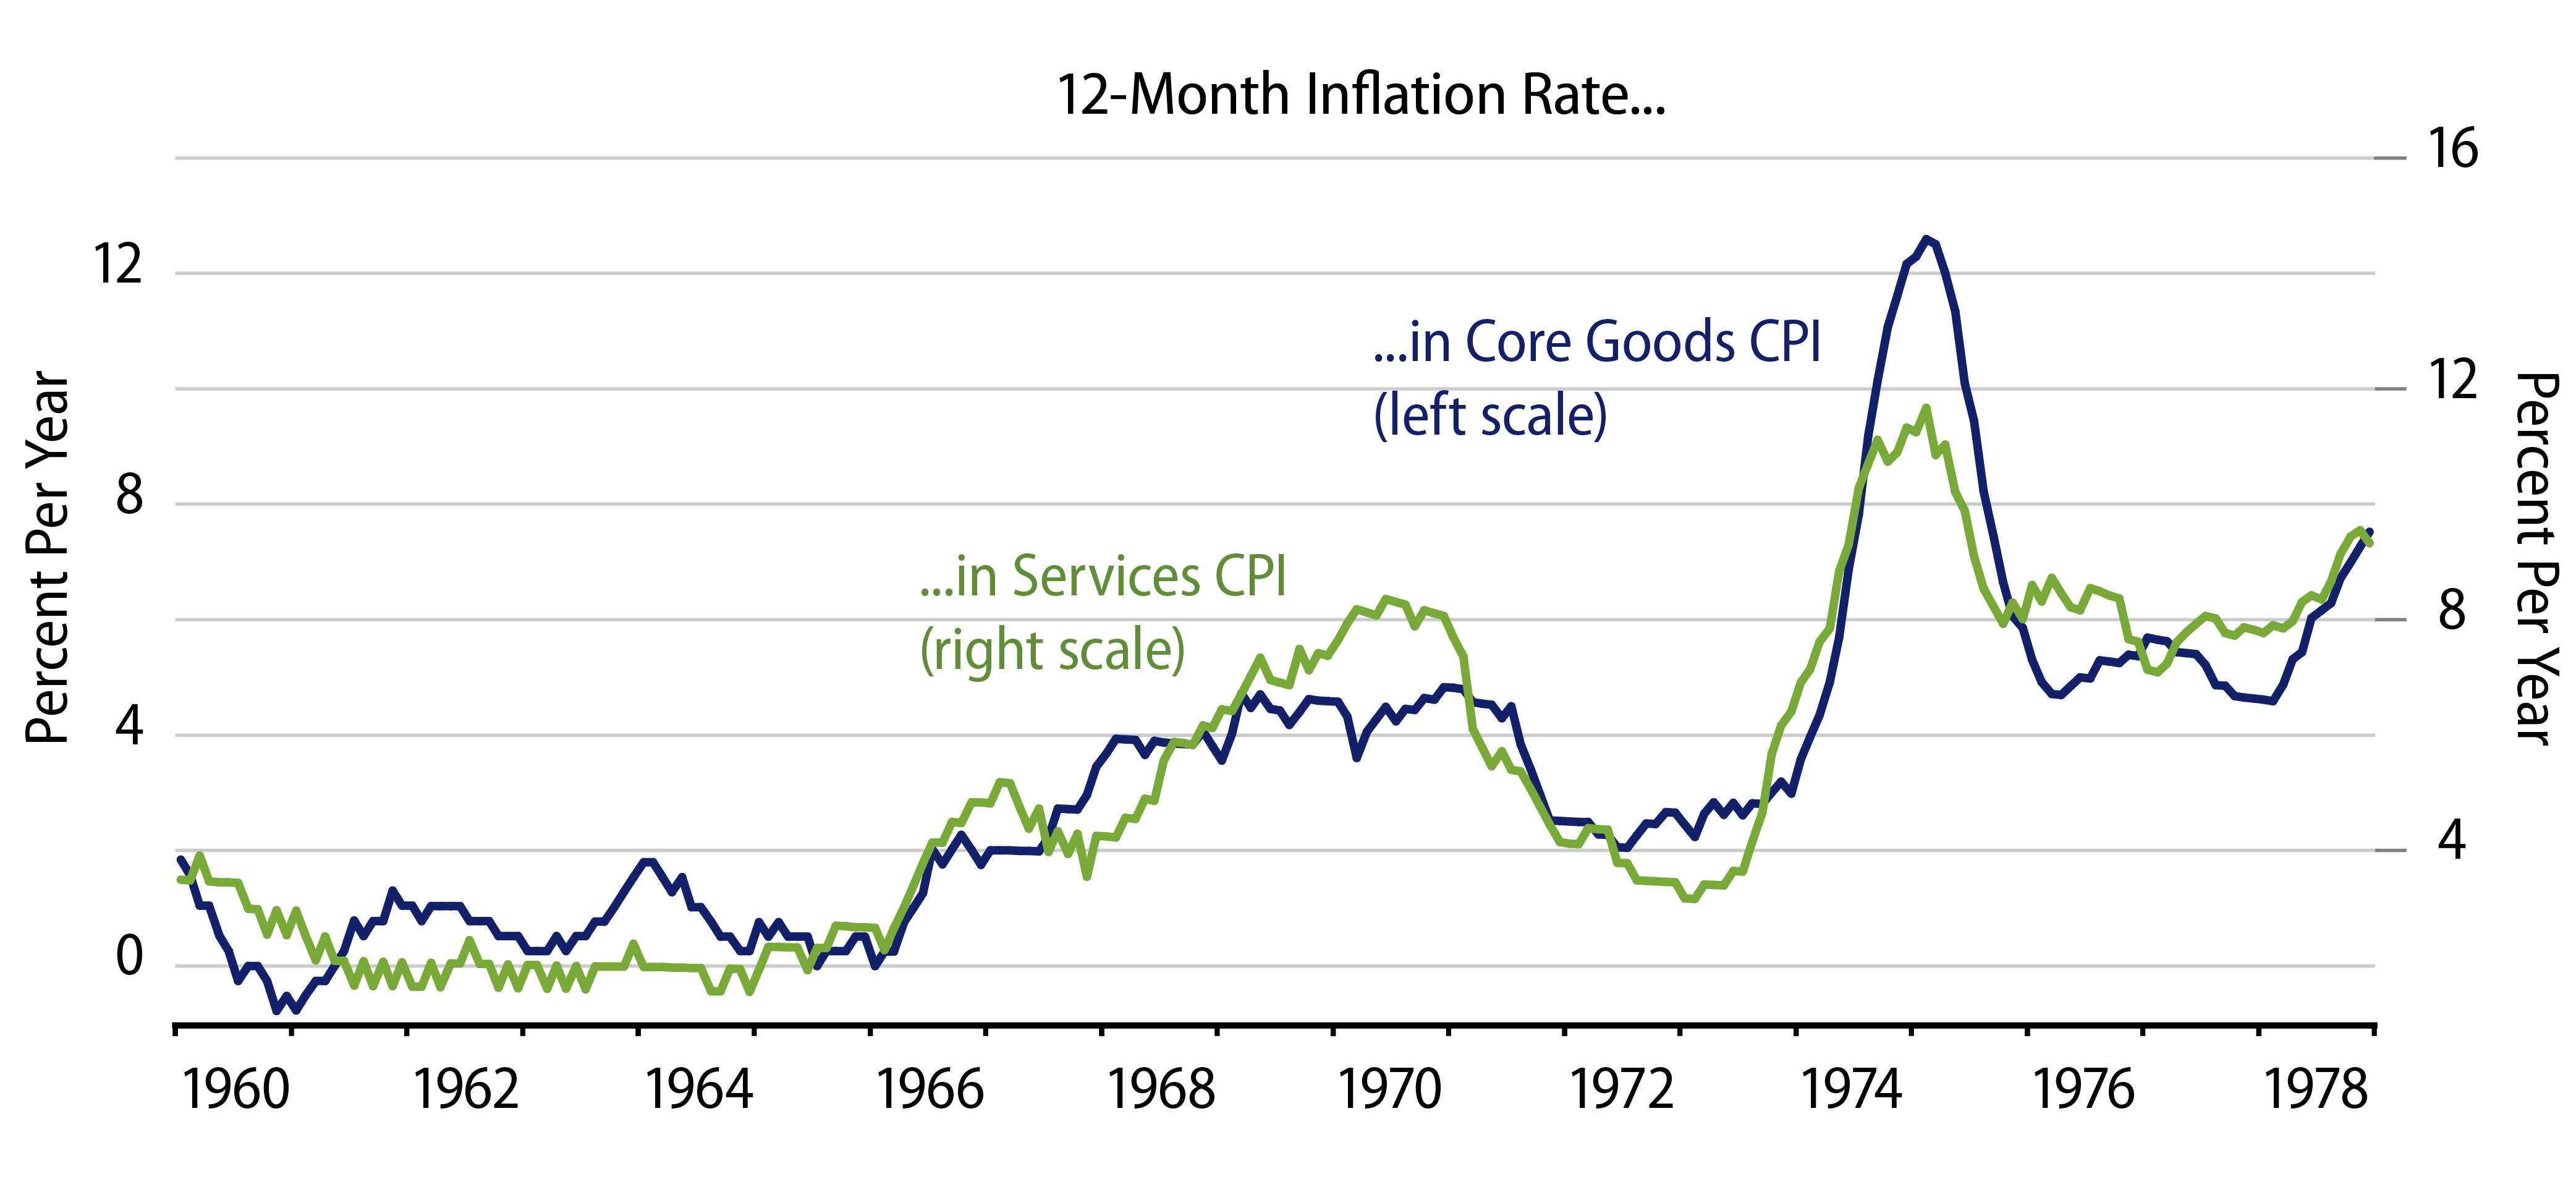
Indeed, when inflation took off and continued to accelerate in the 1960s and 1970s, goods and services prices tended to accelerate to the same extent. The “rising tide” of inflationary policy tended to influence both goods and services prices equally.
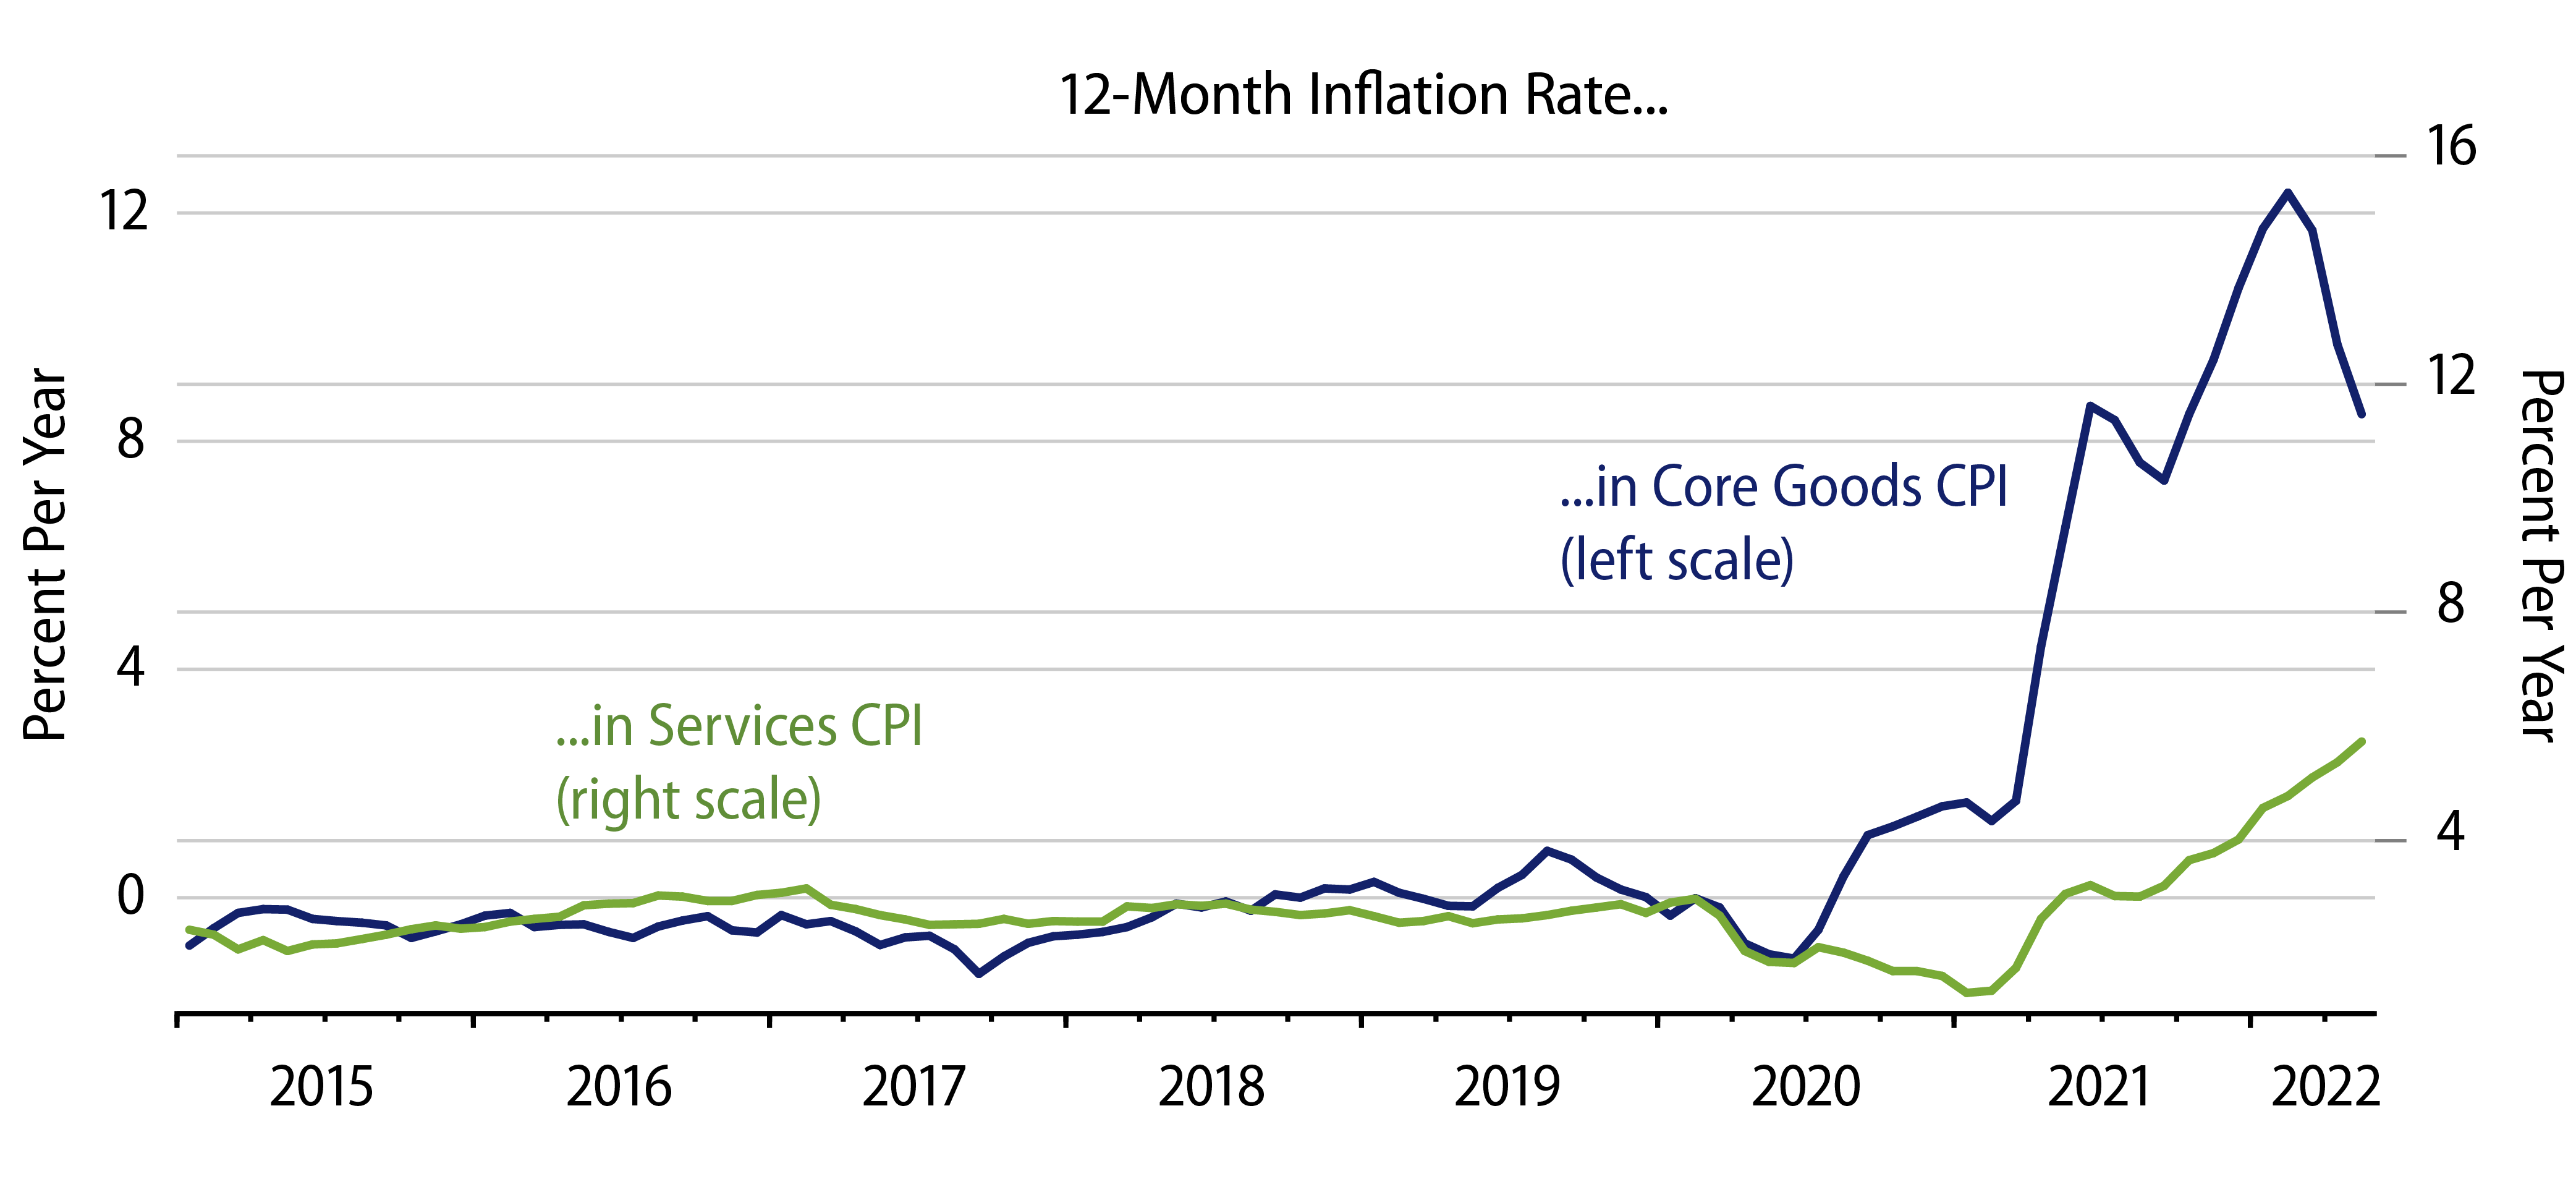
The experience has been dramatically different presently. Services prices decelerated more than goods prices during and just after the Covid shutdown, likely due to the fact that services venues were generally completely shut down through early-2021, while merchandise stores were allowed to stay open. Similarly, the emerging inflation of the last year-plus has been sharply more acute for goods prices over that time, likely reflecting the same shutdown factors (as well as a faster rebound in goods demand by consumers).
Similarly, goods prices have been decelerating some very recently even as services prices have accelerated. It is not unreasonable to think this reflects goods supply catching up with demand, while service outlets remain hamstrung by under-staffing even as demand there is recovering.
In any case, it is obvious that there has been vastly more disparity between goods and services prices over the last two years than was the case in the 1960s and even through most of the 1970s. Again, we take this as an indication of the monetary nature of the 1960s inflation versus the supply-constraint-driven nature of the current experience.
What To Do?
Expansive monetary policy drives both the impetus to raise wages and prices and the ability to pay those higher wages and prices without cutting into real growth or living standards. This is why real wages—and economic growth—were able to sustain their upward path in the early days of the 1960s’ inflation. That real wages are not keeping up with prices today is an indication that forces other than monetary policy are driving those price hikes.
Now, you might be saying, “Of course other factors are at work. We hear every day about supply-chain disruptions and geopolitical strife driving up prices.” Why are we emphasizing the influence of these supply deficiencies?
Because it doesn’t make much sense for monetary policy to tighten in response to non-monetary influences, even if these work to raise the aggregate price level. For example, a shortage of oil with attendant increases in oil and gas prices will cause economic pain all by itself. That pain, in turn, will work to dull the increase in oil and gas prices, as consumers and producers find ways to economize on energy usage, and that economization will also work to slow any impetus to non-energy prices rising as a result of energy supply shortfalls. Having monetary policy tighten on top of this pain is adding insult to injury as it does nothing to ease energy supplies, and it will just exacerbate the pain already caused.
Certainly, monetary policy should not ease in an attempt to mitigate the pain from the energy supply problems. That was the Fed’s response in the 1970s, and that was a mistake. However, it is something else again to tighten in response to energy supply shortfalls.
The Fed’s stated rationale for its current tightening regimen is that it wants to prevent a proliferation of inflation expectations in response to price increases caused by supply disruptions. In our view, this is a flimsy and unconvincing explanation. At best, it presumes that real world actors are unable to distinguish the sustained inflation resulting from profligate policy and the temporary, more painful burst of prices resulting from supply dislocations.
Now, even if you disagree with our assessment that Fed policies are not the cause of the current inflation, the prognosis is much the same. The pain evinced in the economy at present presages coming improvements—i.e., declines—in inflation. Even in the late-1960s and 1970s, inflation came down substantially and fairly quickly when the economy slowed, and that occurred even in 1969-1970, coming off many years of very rapid growth and elevated household incomes. The problem with bringing inflation down for good in the 1970s was not the stickiness of prices, but rather the inability of politicians to stick with anti-inflation policies long enough for them to lick inflation once and for all.
Presently, after a hugely less buoyant recovery than the 1960s and with higher prices inflicting pain on consumers and merchants alike, prices will be under similar, likely more intense, downward pressure. With monetary tightening piling on as well, those effects will be even more intense. This just isn’t the same hangover as after the party 55 years ago.


