

KEY TAKEAWAYS
- We see no compelling reason to share the Fed’s optimism that inflation will soon be 2% or higher.
- If the Fed implements a change to start using average inflation targeting, as it has been discussing, we think the case for lower rates this year is even more compelling.
- Faster nominal spending growth that would make either sustained higher inflation or sustained higher economic growth has failed to occur.
- There have been pronounced slowings in a number of prominent components of inflation, and there is reason to think that these could be sustained.
- The longer observed inflation rates stay at or below the current range, the more pressure there will be on the Fed to reflect that reality in its policy.
US inflation has been declining for almost a year, and is well below the Federal Reserve’s (Fed) stated inflation target of 2%. Comments by the Fed and others claim that this decline is “transitory,” and Fed officials are confident that inflation will soon move back to and above the 2% range. We see no compelling reason to share the Fed’s optimism that inflation will soon be 2% or higher, and we believe continued below-target inflation should move the Fed to a policy response.
Inflation’s Downward Path
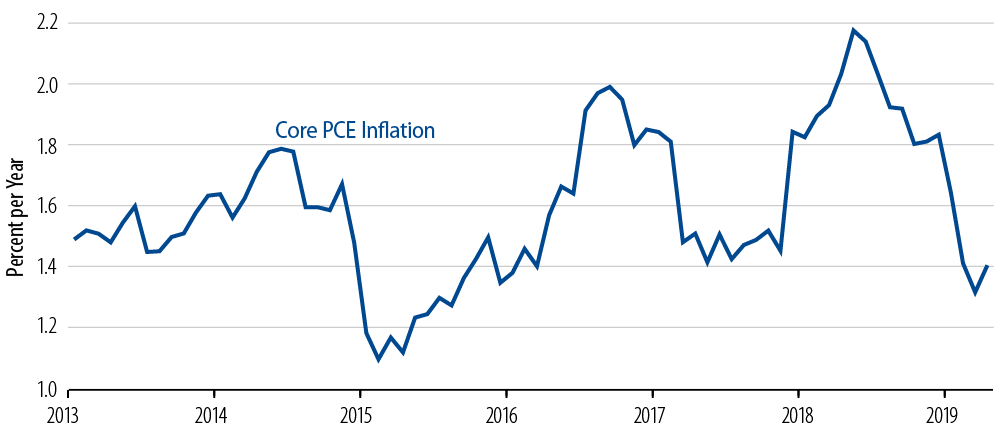
The Fed’s professed primary measure of inflation is the core index for Personal Consumption Expenditures, or core PCE. This measure excludes food and energy prices (hence core inflation), utilizing price data collected by the Bureau of Economic Analysis (BEA) as opposed to the Consumer Price Index data reported by the Bureau of Labor Statistics.
For the 12 months through April 2019, this measure shows 1.57% inflation. This is down from a 2.03% rate for the 12 months through September 2018. More interestingly, monthly inflation has been running noticeably lower since mid-2018. In the last nine months since July 2018, the average annualized inflation rate for core PCE is a mere 1.40%.
So, the current 1.57% 12-month inflation rate is a blend of 2.06% annualized inflation over May-July 2018 and a much lower rate recently. Should monthly inflation rates in the next few months run at rates similar to those of recent months, the 12-month average rate of inflation will continue to work lower. That is, a 2.06% annualized rate of core inflation over the next three months would leave the 12-month rate at 1.57% through July 2019. A 1.40% rate over the next three months would pull the 12-month rate down to 1.40% through July. Obviously, inflation rates in between 1.40% and 2.06% over the next three months would leave 12-month inflation rates somewhere in between 1.40% and 1.57% through July.
This matters because the Fed has been publicly following a professed 2% target rate for core PCE. Only fleetingly over the last seven years has actual inflation been near that target, let alone sustained it…and recent experience could be pulling actual experience as far below target as we have ever been since the 2% target was first announced.
One can question whether it is wise to want inflation higher than it already is (and we also question it). Nevertheless, these targets are a well-publicized aspect of Fed policymaking, and one would think that chronic below-target inflation would eventually elicit a Fed policy response.
This is especially true given that Fed officials have recently been talking up the idea of targeting 2% average inflation over time, so that if inflation runs below target for some length of time, a commensurately long run of above-target inflation would then be warranted. Indeed, the Fed this month held a conference to discuss whether and how to implement such average inflation targeting (AIT) strategies.
Of course, various Wall Street analysts and some Fed officials themselves firmly believe that the current declines in inflation are transitory, and that inflation will be rising by the end of this year. Fed Chair Jerome Powell himself has remarked to this effect. But what if they are wrong? What if the current run of especially low inflation is sustained? Given the importance of below-target inflation discussed above, it certainly appears that further sustenance of inflation around recent rates would have impact on Fed policy.
This paper attempts to assess the chances that the recent run of 1.5% or so inflation is sustained. We’ll identify the price components that have driven the recent deceleration and analyze whether these look to be merely transitory or, rather, more meaningful. We’ll also discuss price components that may serve to provide upward impetus to inflation rates in coming months. Last, we’ll touch briefly on inflation fundamentals.
In the final analysis, it is a coin flip whether core PCE inflation remains around 1.5% or works somewhat higher. However, we think it is likely that inflation will remain below the 2% target. The recent run of experience may have pulled inflation below sustainable rates…but maybe not. In any case, we believe “sustainable” inflation rates are below 2%, and that in itself could be an issue for Fed decision making.
Inflation Has Been Declining Since Mid-2018
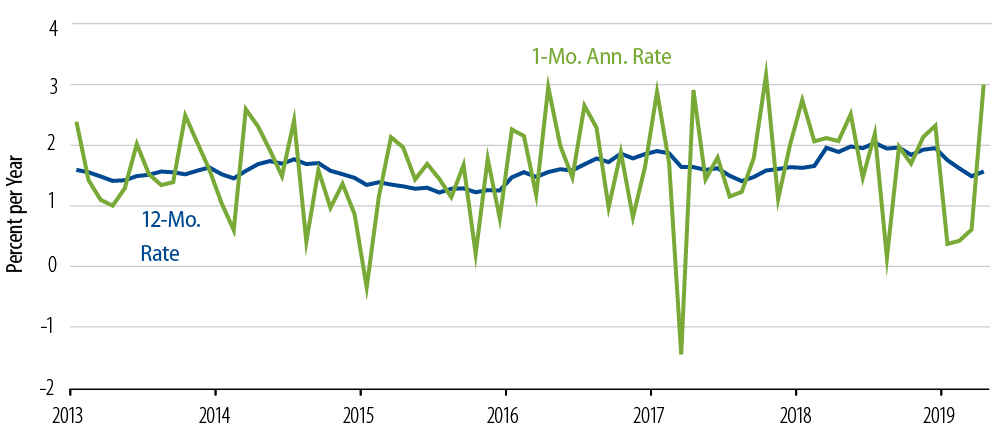
When discussing inflation, popular commentary typically focuses on a 12-month average rate of inflation. This “data filter” is long enough to smooth out most short-term, random influences. However, by taking a 12-month average, this filter will generally be slow to reflect changes in trend. By the same token, an outsized monthly fluctuation in inflation will continue to be reflected in this filter for 12 months even if it is not sustained.
Exhibit 1 attempts to get around the shortcomings of the 12-month inflation filter by showing both one-month and 12-month annualized inflation rates for the core PCE price index. In the chart, the 12-month inflation rate has been heading down since January 2019. However, the one-month rates, for all their volatility, show a clear tendency to decline starting in June 2018 or perhaps even earlier.
Indeed, the one-month inflation rates did not show any clear tendency to accelerate in 2017 or early 2018, despite the tick up in 12-month inflation rates then. Rather, that 12-month rate began to pick up in March 2018, when the especially low inflation of March 2017 fell out of this filter and when especially high inflation rates in November 2017 and January 2018 occurred.
Were those outsized increases in monthly inflation in November 2017 and January 2018 really a meaningful flare-up of inflation or merely monthly statistical noise? Certainly, consensus and Fed opinion dismissed especially low inflation in March 2017 as noise, but they embraced the November 2017 and January 2018 spikes as proof of their accelerating-inflation calls. In retrospect, both appear to be spurious, yet both affected 12-month inflation rates for a while, before falling out of the price index.
Some deem the recent slowing in inflation be just another “random” blip. However, it has already been sustained longer than any of the short-term ups and downs of 2017, 2018 or earlier. As stated above, inflation rates have been especially low on average over the last nine months (August 2018 through April 2019).
What specifics within the price index have driven this slowing? We’ll look at the specifics of the core PCE price index to answer this question. Since the drop in inflation is a phenomenon that has emerged over the last nine months, we’ll look at nine-month inflation rates for the various components in order to better identify just whence this slowing has come.
Why the Recent Decline In Inflation?
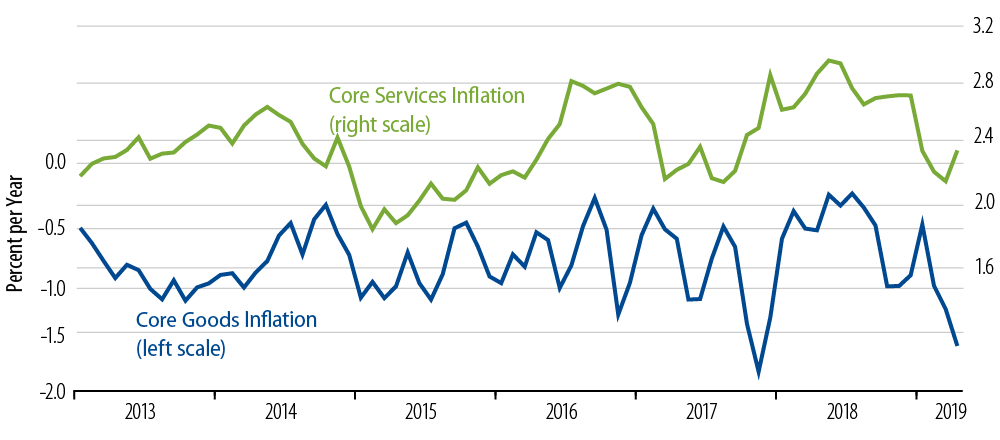
Exhibit 3 splits core PCE inflation into goods and services components. Goods and services account for 24% and 76%, respectively, of the core PCE price index as of April 2019. As seen in Exhibit 3, inflation for both components has decelerated over the past nine months by close to a percentage point. The slowing in goods price inflation may be merely continued oscillation around an average rate of about -0.7% (more on this below). The services slowing looks like a more substantive change, the first such slowing in two years.
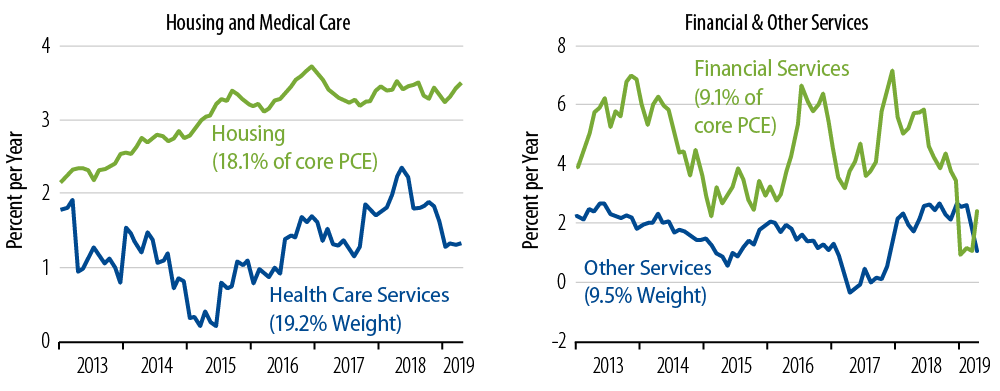
So, which components of services inflation have driven this? The answer is health care and financial services. The charts in Exhibit 4 show the four largest components of services, totaling 56% of the 76% total provided by services. Of these four, housing and “other services” show no recent deceleration to speak of. However, both health care (blue line, left chart) and financial services (green line, right chart) have decelerated substantially in recent months. Both of these sectors also showed decelerating price increases in late 2014 and early 2017, when services inflation last decelerated. The recent decelerations are perhaps more substantive than those seen previously.
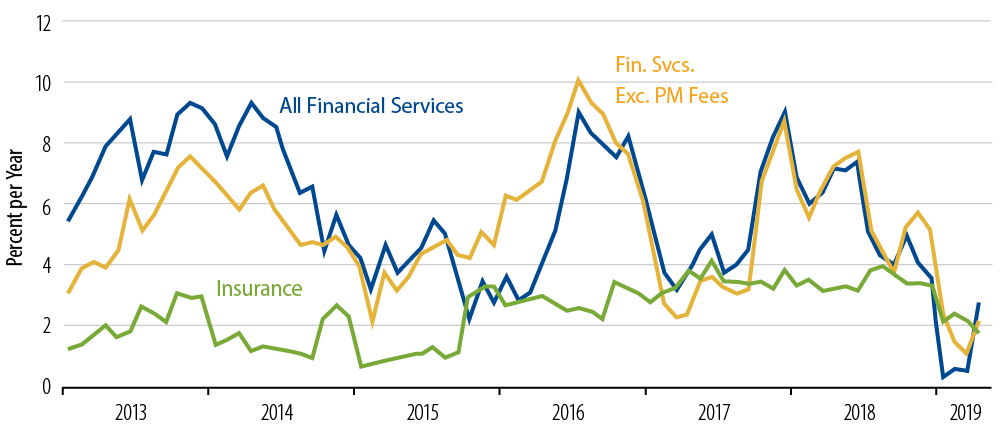
Financial Services
For financial services, recent price slowing has gone much further than what was seen in 2017 or 2014. The slowing here has been described as “transitory” because of the very sharp declines for estimated portfolio management fees. However, as you can see in Exhibit 5, there is much more to the deceleration in financial services prices than portfolio management fees alone.
Yes, the decline in portfolio management fees had helped reduce financial services inflation to a scant 1.4% annualized rate through March, but the April rebound there erased all below-average performance (blue line). Even upon excluding these fees, remaining financial services inflation has still slowed sharply over the last nine months (yellow line). Similarly, insurance costs have decelerated as well, albeit more recently and more mildly.
Through the April data, portfolio management fees have actually been an upward impetus to financial services inflation (and core PCE) over the last nine months, yet we have nevertheless seen inflation decelerate noticeably over this span. The financial service price data show a broad-based and sustained slowing. There is reason to expect it to continue.
Health Care
Some have asserted that Medicaid assistance under the Affordable Care Act (ACA) has held down reported medical care inflation and that the expiration of this assistance will exert upward pressure on health care pricing. It is hard to see evidence of such effects in the actual data plotted in Exhibit 4. The ACA went into effect in late-2013, and, yes, health care inflation decelerated in 2014. However, that deceleration in 2014 looks like merely a continuation of a decelerating trend that had been in place for at least four years prior to the emergence of the ACA. Meanwhile, after that one year of slowing, health care inflation then rose over 2015-2017, only to begin to decelerate again over the last year.
The PCE Health Care Price Index includes medical spending on behalf of consumers. This is in contrast to the CPI index, which only includes out-of-pocket consumer spending on health care. Including spending on behalf of consumers—primarily by Medicare and Medicaid companies—as well as out-of-pocket outlays gives health care a much larger weight in core PCE than in core CPI. It also brings government policy initiatives into the mix. It is because health care outlays paid by Medicaid have been thought to have held down prices that the ACA is said to have reduced reported health care inflation.
However, again, the timing of accelerations and decelerations in health care inflation would appear to be at odds with an assertion that the ACA has served to reduce health care inflation. Furthermore, while ACA-related changes to government health care expenditures will be completely phased out by the end of this year, those phase-outs have been gradually imposed for some time now, and yet, again, health care inflation has been trending down for the last year. At a minimum, this fact casts doubt on any forecast for a future acceleration relying on regulatory changes alone. Slowing health care inflation could well be sustained.
Goods Prices
As suggested earlier, the recent declines in core goods price inflation are less “news” than those for services. The nine-month inflation rates for goods prices shown in Exhibit 3 have typically oscillated up and down every few months, with a central tendency since 2014 for a -0.76% per year decline. So, the recent experience of a -1.47% decline is not radically different from the experience of the last four-plus years. Were goods inflation to revert to a -0.76% per year, that would add about 0.14% to core PCE inflation.
What might cause goods inflation (deflation) to stay relatively low? Well, the manufacturing sector has begun to soften again in recent months, following buoyant growth in 2017-2018. Weak demand conditions could well keep manufactured goods prices especially weak, thence goods deflation overall.
On the other side of the ledger, the recent step-up in trade tensions and tariffs between the US and China could impart upward pressure on trade-goods prices. Even this is not a sure thing. US imports from China have been declining over recent months even before the tariff imposition. It may be that Chinese producers will not perceive sufficient pricing power to pass along increased tariff costs to purchases, especially if rival producers in Korea, Vietnam and other Southeast Asian economies see the US-China discord as an opportunity to increase market share in the US at the expense of Chinese producers. Similarly, US producers negatively impacted by Chinese tariffs may seek to increase sales in the US and reduce domestic prices to do so.
So, the outlook for goods prices is a mixed bag. Something has contributed to a renewed slowing in domestic goods prices in recent months, even with trade friction looming. That something may not quickly dissipate in the reality of tariffs and retaliatory tariffs. Furthermore, the recent decline in US goods inflation has been eclipsed in recent months by a more pronounced slowing in services prices. Regardless of how tariff effects and factory weakness play out, services prices will probably be the more center-stage phenomenon in determining core inflation in months to come.
Transportation Services
While core inflation measures exclude gasoline and heating oil prices, energy price fluctuations can still influence core inflation through factors such as transportation services prices. Transportation fares comprise about 1.3% of core PCE, and fuel costs account for the bulk of these.
Weakening energy prices over the past year were likely a contributor to the recent weakness in public transportation costs, reducing core PCE inflation by as much as 0.05%. With oil prices bouncing in early-2019, there is a chance of that negative influence being reversed. Then again, oil prices have headed back lower more recently.
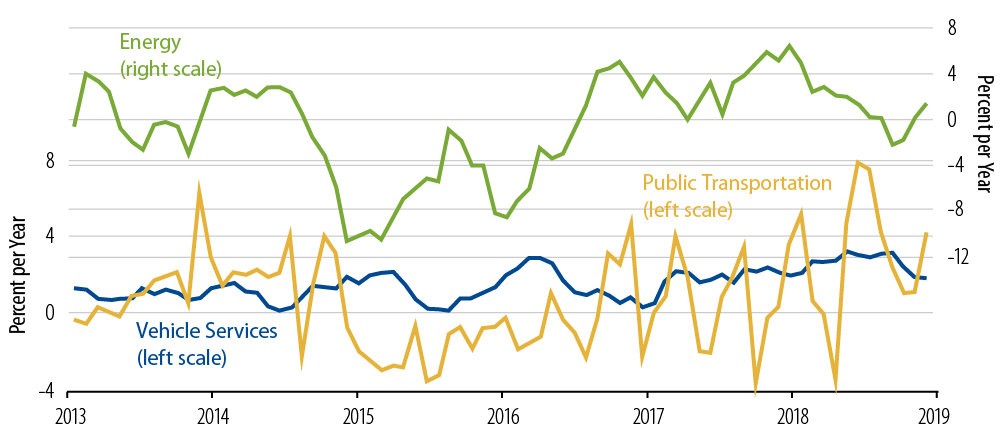
Meanwhile, within total transportation inflation, motor vehicle services carry almost twice as much weight as public transportation services. Motor vehicle services would seem to be negatively correlated to energy prices, if anything. In line with this, motor vehicle service costs have decelerated in recent months, even as oil prices were bouncing.
Public transportation costs are a possible upward impetus on core inflation in the months to come, but they are unlikely to be a significant effect. Meanwhile, rising public transportation costs are dependent on steadily rising oil prices, which are not a sure thing.
Inflation Fundamentals
The previous few sections of this paper have taken what is essentially a “bean counting” approach, exploring the various sectors where prices have decelerated most noticeably. However, inflation is a macro-phenomenon, so it is good to keep underlying (macro) forces in mind. One reason the Fed and the economic consensus look for inflation to rise is their abiding belief that monetary policy is expansive/accommodative, so that (some) inflationary pressures must eventually surface. However, that view is less based in economic theory than one might think.
The Fed has believed that interest rates are below “neutral” levels, so that monetary policy is expansive. This belief has nothing to do with the idea that low interest rates stimulate higher consumption and investment spending. That stimulus evaporated many years ago, when the lagged effects from interest rates to spending wore out. (Remember, short-term interest rates hit bottom more than 10 years ago.) Rather, rates are presently believed to be expansive solely because they are deemed to be below equilibrium/sustainable/neutral levels.
But who knows exactly what current, long-run equilibrium levels are, given how much slower average economic growth has been in the last decade than in preceding decades and given that inflation has been sustained at this expansion with rates not seen since the 1950s? If policy were indeed still expansive, then that must mean that the Fed is providing an excess supply of liquidity/money to the system. We should be seeing money and credit growing at ever-faster rates. We should see yields spiking upward whenever the pace of Fed liquidity provisions wanes. Most importantly, we should be seeing nominal spending growth in the economy constantly accelerating.
None of these phenomena are in evidence. Money growth had been stable over most of this expansion and has been decelerating in the last few years. Credit growth has been slow and stable. The Fed ceased expanding its balance sheet almost five years ago, and yet term yields have shown no upward pressure since. Finally, growth in nominal spending and nominal GDP have been exceptionally slow and exceptionally stable throughout this expansion, and they are slowing, if anything, presently (Exhibit 7).

The typical “evidence” proffered to prove expansive policy is relatively low unemployment rates. However, 1) again, this proffer is directly contradicted by nominal spending rates which refuse to accelerate, 2) wage growth has been steadfastly non-explosive, straining credibility of claims that Fed policy is artificially stimulating labor demand and 3) claims of low unemployment do not sufficiently allow for observed demographic changes. The continued aging of Baby Boomers, the full integration of women into the labor force and the recent widespread non-participation of Millennials in the labor force have all worked to pull aggregate unemployment rates lower.
It is commonly pointed out that current unemployment rates are the lowest since 1969. However, look at the cohort-specific unemployment rates shown in Exhibit 8. Unemployment rates for prime-age male cohorts are still 1-3 percentage points higher than what was observed in 1969. Current aggregate unemployment rates rival those of 1969 only because the adult population is so much older now than it was in 1969 (cf. the decrease in young-cohort labor force shares from 1969 to 2019) and because women currently enjoy generally lower unemployment rates than men, whereas the opposite was the case in 1969.

If cohort-specific unemployment rates matched those of 1969, the overall male unemployment rate would be 2.4%, 1.3 percentage points lower than what we actually see presently. Similarly, the female unemployment is presently 0.4% percentage points lower than what it would be were 1969 age-demographics still in place.
The present labor force is much older than was that of 1969, and women no longer suffer the same labor force stigma they did then. These obvious facts cast into doubt the significance of the fact that unemployment is at 50-year lows. It is perhaps a stretch to implicitly impose 1969 male-cohort unemployment rates on today’s economy. The fact remains, though, that current aggregate unemployment rates are comparable to those of 1969 only because of the vast demographic changes the economy has undergone since then. Meanwhile, the continued placid paces of economic growth and inflation cast doubt on the relevance of current unemployment rates as indicators of “easy money.”
Conclusions
Since the early days of the expansion, the Fed has been targeting sustained higher inflation and, most of the time, sustained higher economic growth. Yet, the faster nominal spending growth that would make either of these possible has failed to occur. In recent years, Fed policy has moved toward tightening, if anything. The last rate cut was ten years ago, and the Fed has been raising rates for more than three years. The Fed has effectively been contracting its balance sheet for almost five years. Similarly, growth rates for the money stock and in bank credit have been decelerating for quite some time.
We believe all of these developments firmly contradict the notion that inflation is due to accelerate. True, the recent deceleration in inflation has not been an across-the-board phenomenon, affecting all components of the core PCE price index. However, there have been pronounced slowings in a number of prominent components, and there is reason to think that these could be sustained.
While it is not a sure thing that core PCE inflation will remain at the 1.4% pace of recent months, these recent rates look a lot less transitory than Fed comments would try to make them. We believe it is most likely that inflation will remain below the 2% rate the Fed has targeted. The longer observed rates stay at or below that range, the more pressure there will be on the Fed to reflect that reality in its policy deliberations. This is especially so given its recent musing about price level (average inflation) targeting.