

A Risk Factor Based LDI Analysis: A 100% Hedge Ratio Is Not Enough
Executive Summary
- We posit a set of risk factors covering fixed-income and equity markets developments and construct LDI portfolios by matching the sensitivities of pension assets and pension liabilities to these factors.
- Credit instruments are found to exhibit only limited sensitivity to government market risks, while government bonds exhibit no sensitivity at all to credit market risks.
- As DB liabilities exhibit substantial sensitivity to both government and credit market risks, a full hedge of liabilities will require some exposure to both government and credit instruments.
- A full hedge of DB liabilities will typically involve a hedge ratio in excess of 100%. This is not a recommendation of “over hedging” so much as an indication of the shortcomings of the duration measure when analyzing assets and liabilities of differing credit qualities.
- Similarly, equity instruments are found to be very sensitive to credit market risks. This implies that mixing credit and equities within a DB allocation will typically result in too much exposure to credit market risks.
Introduction
This paper presents a risk-factor approach to Liability Driven Investing (LDI) and analyzes the sensitivities of both pension liabilities and assets to these factors. LDI allocations are subsequently achieved by matching these asset and liability sensitivities as closely as is practicable.
By working with a set of risk factors clearly relevant to defined benefit (DB) plans, our analysis provides more substance to the process of hedging liabilities. It is not simply a matter of matching durations and spread durations. As we will see, investment-grade credit instruments exhibit actual sensitivities to Treasury yield movements that are far less than suggested by their stated durations. Similarly, the sensitivity to spread changes for assets of different credit qualities is much more disparate than spread duration readings suggest.
Meanwhile, since they depend on high-quality—Aa—yields, DB liabilities’ accounting valuations exhibit more sensitivity to Treasury yields and less sensitivity to credit spreads than do lower-rated credit asset indices. Thus, in order to fully hedge its liabilities, a DB plan needs to allocate to both credit and governments.
These results are established directly and tangibly by way of risk factor analysis. Our risk factors are defined in such a way as to be statistically independent of each other. By ensuring that our government and credit market risk factors embody distinct phenomena, we can more clearly delineate the differing abilities of various credit and government bonds to hedge those different risks for a DB plan.
We’ll see that in order to fully hedge its liabilities, a plan will typically have to allocate to a portfolio where asset duration exceeds liability duration. This doesn’t mean the plan has to over-hedge. Rather, the hedge ratio needs to exceed 100% precisely because stated duration results do not accurately gauge the yield and spread sensitivities of liabilities and assets.
The following pages introduce risk factors, analyze the sensitivities of various assets to these factors, examine the sensitivities of DB liability return measures to the risk factors, match the sensitivities of assets and liabilities to the risk factors, and explore the phenomenon of above-100% hedge ratios for LDI solutions.
Risk Factors Relevant To LDI Analysis
Risk factor analyses generally take one of two approaches, utilizing risk factors that either are of fundamental/intuitive relevance or are purely statistical artifacts, such as principal components. A problem with most fundamental risk factor sets is that there is substantial correlation among risk factors, presenting problems in statistical analysis (multicollinearity) and in attribution. Principal components are constructed to be uncorrelated, so attribution there is straightforward, but it is often hard to relate the movements in the identified principal components to real world phenomena.
Our risk factors are constructed to bridge the gap between the two approaches. The government, credit, and equity market risk factors we work with are intuitively appealing and of immediate relevance to DB plans, and we construct these factors in such a way that they are uncorrelated with each other.
Description of Risk Factors
We produce uncorrelated risk factors by performing sequential regressions. Since the residuals from a regression equation are known to be uncorrelated with regressor variables, we take the residuals from the regression for a particular asset as representing developments specific to that asset market, thus the risk factor specific to that market. For example, the long credit market risk factor is identified by regressing long credit returns on cash market, long government market, and intermediate market risk factors and then taking the residuals of that regression as long credit market risks (that are independent of government markets).
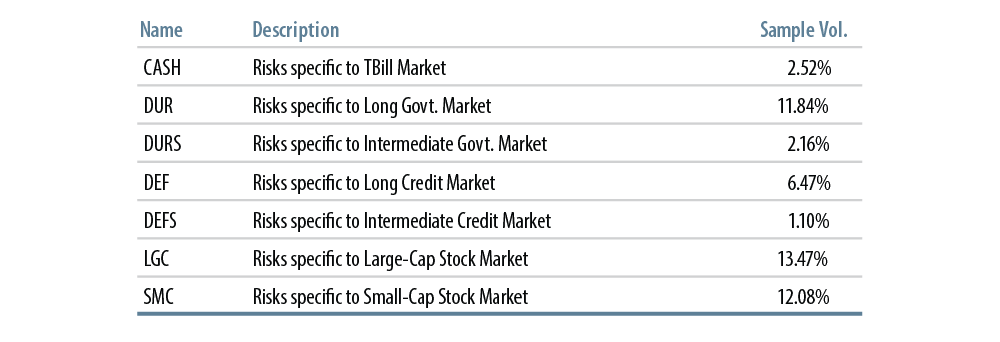
Other risk factors are identified similarly. Exhibit 1 lists our seven risk factors, their mnemonics used in the rest of this paper, and the order in which the risk factors are derived. The government and credit market risk factors are clearly relevant for liability valuations, since they account for most of the movements in the yield curves that generate liability valuations. The equity market risk factors are clearly relevant for equity asset holdings, which makes them an important source of risk for most real-world DB plans.
The regressions identifying our risk factors utilized annual holding period returns over the sample period 1989-2014. Fixed-income returns were as per the indices of the Barclays universe. Equity market returns were as reported by Ibbotson and Bloomberg. “Factor loads” or “betas” show the regression coefficients for given assets against given risk factors, thus the sensitivities of those assets to the risk factors. By definition, an asset has a beta of 1 against the risk factor for its own market.
Besides the sensitivities of assets to particular risk factors, we are also interested in the explanatory powers of the risk factors over assets: how much of an asset’s variation is explained by movements in each factor? An asset may be weakly sensitive to a very tranquil factor or very sensitive to a volatile factor, or any combination in between. The R2 between an asset and a risk factor shows the percentage of variation in the asset explained by that risk factor1. It results from the combination of beta and factor variability.
The last column in Exhibit 1 shows the variabilities of the seven risk factors over our sample period. As seen there, DUR and DEF are the most volatile—thus most important—of the fixed-income market risk factors. Note, though, that the volatilities of both LGC and SMC exceed even these largest fixed-income factor volatilities. (And note that this is true even though all movement in equity returns related to fixed-income market movements has been first “extracted” via our regressions.)
Derivation of LDI Risk Factors Over 1989-2014 Sample Period
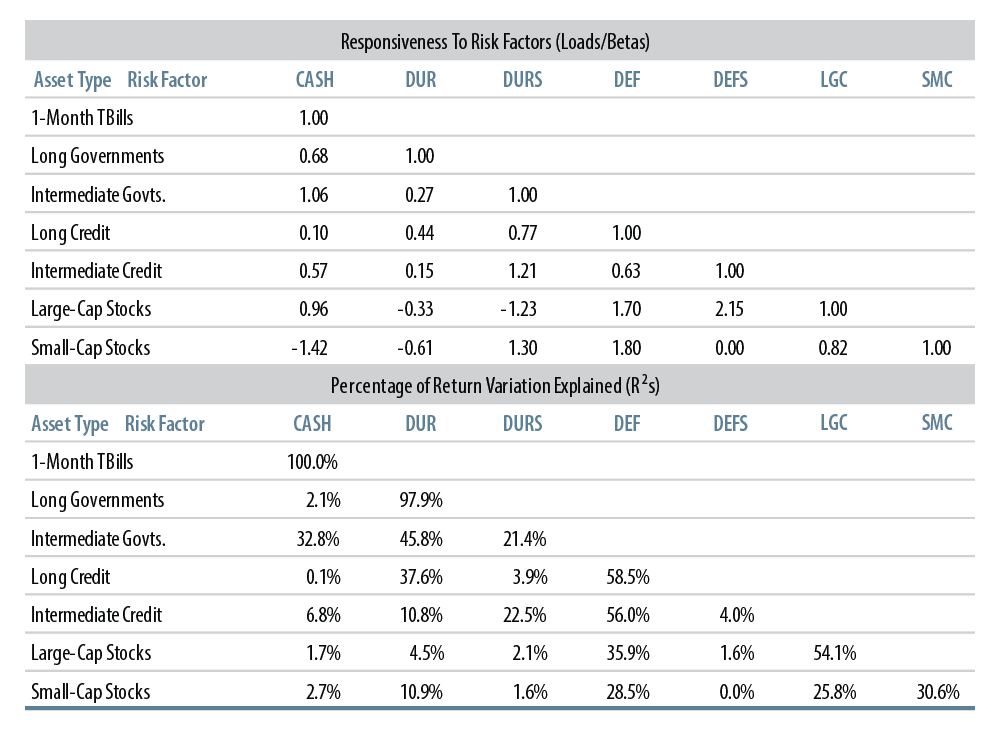
Exhibit 2 shows betas and R2s for our seven “base” assets against the risk factors. Note that the beta of long credit returns to DUR is only 0.44. Long credit exhibits only 44% as much “empirical” duration as do long governments, despite the fact that the stated duration of long credit has averaged 86% of that of long governments over the sample. Also, only 37.6% of the variation in long credit returns is explained by DUR.
In contrast, intermediate credit shows a 1.21 beta to DURS, close to the 125% average ratio of stated durations of intermediate credit and intermediate governments over the sample. Still, with DURS exhibiting a low 2.2% variability, DURS explains only 22.5% of the sample variation in intermediate credit returns. Only 4.0% of the variation in intermediate credit returns is explained by DEFS, compared to 56.0% by DEF.
Both large- and small-cap stocks show generally negative betas to DUR and DURS (negative empirical durations) but very large betas to DEF and DEFS (very large positive spread durations). In fact, equity returns exhibit more empirical spread duration than do long or intermediate credit. DEF and DEFS explain a substantial portion of the variation in equity market returns, but not a majority.
The order in which we have identified risk factors is arbitrary, but it is a logical one given our focus on hedging DB liability returns. We could have identified credit market risks first and government market risks later. The specific results would be only slightly different, and we would still arrive at the finding that credit market returns are only partially explained by government market risks and vice versa. Our findings on the sensitivity of equity market returns to credit market risk factors would still hold as well.
Exhibit 3 reports on the sensitivities of other prominent asset classes to the risk factors2. Long credit is broken down into component qualities. It is interesting but not surprising that as credit rating improves, betas to government market risks rise and betas to credit market risks decline (green- and red-shaded cells). Long Baa credit exhibits little empirical duration, while Aaa credit exhibits almost no empirical spread duration.
Sensitivity Of Other Assets To LDI Risk Factors, 1989-2014 Sample Period
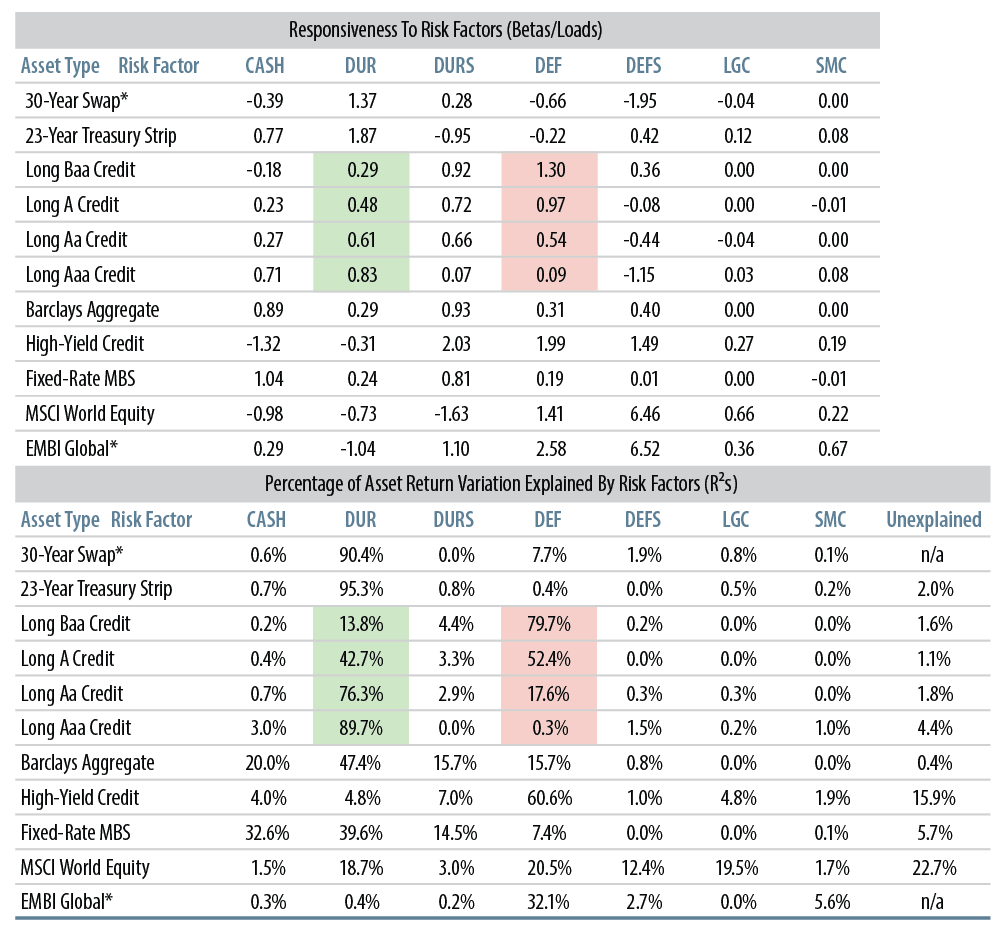
*As these asset types have shorter return histories, risk factor regressions cover a shorter sample, 1993-2013 for swaps, 1995-2013 for EMBI Global.
We’ll see the same trends holding for liability returns. This is yet another indication of the difference between “interest rate duration” and “spread duration” for various fixed-income indices. It will also be an important consideration when constructing effective LDI allocations. Note the especially high, 1.99 beta of high-yield returns to DEF, even though the stated duration of high-yield has been only 42% of that of long credit on average.
It is not surprising that swaps are very highly responsive to long government risks. It is surprising to see the large negative betas of swaps to DEF and DEFS. Since swaps trade at a spread to Treasuries, they are often thought to be positively sensitive to credit spreads. Our results show otherwise. Fixed-rate MBS is most responsive to CASH and DURS, but DUR still explains the largest share (39.6%) of variation in MBS returns. EM bonds exhibit negative beta to DUR, but very large, positive betas to DEF and DEFS, similar to the profile for US equities and global equities.
Responsiveness of DB Liability Returns to LDI Risk Factors
Exhibit 4 shows the betas and R2s of various DB liability return measures to our risk factors. The different liability return series utilize the same set of DB cash flows, but with valuations determined by different discount methods3. The first two returns series are based on AA yields and so are relevant for plans’ accounting purposes. The last is based on the Treasury’s high-quality corporate bond yield curve, utilizing bonds from A through AAA ratings. It is relevant for plans’ funding purposes in reporting to the IRS and PBGC.
Notice in Exhibit 4 that all liability return measures are highly responsive both to government and credit market risk factors. All have more than 90% of their variation explained by the simple fixed-income market risk factors utilized here. Residual liability risks are due to movements in yield curves not picked up by our risk factors, and these residual risks can be seen to be of only slight empirical importance.
This echoes our previous advice to plans: “don’t sweat the small stuff.”4 Unless a plan is substantially overfunded and trying to lock down every last basis point of risk, simple allocations to long credit and long governments can hedge the dominant risks as well as can be done in practice.
Note also that these liability valuations exhibit more sensitivity to government market risks and generally less sensitivity to credit market risks than does long credit. An allocation to long credit sufficient to hedge liabilities’ credit market risks will not provide a sufficient hedge of government market risks.
Responsiveness of DB Liability Returns to LDI Risk Factors, 1989-2014 Sample Period
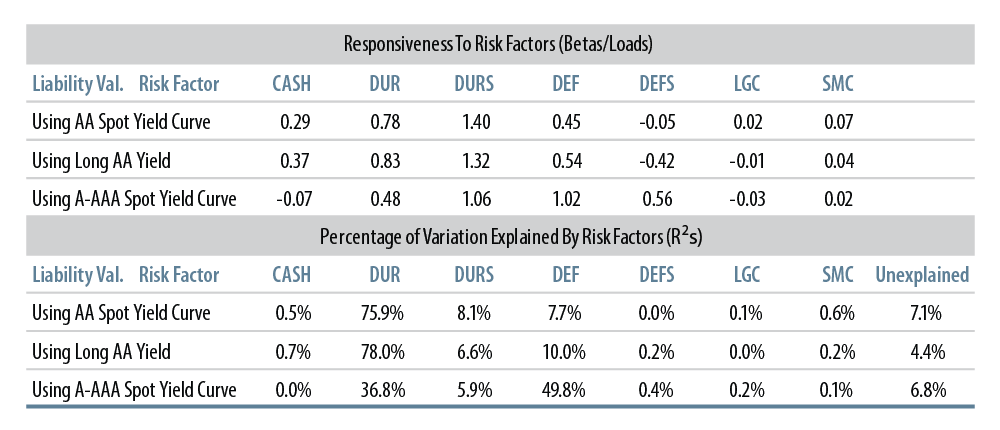
The exception here is the A to AAA (funding) liabilities measure, where the betas to DUR and DEF are almost identical to those of long credit. This highlights the differences among the liability return measures in Exhibit 4. The AA based liability returns are more responsive to government market risks and less responsive to credit market risks than the A to AAA based liabilities. This mirrors our findings on the asset side.
Constructing an LDI Allocation By Matching Risk Factor Sensitivities
Given the seven sensitivities (factor loads, betas) of a liability return series to our risk factors, it is simple mathematically to exactly match these sensitivities using any seven asset classes. However, such “mechanical” solutions will typically not be independent of government because they involve substantial shorting and/or have total portfolio weights different from 100%. In other words, given the real-world assets available to it, a plan will likely be unable to exactly match the risk-factor sensitivities of its liabilities. Instead, it has to identify the allocation that most closely matches risk-factor betas of assets and liabilities.
For example, for the first liability return series listed in Exhibit 4, discounted by an Aa spot curve, sensitivities to the risk factors could be exactly matched via Portfolio A shown in Exhibit 5. The asset weights for Portfolio A are listed in the top half of the table. The liabilities’ betas to the risk factors are shown in the grey-shaded cells in the lower half, and the portfolio betas for Portfolio A are then shown to the right.
LDI Allocations That Match Risk Factors Sensitivities
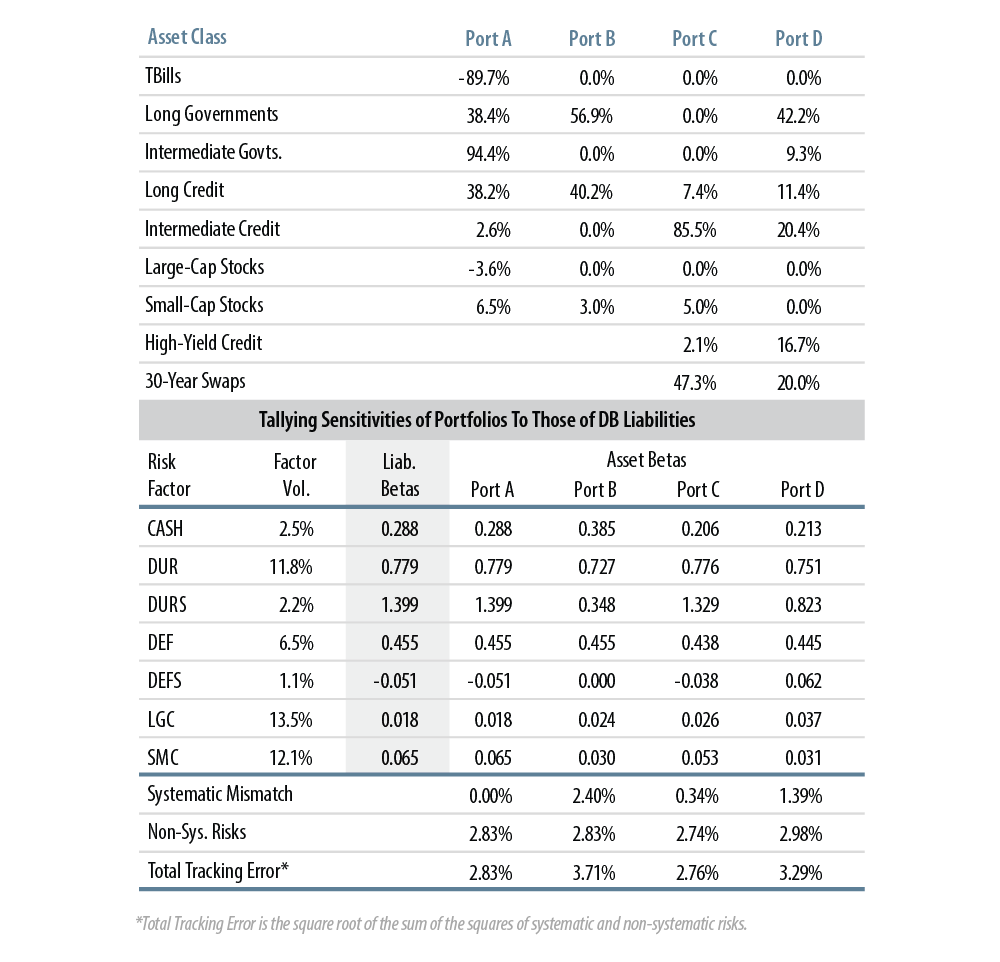
*Total Tracking Error is the square root of the sum of the squares of systematic and non-systematic risks.
While Portfolio A achieves an exact fit, it is clearly not a viable alternative, since it involves huge shorting of cash and also since total portfolio weights sum only 87%. (And if the unused 13% of assets were put in cash, that would induce tracking error by introducing liability/asset mismatch for the CASH risk factor.)
Portfolio B provides an alternative to Portfolio A. It is derived by not allowing shorting and by constraining asset weights to sum to 1. Portfolio weights are then chosen so as to minimize the weighted mismatch between asset and liability betas. Asset-liability beta mismatches for each risk factor are weighted by the volatility of that factor, and this weighted sum is minimized5. This process is equivalent to minimizing the tracking error accounted for by our risk factors.
The “systematic mismatch” shown toward the bottom of the table shows the weighted sum of mismatches, while “non-systematic risks” reflect tracking error not accounted for by the risk factors (the “unexplained variation” in liability returns shown in Exhibit 4). By giving up an exact match of its liabilities’ betas and moving to a practical match, the plan incurs additional systematic tracking error of 2.4%, but still achieves an adequate match of risk-factor betas. Note the close match of Portfolio B betas to liabilities for DUR, DEF, LGC and SMC factors. An “efficient” LDI allocation addresses these most important risks first.
Of course, Portfolio B is optimal only across the “base set” of seven assets. In order to better hedge the “secondary” risks of its liabilities, a plan might enlist other asset types that address specific liability risks. Portfolio C adds high-yield and swaps to the mix. As seen earlier, high-yield can achieve high exposure to credit market risks with small physical asset allocations. Similarly, swaps provide exposure to DUR and DURS without tying up physical assets.
Given the wider asset set, Portfolio C is constructed by minimizing the weighted sum of factor mismatches, just as Portfolio B was. Notice that Portfolio C is able to reduce systematic tracking error almost to zero, actually achieving a total tracking error less than that of Portfolio A6.
The drawback of Portfolio C, of course, is that its 47.3% notional exposure to derivatives is larger than most plans would tolerate. So, Portfolio D shows how such an optimized allocation looks given the same asset set in play, but with swaps exposure constrained to be no more than 20% notional of assets. This constraint results in an additional 1.05% of systematic tracking error.
The evolution of asset weights across these solutions provides insights into the trade-offs involved in attempting to hedge DB liabilities with limited available funds and with limited available instruments7. As constraints are eased, secondary risks become addressed, and different tools become utilized. Thus, with only limited exposure to swaps (Portfolios B or D), a plan needs to achieve its exposure to DUR via long governments and long credit, so it allocates little to intermediate credit. When swaps are allowed in greater volume (Portfolio C), physical assets get allocated away from long duration toward intermediate credit and high-yield, to better hedge other risks.
As can be seen in the table, Portfolio C matches liabilities’ sensitivity to DURS much more closely than does Portfolio D. While DURS is a low volatility risk factor, even those lesser risks are worth addressing when the asset allocation is afforded sufficient “leverage.”
Durations, Hedge Ratios for LDI Solutions
A 100% Hedge Ratio Is Not Enough
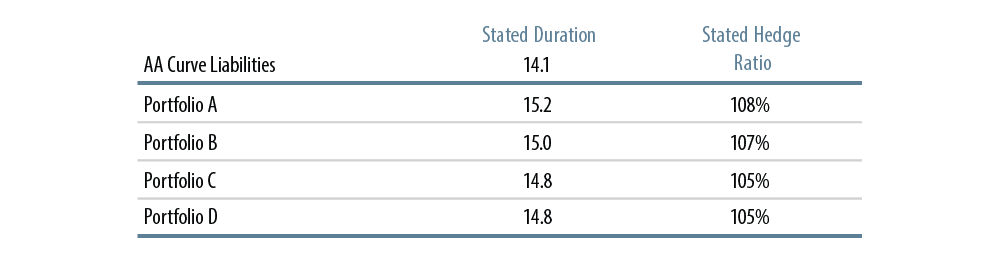
The LDI allocations described in the preceding section match risk factor sensitivities as closely as can be achieved given various constraints. None of these allocations feature asset portfolio betas against the risk factors that are larger than those of the liabilities, so none of these solutions involve any “over-hedging.” Yet, as seen in Exhibit 6, all these allocations feature “stated” hedge ratios that are in excess of 100%: in each case, stated asset duration exceeds liability duration.
The hedge ratios above 100% reflect the misleading nature of duration comparisons across assets of different quality. Duration calculations do not distinguish between movements in Treasury yields or in credit spreads, yet we have seen throughout this analysis that such differences are important in actual experience.
No one asset class fully addresses both government and credit market risks. And in order to fully address both of these risks, the asset portfolio will have to allocate to government and credit instruments in sufficient maturity and magnitude that the calculated duration of the portfolio will exceed that of the liabilities.
It is true that some of the “extra” needed duration reflects the limited scope of available instruments. Notice that Portfolio C—with unconstrained leverage and with access to six different types of fixed-income physical assets—displays a lower hedge ratio than the other solutions. Our experience in running various clients’ assets and liabilities plans through our LDI Optimizer is that as funded ratio increases and as access to different classes of fixed-income instruments increases, the resulting optimal hedge ratio will decrease. However, invariably through all the runs we have done, the optimal hedge ratios exceed 100%.
How can real-world plans achieve hedge ratios greater than 100%? One way is through derivatives. For plans averse to derivatives, needed duration can be achieved through allocations to very long maturity assets and/or through a funded status above 100%. Most DB liability valuations we see have durations in the range of 9 to 13 years. With long governments and long credit sporting current durations of 15.7 and 12.9 years, respectively, an all-physical asset allocation could achieve hedge ratios above 100% against all but the longest liabilities, and for those, long-maturity Strips could be utilized. Similarly, it should be clear that at funded status levels above 100%, hedge ratios above 100% are more easily achieved8.
This analysis also gives a clear indication of why DB plans should be wary of mixing equities or other risk assets with long credit in their asset allocation. While long credit by itself can provide a substantial hedge of government and credit market risks, mixing long credit with equities will almost certainly provide more asset sensitivity to credit market risks than is exhibited by plan liabilities. Comparing the betas in Exhibits 1 and 3, long credit already provides more credit market beta than do DB liabilities, and the equity market instruments shown in Exhibits 2 and 3 invariably feature even more such beta than does long credit.
From a risk-hedging perspective, equities and governments mesh better than equities and credit. If a plan intends to bet both on rising yields and narrowing spreads, then an equity/credit mix could be right. However, if it merely seeks to hedge risks, it should be wary of mixing equities and credit in its asset allocation.
Summing Up
We have developed here a set of seven risk factors that are intuitively meaningful and that explain the vast majority of systematic historical movements in liability valuations. By using these risk factors, we have been able to analyze the effectiveness of various asset classes for hedging various risks and also the need for such hedges exhibited by actual DB liabilities. We identified LDI solutions by matching sensitivities of asset and liabilities to the various risk factors.
We’ve seen that an effective hedge of all the credit market risks exhibited by DB liabilities will involve allocations to both government and credit instruments. Neither asset class can fully hedge liabilities by itself. Similarly, such a full hedge of plan liabilities will inevitably exhibit a hedge ratio in excess of 100%. Plans seeking to fully hedge their liabilities will have to achieve this “extra” duration via derivatives, very long maturity assets, a funded status in excess of 100%, or some combination of these.
The different government and credit market sensitivities for fixed-income assets of differing qualities imply LDI allocations will look different for plans pursuing a funding valuation target from those for plans pursuing an accounting valuations target. Funding valuation targets feature lower credit quality than accounting valuations, so resulting LDI allocations will feature greater exposure to credit and less to governments. One can debate whether a plan should manage to accounting or funding targets, but once that strategic decision has been established, asset allocation decisions should be made accordingly.
Finally, the analysis here has proceeded solely in terms of hedging plan liabilities, of minimizing tracking error without regard to return considerations. Adding a return target would merely add another constraint to the process. The matching process would not be materially different. The risk factors would be just as relevant.
It is sometimes thought that crafting an LDI allocation is simply a matter of matching durations and spread durations. While such solutions look fine on paper, they leave something to be desired. In actual practice, spreads do not sit still when Treasury yields change, nor is the converse true. Our risk factors provide a perspective on how movements in spreads relative to Treasuries and in spreads across the quality spectrum result in quite different sensitivities of government bonds, corporate bonds, and DB liabilities to market movements, even when these instruments exhibit similar stated durations.
The risk factor analysis utilized here of course represents a stylized characterization of DB plan risks. Still, as we have seen, these stylized factors account for the vast majority of variation in DB valuations. Resorting to this stylization affords insights into the hedging process that are not otherwise easily attained.
These risk factors are a standard feature of the attribution analysis performed within our Western Asset LDI Optimizer Model. In fact, all the results discussed here can be illustrated by the output of our Optimizer program and other proprietary tools we utilize for clients. If you are interested in the options and insights these tools might provide for your plan, please contact us.
Endnotes
- By making sure that our risk factors are uncorrelated with each other, we ensure that the R2s can be added and that they will indeed sum to 1 for the seven asset classes generating our risk factors. This is why attribution analysis is so much simpler with our risk factor set.
- Since the assets analyzed in Exhibit 3 were not used in identifying risk factors, the sums of the R2s will generally be less than 1. These assets will inevitably exhibit variation that is not explained by our risk factors. These amounts are generally very small, the exceptions being high-yield credit and non-US equities. As noted in Exhibit 3, the historical data for bellwether swaps and EMBI returns do not span the 1989-2014 sample used in our analysis. Since the risk factors were derived over the whole 1989-2014 sample, they will be uncorrelated only over that whole sample. Thus, when we regress swaps and EMBI returns on our risk factors over shorter sample periods, the regressors will not quite be uncorrelated, and so the unexplained variations within these regressions will not equal one minus the sum of the R2s.
- These liability return measures were introduced and discussed in detail in a previous white paper, “LDI and The Persistence of Tracking Error” and the technical appendix to that paper, both published in 2013.
- “Effective LDI: Don’t Sweat the Small Stuff”
- Factor volatilities are as shown in Exhibit 1 and repeated in the leftmost column in the bottom half of Exhibit 5.
- High-yield and swaps are able to hedge some of the variation in liability returns that is uncorrelated with the risk factors.
- That is, LDI hedging would be a lot more fruitful if zero-coupon corporates or bond maturities past 30 years were available.
- It should be clear that it is dollar-duration—not duration per se—that we are talking about in this hedge-ratio discussion.