skip navigation
Blog

Stay up to date on timely topics and market events. Subscribe to our Blog now.

CREDIT
December 05, 2024

Why Investors Should Consider US Securitized Credit

Stay up to date on timely topics and market events. Subscribe to our Blog now.

Overview

Agency mortgage-backed securities (MBS), with over $11 trillion outstanding and non-agency securitized credit markets with more than $2 trillion in size, represent almost a quarter of the US investable fixed-income universe (approximately 23%). While most investors are familiar with agency MBS, US securitized credit markets include many categories of investment opportunities with diverse structures and collateral types that offer investors the benefits of income diversification and higher yields compared to traditional fixed-income sectors. Here we highlight the reasons why investors should consider US securitized credit in their asset allocations. Currently, the spreads and fundamentals available in these sectors appear attractive in a historical context compared to corporate bonds, which offer investors the potential to achieve broader portfolio diversification and a higher source of income.

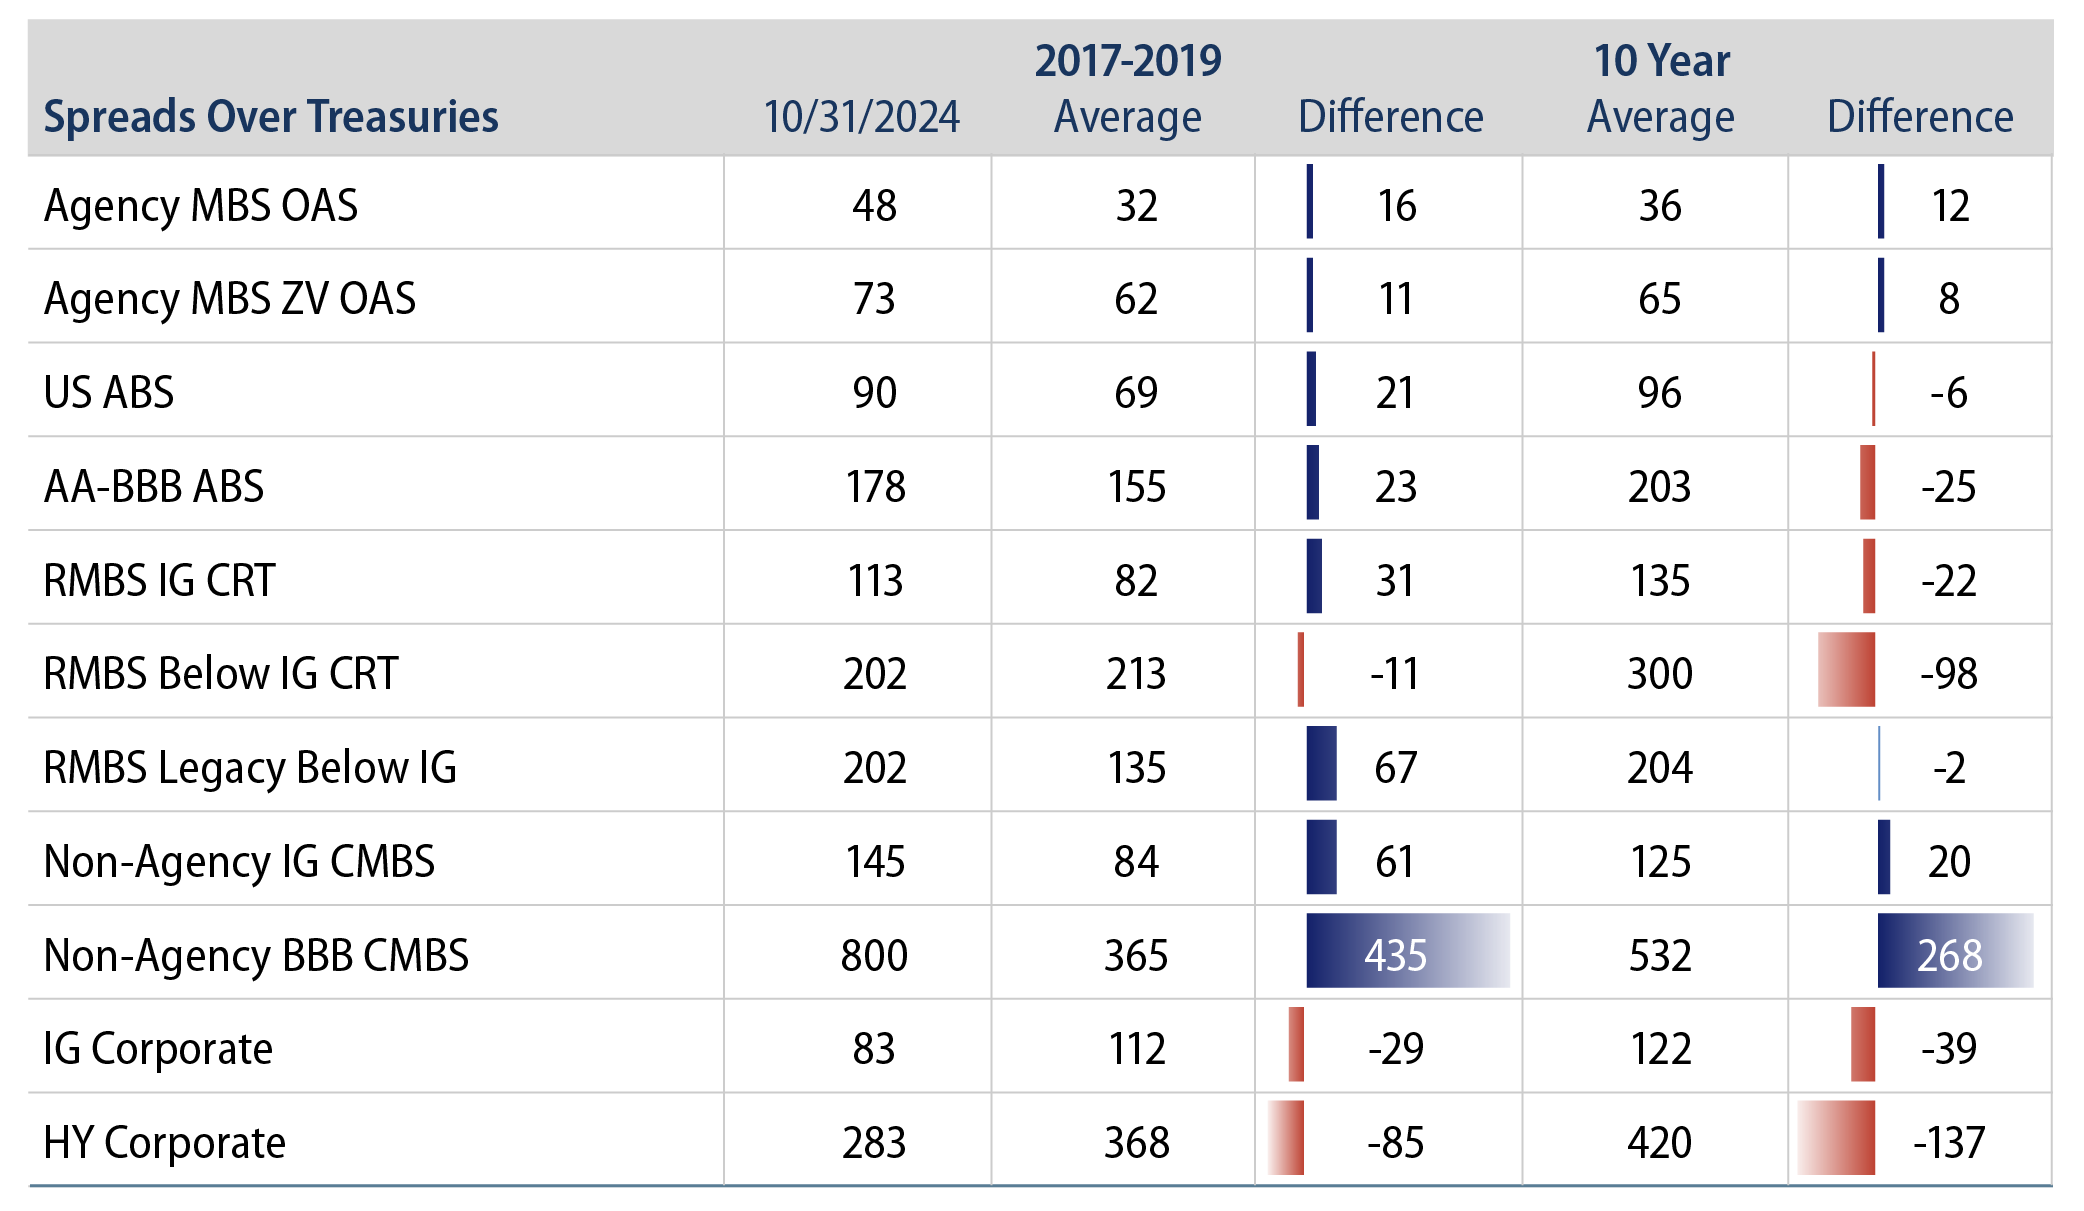
Pursue Income Beyond Corporate Bonds

US securitized credit markets represent a liquid and scalable way to express views on residential and commercial real estate loans, consumer credit and other types of receivables that may not be directly captured in corporate credit markets. In the current environment, US mortgage and consumer loan-backed securities offer attractive spreads and income advantage potential compared to corporate bonds across the credit spectrum. The diversity of collateral backing these securities and the levels of credit support, including the government-backed guarantee of agency MBS, differentiate them from corporate debt markets.

Exhibit 1: US Securitized Credit Spreads Relative to Corporates
US Securitized Credit Spreads Relative to Corporates
Source: Bloomberg, Western Asset. Agency MBS: Bloomberg US Mortgage-Backed Securities Index, US ABS: ICE BofA US Fixed Rate Asset Backed Securities Index. AA-BBB ABS: ICE BofA AA-BBB US Asset Backed Securities Index, RMBS IG CRT and Below CRT: based on Western Asset time series; RMBS Legacy Below IG: based on BAML blend of Legacy Alt-A floaters, Option ARMs, LCF Subprime, Non-Agency IG CMBS: Bloomberg Non-Agency CMBS Agg Eligible Index; Non-Agency BBB CMBS: Bloomberg Non-Agency Investment Grade BBB CMBS Index, IG Corporate: Bloomberg US Corporate Investment Grade Bond Index, HY Corporate: Bloomberg US Corporate High Yield Bond Index. OAS represents option adjusted spreads (nominal spread adjusted for prepayment and volatility). ZV OAS represents zero volatility OAS (nominal spread adjusted for prepayment without volatility). 2017-2019 Average represents the pre-Covid period of the first Trump administration. As of 31 Oct 24. Select the image to expand the view.

Agency MBS Are the Bedrock of US Securitized Credit

Agency MBS are issued and guaranteed by US government agencies. These agencies include Ginnie Mae, which is part of the US government (i.e., “full faith and credit”) as well as Fannie Mae and Freddie Mac, which are government-sponsored enterprises. The yield advantage agency MBS offers over US Treasuries (USTs) compensates for prepayment risk, as mortgage borrowers may prepay their loans at any time, while the agency guarantee feature removes credit risk for investors.

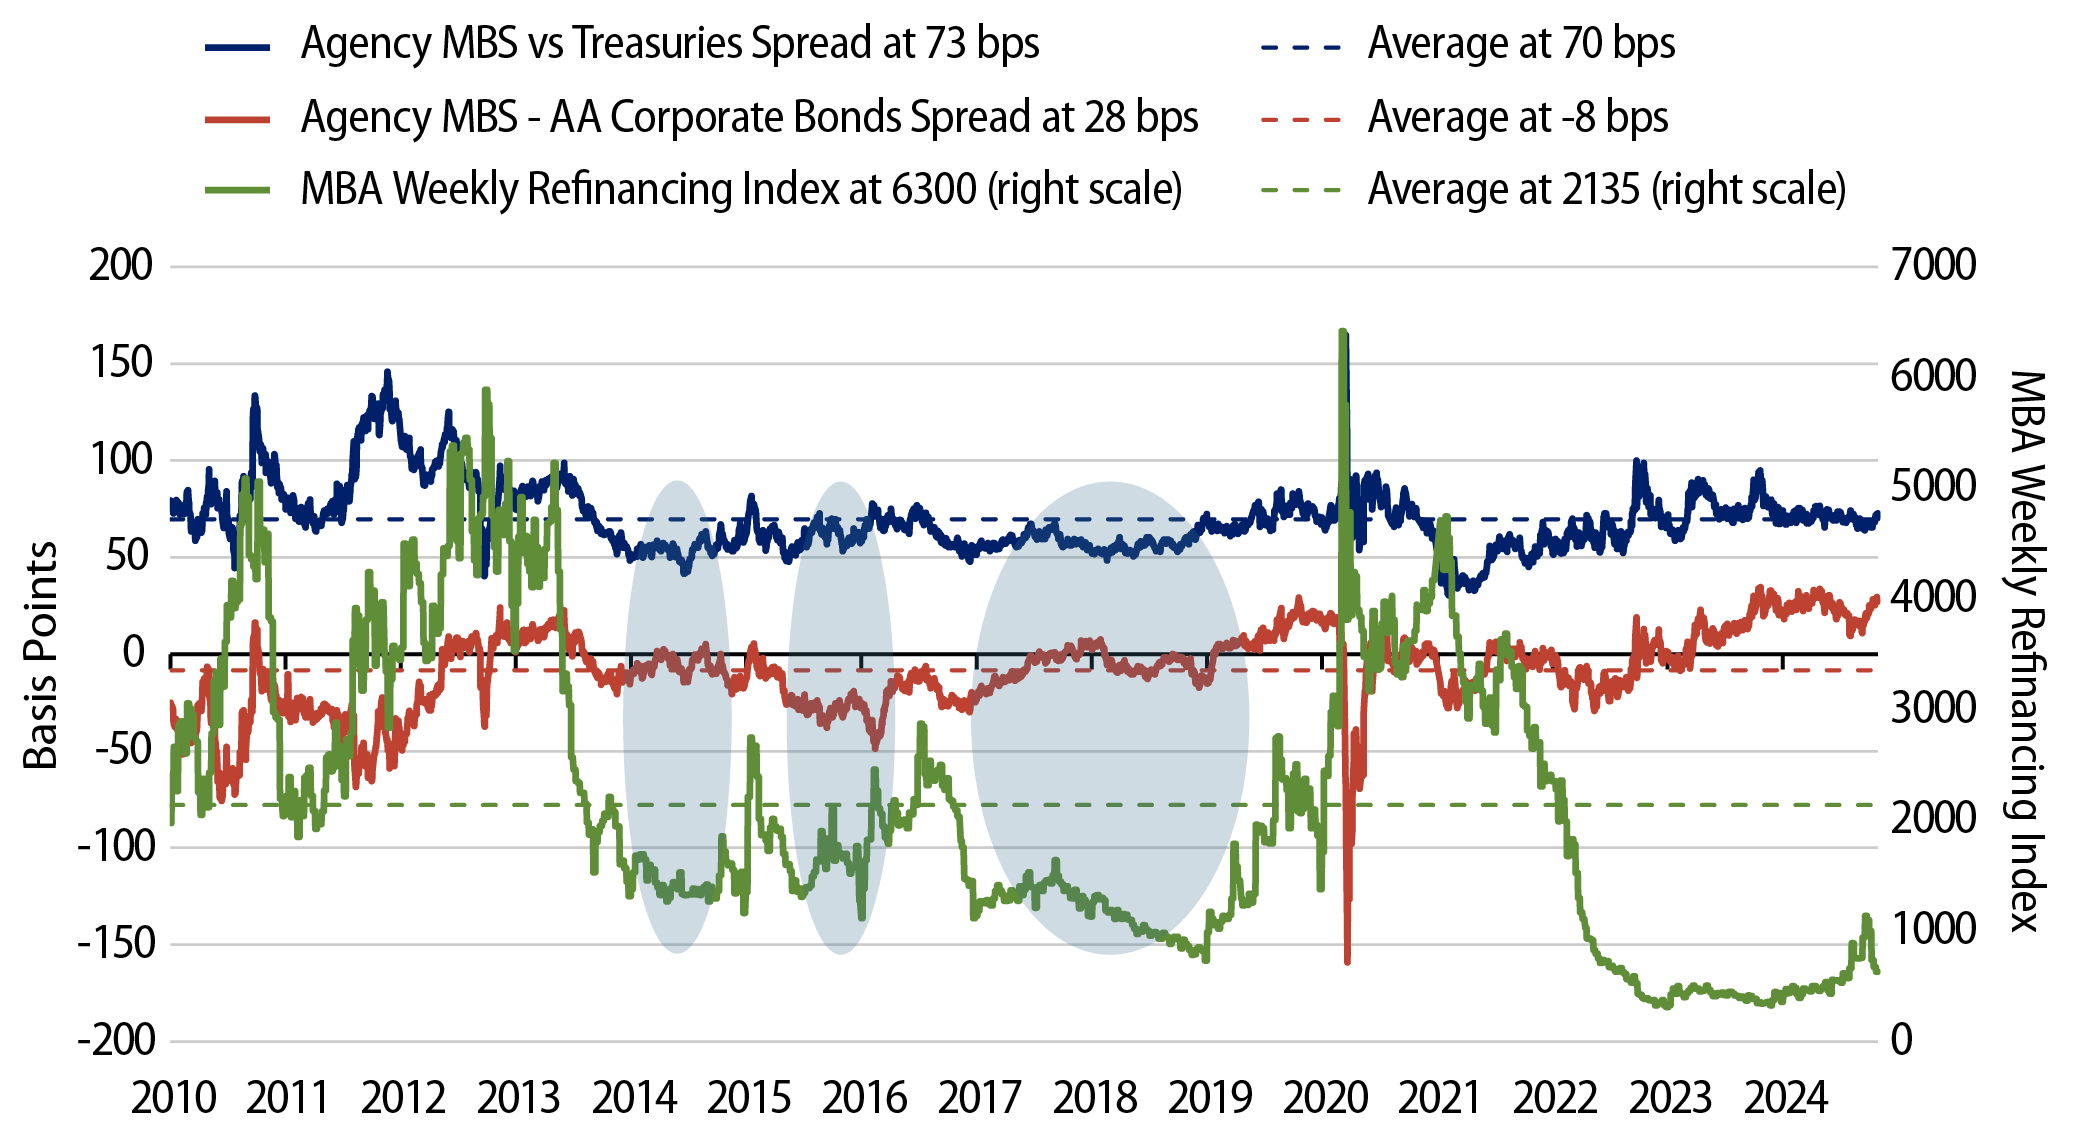
Going back over two decades, the present yield advantage of agency MBS relative to USTs and high-quality corporate bonds looks compelling relative to the low level of mortgage borrower refinancing activity (Exhibit 2).

Exhibit 2: The Agency MBS Yield Advantage With Limited Prepayment Risk
The Agency MBS Yield Advantage With Limited Prepayment Risk
Source: Bloomberg and Mortgage Bank Association. Data as of 31 Oct 2024. Agency MBS vs. Treasuries Spread: Bloomberg US Mortgage-Backed Securities Index ZV OAS, Agency MBS—AA Corporate Bond Spread: Bloomberg US Mortgage-Backed Securities Index—Bloomberg AA Corporate Index Average OAS. As of 31 Oct 24. Select the image to expand the view.

The Fundamental Drivers of US Securitized Credit Appear Sound

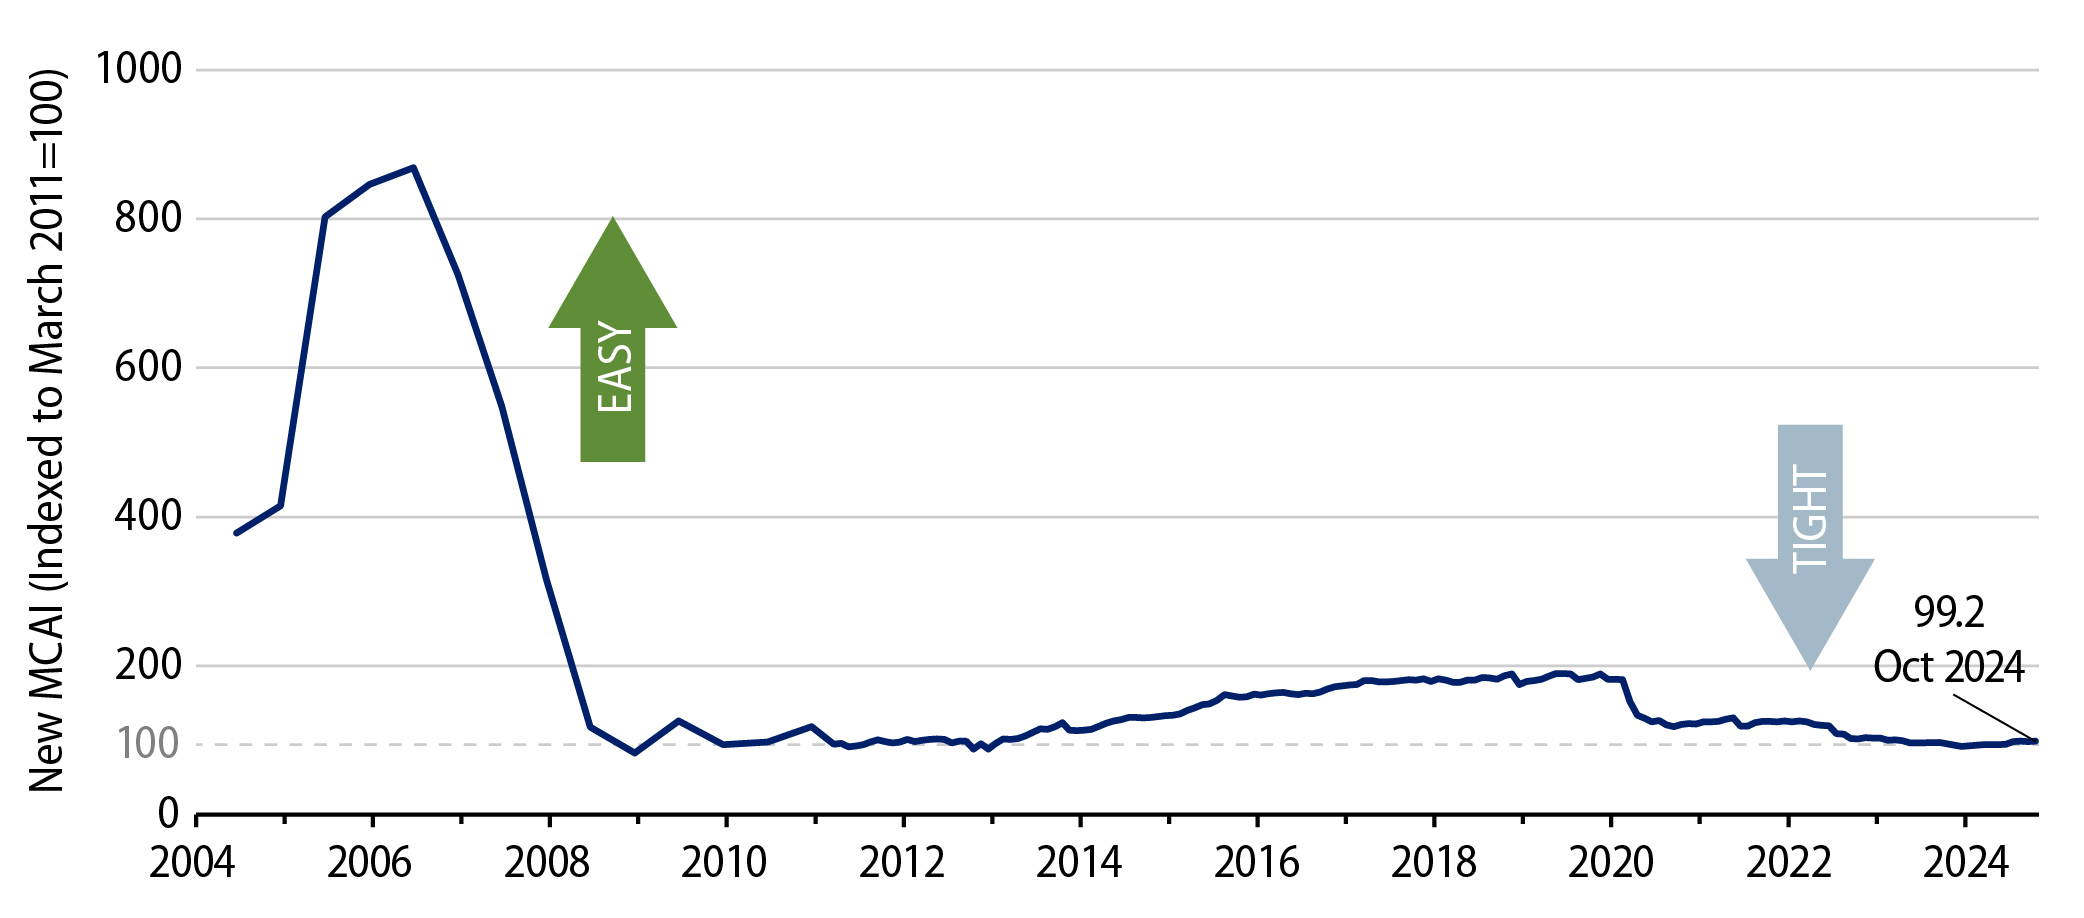
Since the global financial crisis of 2008, lending standards for US households and commercial real estate have been conservative. They require more equity from borrowers and higher credit and income verification—especially in mortgage lending, which necessitates a higher-quality asset class. A backdrop of economic growth, low unemployment and strong wealth effects on consumer balance sheets support delinquency and recovery profiles for US household loans while prepayment risk is limited, as most mortgage borrowers locked in historically low rates during the Covid pandemic. With prevailing 30-year mortgage rates around 6.8%, less than 10% of US mortgage borrowers have a higher rate. Limited supply of homes on the market and low affordability constraining demand underpins the outlook for residential real estate prices. On the other hand, commercial real estate markets are diverse across property types with stable to improving rent and vacancy fundamentals for apartments, hotels, industrial and retail properties, while the office sector faces headwinds.

Exhibit 3: Mortgage Credit Availability Continues to Be Tight
Mortgage Credit Availability Continues to Be Tight
Source: Mortgage Bank Association. The Mortgage Credit Availability Index (MCAI) is a barometer on the availability or supply of mortgage credit at a point in time. The MCAI is calculated using several factors including loan to value (LTV), credit score, and loan and underwriting requirement attributes. As of 31 Oct 24. Select the image to expand the view.

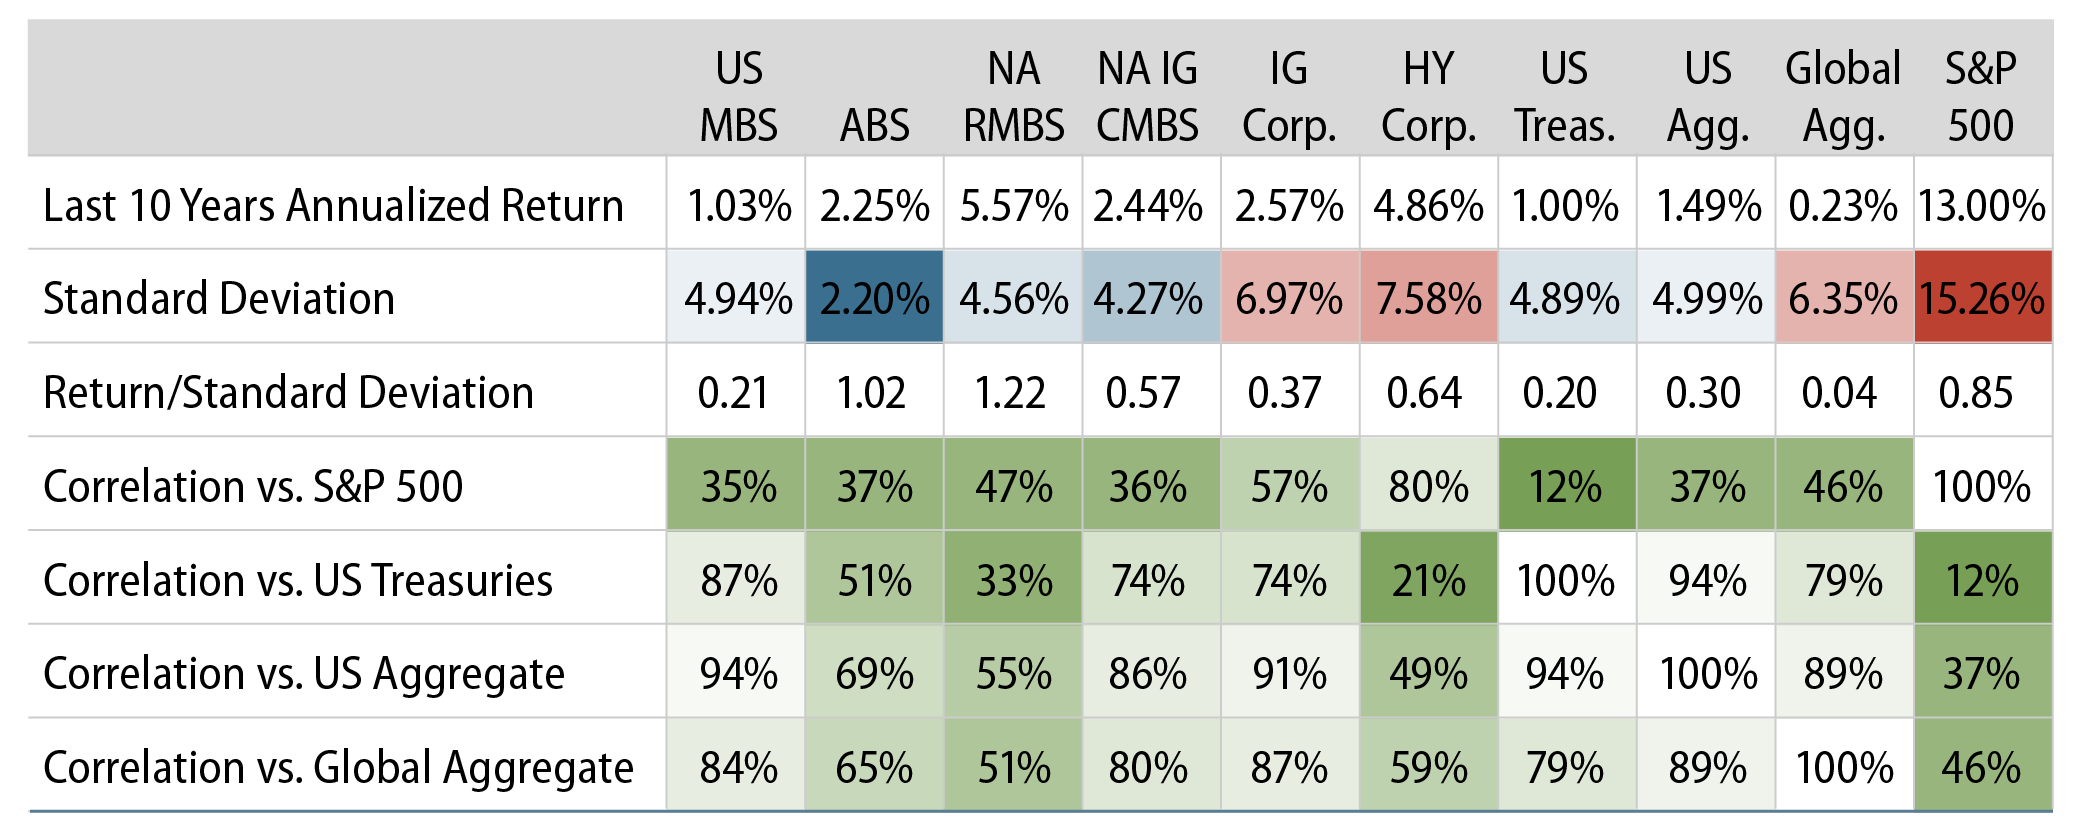
US Securitized Credit Offers Portfolio Diversification Benefits

With relatively low correlations to other fixed-income sectors, US securitized credit can play an important role in optimizing a broader portfolio through diversification benefits, lower volatility and the potential for higher risk-adjusted return outcomes. Agency MBS investors exchange credit risk for prepayment and interest-rate volatility exposure. In non-agency securitized sectors, collateral backing, credit enhancements (subordination and overcollateralization) and amortization deleveraging structurally support these types of securities relative to corporate bonds.

Exhibit 4: US Securitized Credit Relative Returns, Risks and Correlations
US Securitized Credit Relative Returns, Risks and Correlations
Source: US MBS: Bloomberg US Mortgage-Backed Securities Index, ABS: ICE BofA US Fixed Rate Asset Backed Securities Index, NA RMBS: JP Morgan Non-Agency Residential MBS Index, NA IG CMBS: Bloomberg Non-Agency CMBS Agg Eligible Index, IG Corporate: Bloomberg US Corporate Investment Grade Bond Index, HY Corporate: Bloomberg US Corporate High Yield Bond Index, US Treasury: Bloomberg US Treasury Index, US Aggregate: Bloomberg US Aggregate Index, Global Aggregate: Bloomberg Global Aggregate Index, S&P 500: S&P 500 TR Index. As of 31 Oct 24. Select the image to expand the view.

The US Securitized Credit Universe Is Broad and Diverse

The large investable universe of US securitized credit allows for active sector rotation and security selection opportunities. With more than $11 trillion outstanding in agency MBS and over $2 trillion in non-agency residential MBS (RMBS), commercial MBS (CMBS) and asset-backed securities (ABS), subsector rotation and security selection opportunities abound with diversity in terms of structure, credit quality, yields, maturities and collateral types. With a lack of passive ETF options for US securitized credit exposure, investors can focus on active managers who emphasize collateral and structural research. Active management can shift portfolio construction to adjustable floating-rate and interest-only securities in an effort to achieve higher risk-adjusted returns in rising-rate environments or emphasize the resilience of fixed-rate agency MBS in lower-rate environments by focusing on coupon selection.

© Western Asset Management Company, LLC 2025. The information contained in these materials ("the materials") is intended for the exclusive use of the designated recipient ("the recipient"). This information is proprietary and confidential and may contain commercially sensitive information, and may not be copied, reproduced or republished, in whole or in part, without the prior written consent of Western Asset Management Company ("Western Asset").
Past performance does not predict future returns. These materials should not be deemed to be a prediction or projection of future performance. These materials are intended for investment professionals including professional clients, eligible counterparties, and qualified investors only.
These materials have been produced for illustrative and informational purposes only. These materials contain Western Asset's opinions and beliefs as of the date designated on the materials; these views are subject to change and may not reflect real-time market developments and investment views.
Third party data may be used throughout the materials, and this data is believed to be accurate to the best of Western Asset's knowledge at the time of publication, but cannot be guaranteed. These materials may also contain strategy or product awards or rankings from independent third parties or industry publications which are based on unbiased quantitative and/or qualitative information determined independently by each third party or publication. In some cases, Western Asset may subscribe to these third party's standard industry services or publications. These standard subscriptions and services are available to all asset managers and do not influence rankings or awards in any way.
Investment strategies or products discussed herein may involve a high degree of risk, including the loss of some or all capital. Investments in any products or strategies described in these materials may be volatile, and investors should have the financial ability and willingness to accept such risks.
Unless otherwise noted, investment performance contained in these materials is reflective of a strategy composite. All other strategy data and information included in these materials reflects a representative portfolio which is an account in the composite that Western Asset believes most closely reflects the current portfolio management style of the strategy. Performance is not a consideration in the selection of the representative portfolio. The characteristics of the representative portfolio shown may differ from other accounts in the composite. Information regarding the representative portfolio and the other accounts in the composite are available upon request. Statements in these materials should not be considered investment advice. References, either general or specific, to securities and/or issuers in the materials are for illustrative purposes only and are not intended to be, and should not be interpreted as, recommendation to purchase or sell such securities. Employees and/or clients of Western Asset may have a position in the securities or issuers mentioned.
These materials are not intended to provide, and should not be relied on for, accounting, legal, tax, investment or other advice. The recipient should consult its own counsel, accountant, investment, tax, and any other advisers for this advice, including economic risks and merits, related to making an investment with Western Asset. The recipient is responsible for observing the applicable laws and regulations of their country of residence.
Founded in 1971, Western Asset Management Company is a global fixed-income investment manager with offices in Pasadena, New York, London, Singapore, Tokyo, Melbourne, São Paulo, Hong Kong, and Zürich. Western Asset is a wholly owned subsidiary of Franklin Resources, Inc. but operates autonomously. Western Asset is comprised of six legal entities across the globe, each with distinct regional registrations: Western Asset Management Company, LLC, a registered Investment Adviser with the Securities and Exchange Commission; Western Asset Management Company Distribuidora de Títulos e Valores Mobiliários Limitada is authorized and regulated by Comissão de Valores Mobiliários and Brazilian Central Bank; Western Asset Management Company Pty Ltd ABN 41 117 767 923 is the holder of the Australian Financial Services License 303160; Western Asset Management Company Pte. Ltd. Co. Reg. No. 200007692R is a holder of a Capital Markets Services License for fund management and regulated by the Monetary Authority of Singapore; Western Asset Management Company Ltd, a registered Financial Instruments Business Operator and regulated by the Financial Services Agency of Japan; and Western Asset Management Company Limited is authorised and regulated by the Financial Conduct Authority ("FCA") (FRN 145930). This communication is intended for distribution to Professional Clients only if deemed to be a financial promotion in the UK as defined by the FCA. This communication may also be intended for certain EEA countries where Western Asset has been granted permission to do so. For the current list of the approved EEA countries please contact Western Asset at +44 (0)20 7422 3000.