skip navigation
Blog

Stay up to date on timely topics and market events. Subscribe to our Blog now.

MARKETS
June 03, 2025

Weekly Municipal Monitor—Underperformance Underscores Opportunity

By Sam Weitzman

Stay up to date on timely topics and market events. Subscribe to our Blog now.

Macros, Markets and Munis

Municipals posted positive returns last week as Treasury yields ultimately moved 9-11 basis points (bps) lower across the curve. Munis moved lower in sympathy with rates but generally underperformed amid inflows and elevated supply conditions. Market volatility abated last week as President Trump delayed the recently announced 50% tariff on Europe and a judge blocked the majority of new tariffs. From an economic data perspective, consumer confidence came in above expectations, while initial jobless claims also exceeded expectations and inflation, as measured by the core Personal Consumption Expenditures (PCE) Index, slowed to a 2.5% annualized rate. This week we highlight the 2025 muni market’s underperformance, which has contributed to what we view as attractive relative valuations.

Muni Funds Record Inflows Amid a Building New Issue Calendar

Fund Flows (up $526 million): During the week ending May 28, weekly reporting municipal mutual funds recorded $526 million of net inflows, according to Lipper. Long-term funds recorded $203 million of inflows, intermediate funds recorded $79 million of inflows and high-yield funds recorded $150 million of inflows. Last week’s inflows led year-to-date (YTD) inflows higher to $6 billion.

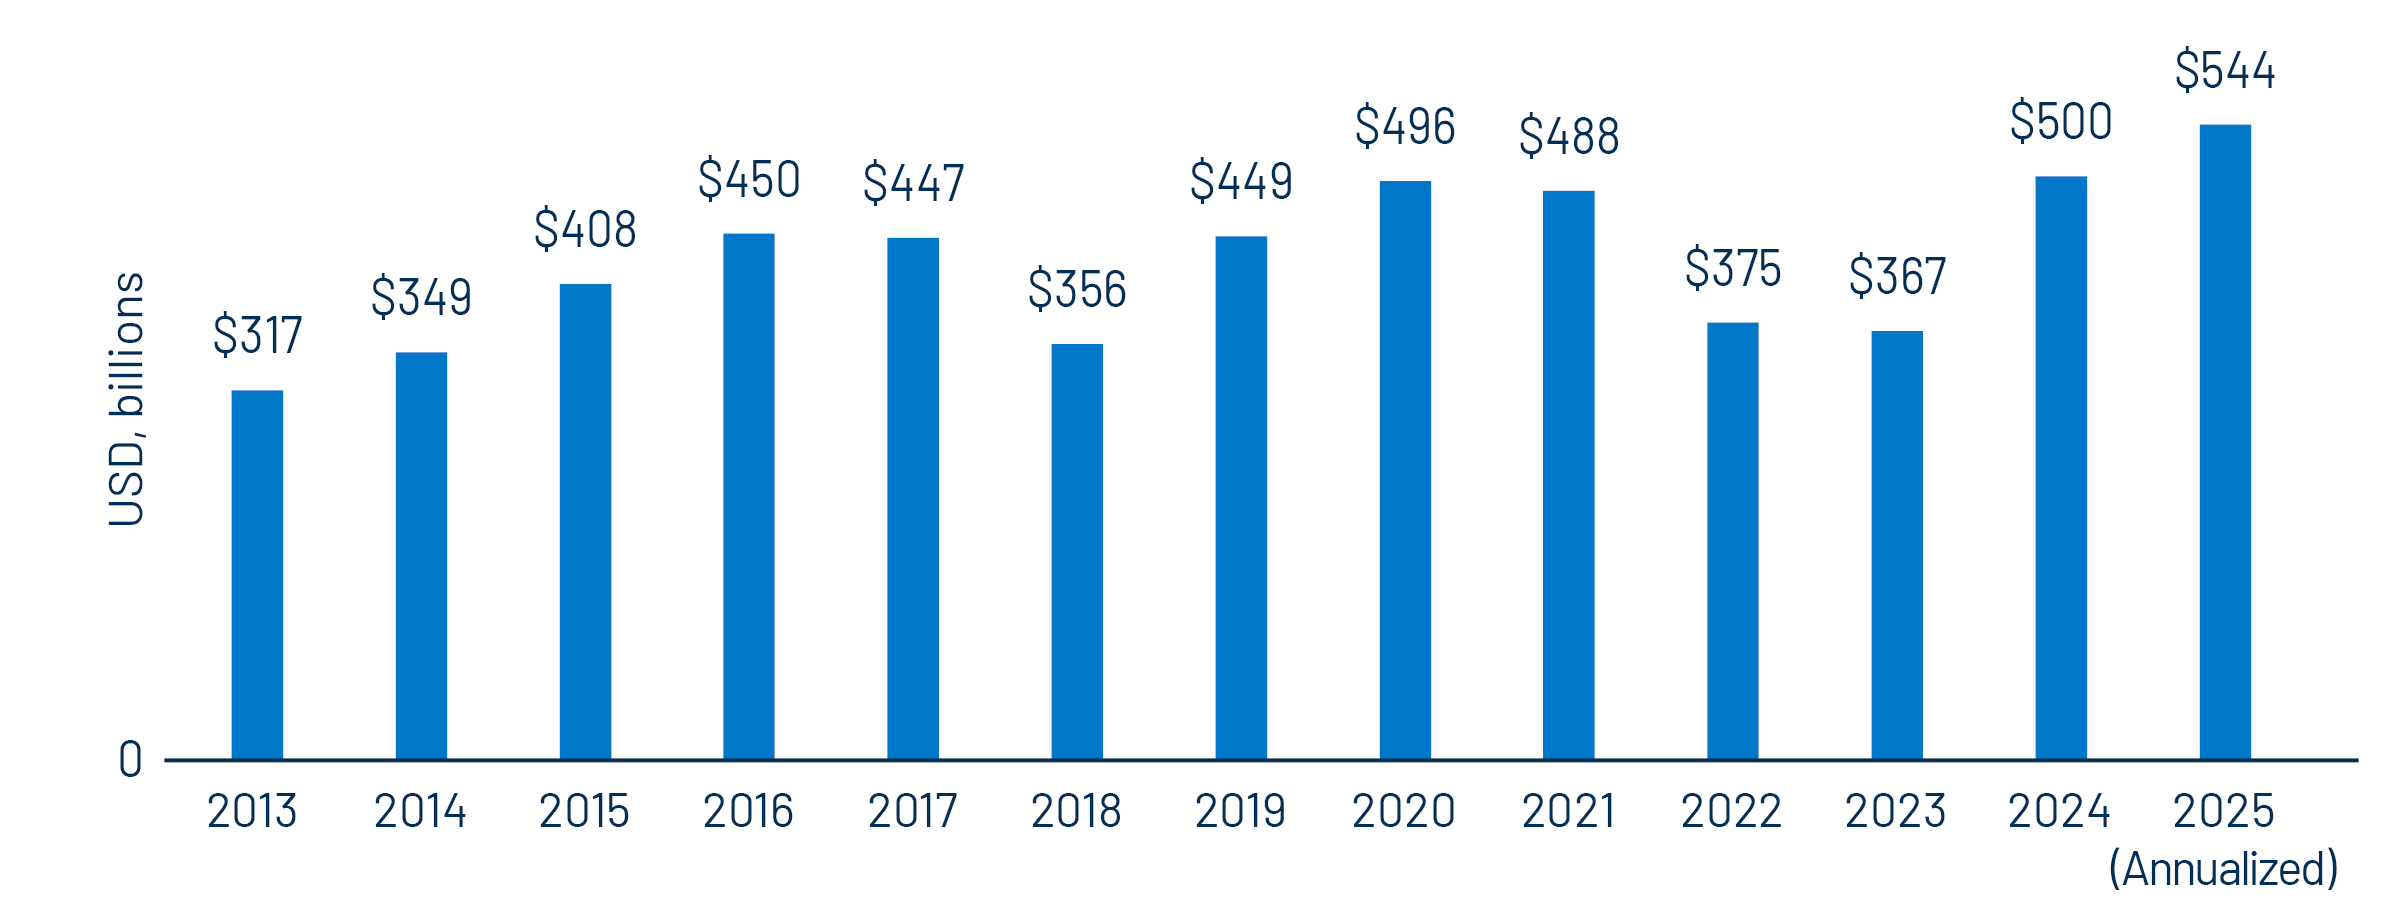
Supply (YTD supply of $227 billion; up 18% YoY): The muni market recorded $12 billion of new-issue supply last week, down 8% from the prior week. YTD, the muni market has recorded $227 billion of new issuance, up 18% year-over-year (YoY). Tax-exempt and taxable issuance are up 20% and 17%, respectively, though tax-exempt issuance has comprised the vast majority (93%) of YTD supply. This week’s calendar is expected to increase to $18 billion, which would mark the highest weekly issuance level in five years. The largest deals include $2.1 billion Dormitory Authority of the State of New York (NYU) and $1.1 billion New Jersey Turnpike Authority transactions.

This Week in Munis: Underperformance Underscores Opportunity

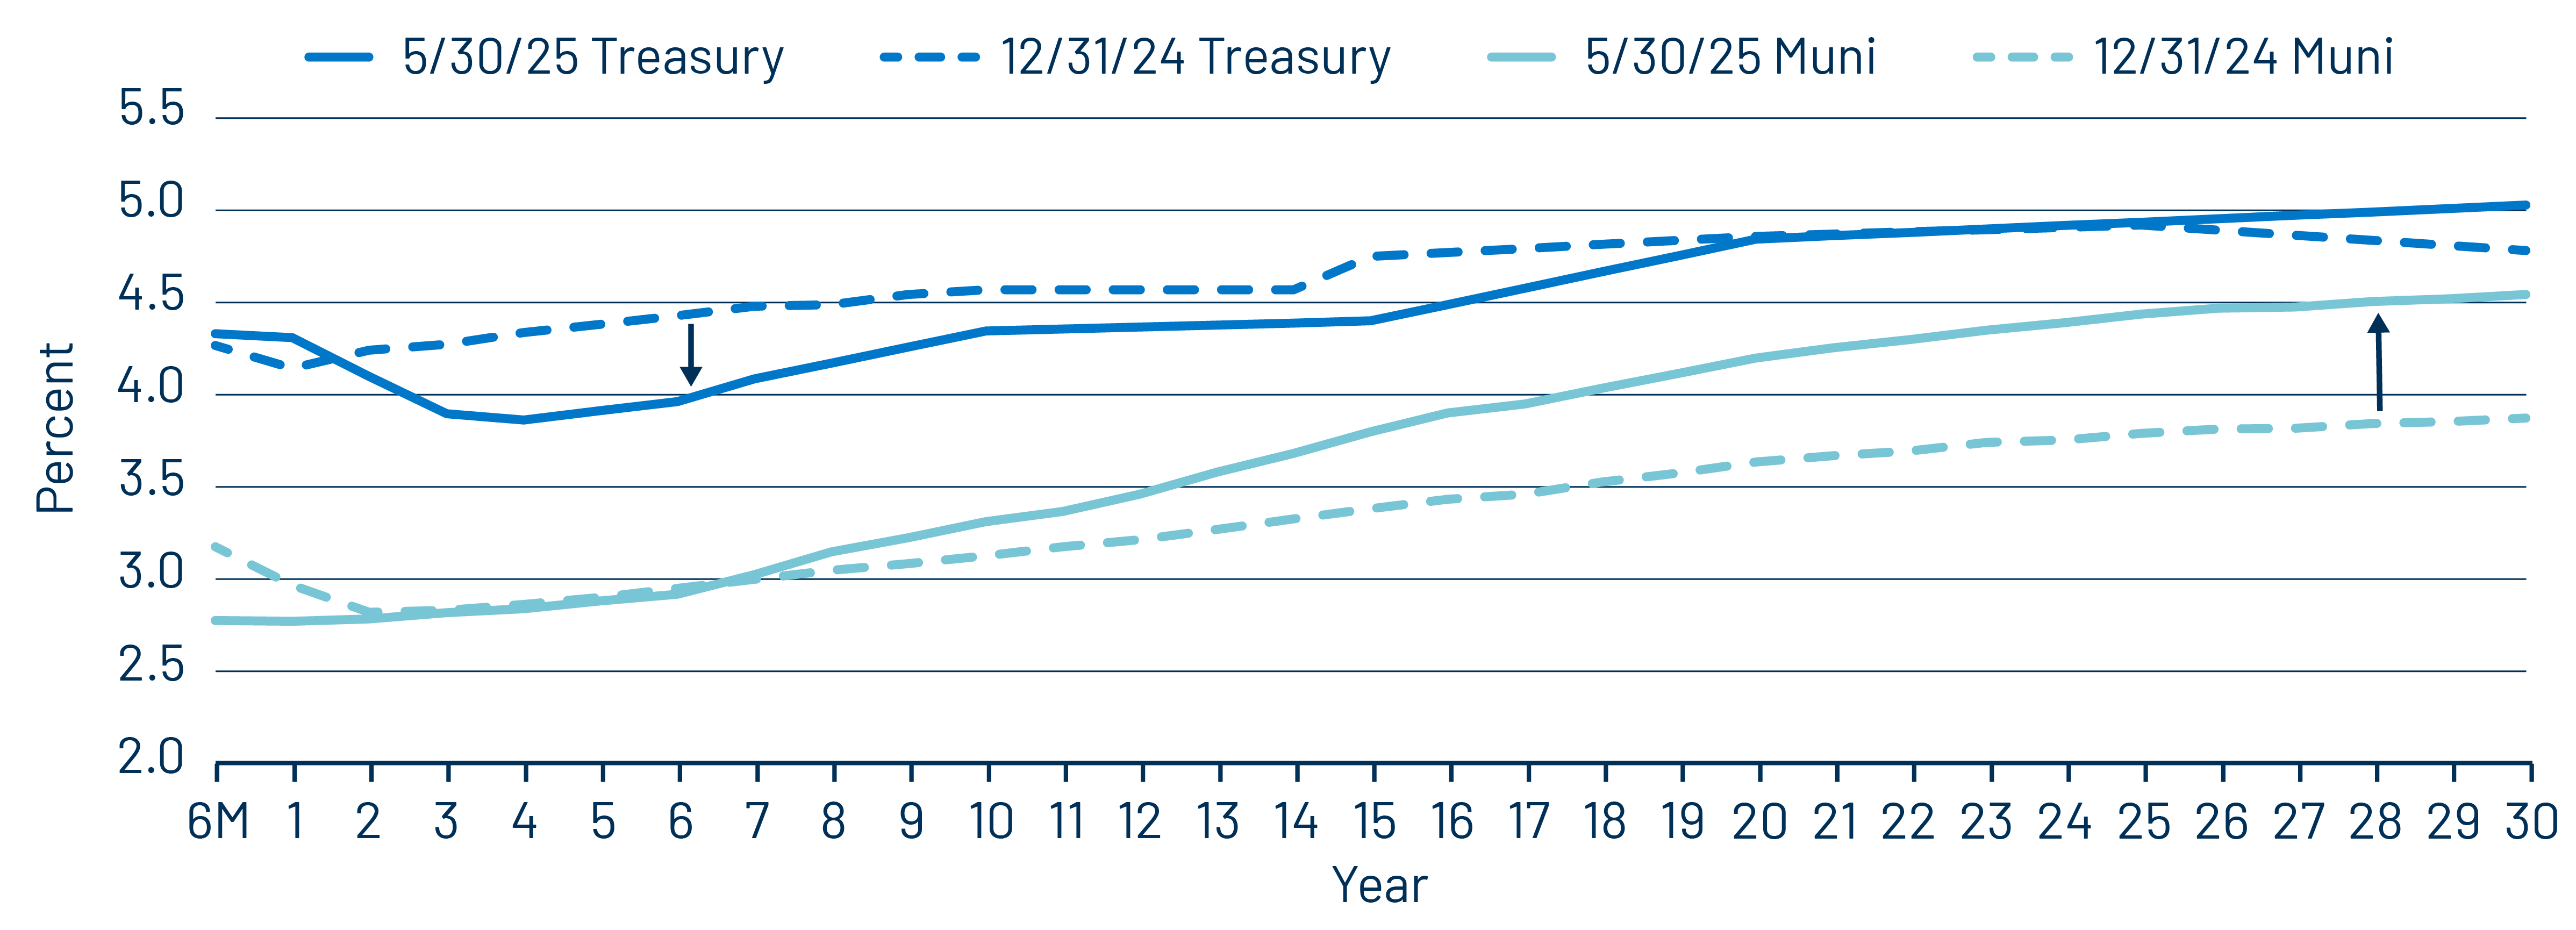
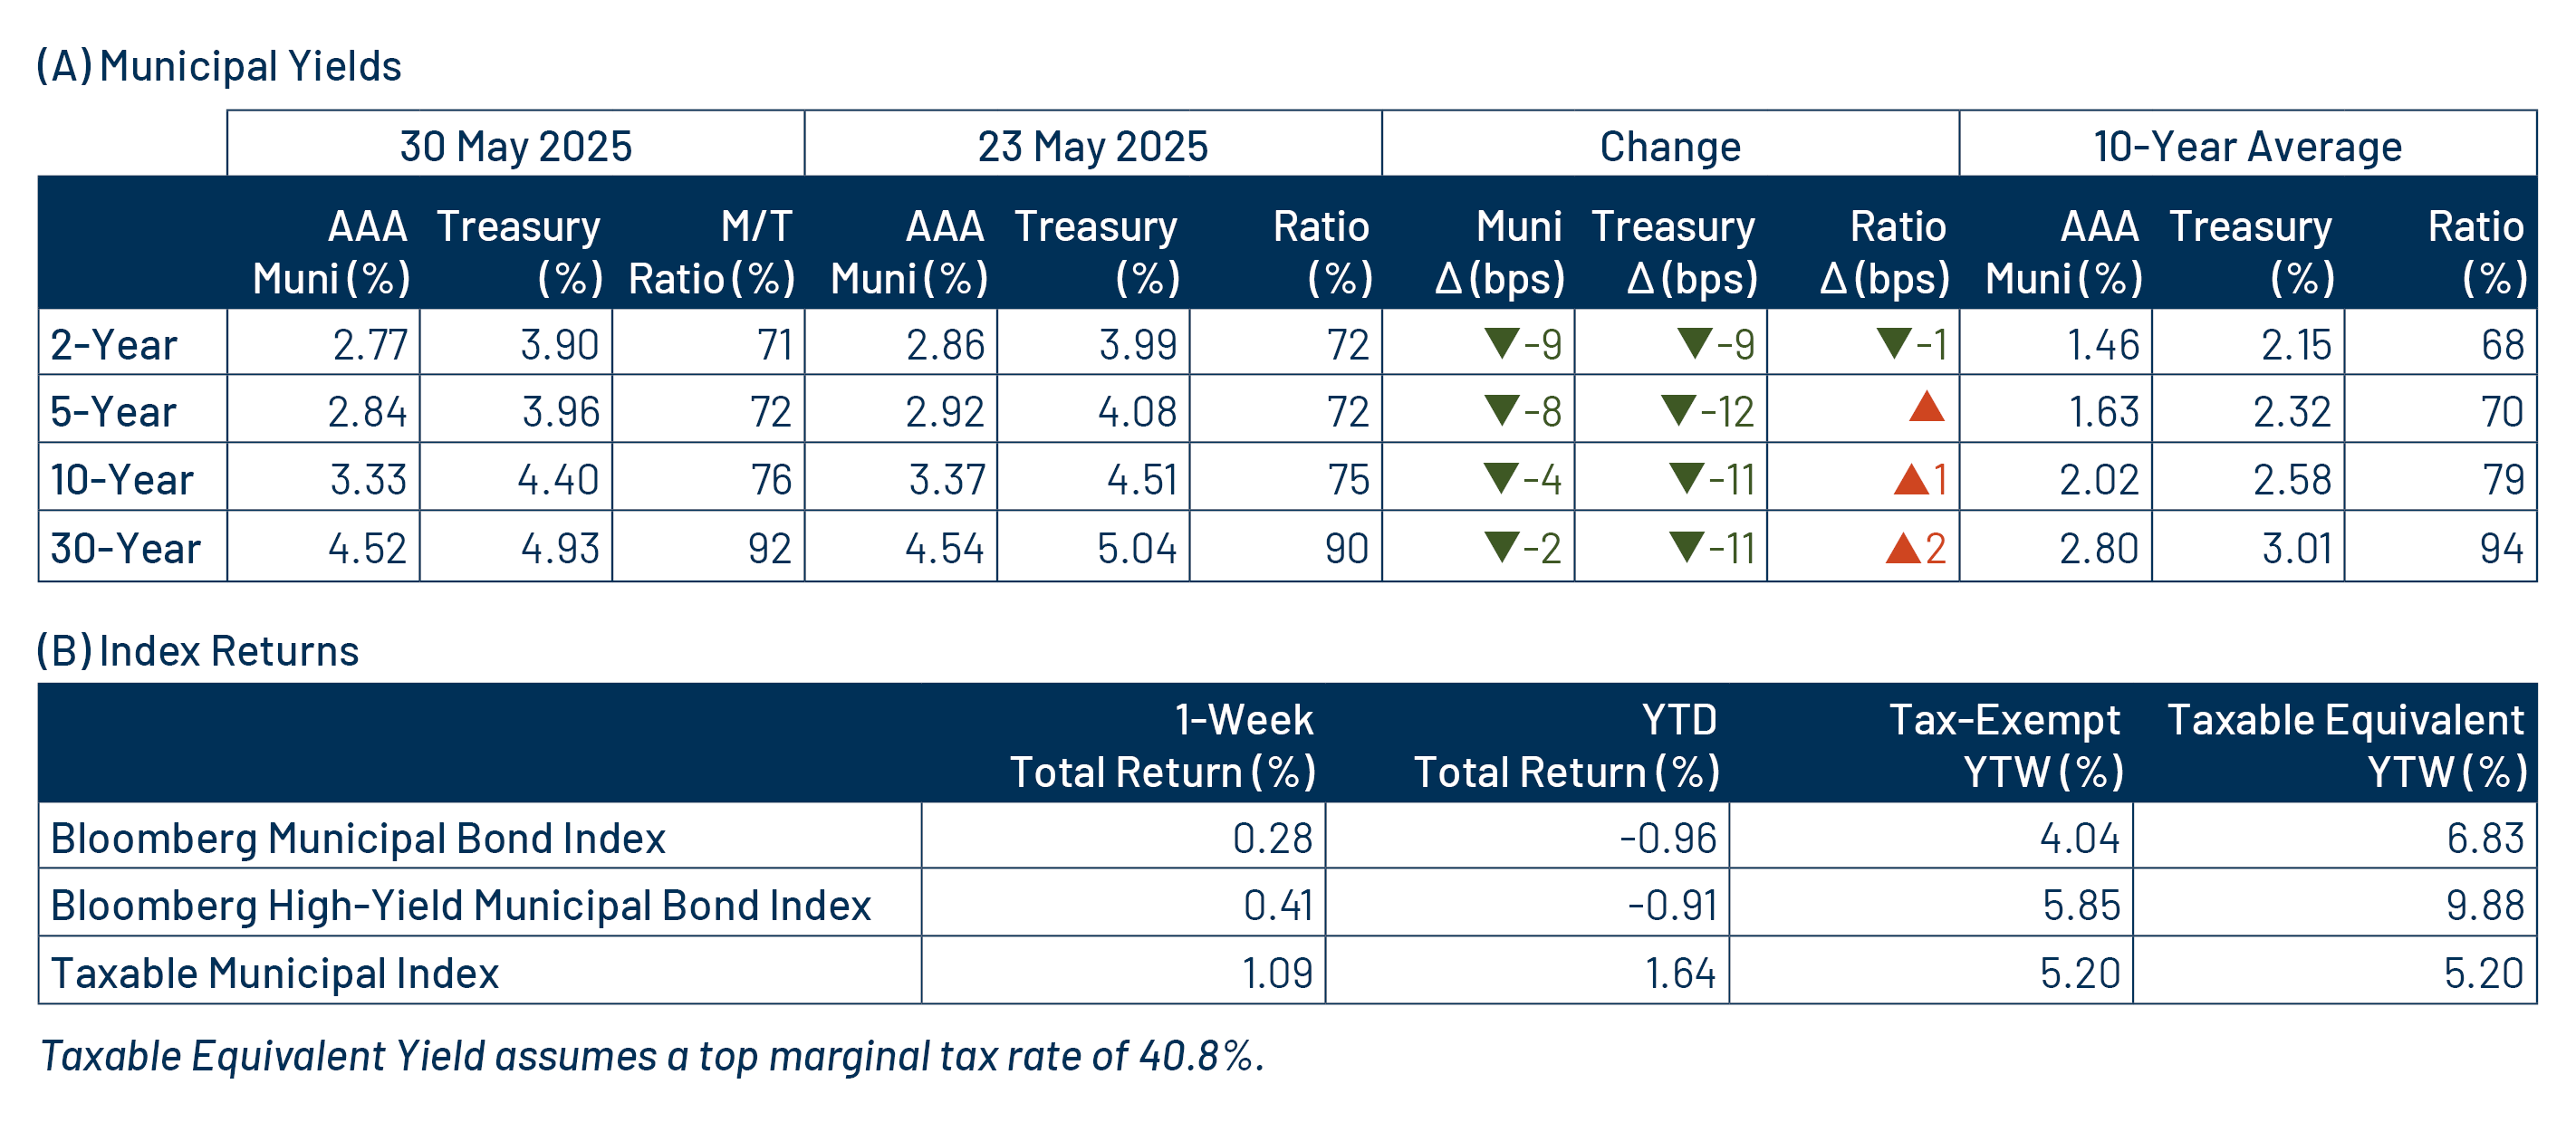
Through the end of May, the Bloomberg Municipal Bond Index returned -0.96% YTD, underperforming both the Bloomberg Treasury Index and the US Corporate Index, which posted positive returns of 2.51% and 2.26%, respectively. While the Treasury curve generally moved lower across most maturities this year, the highest-grade muni curve (AAA municipal market data) generally moved higher by as much as 62 bps.

Exhibit 1: AAA Municipal vs. Treasury Yield Curves
AAA Municipal vs. Treasury Yield Curves
Source: Bloomberg, Thomson Reuters, Western Asset. As of 30 May 25. Select the image to expand the view.

This year’s underperformance has been largely attributable to challenged supply and demand technicals. YTD new-issue supply of $223 billion has exceeded prior-year record levels by 20%. Meanwhile, from a demand perspective, muni mutual funds have recorded modest inflows of $6 billion, down from prior-year levels and not sufficient to absorb the record supply levels. Demand remains hampered by individual investors anchoring high-quality allocations to cash equivalents (e.g., money market funds), and more recently by seasonal tax-related weakness that has been exacerbated by overall market volatility.

Exhibit 2: Total Municipal Supply
Total Municipal Supply
Source: Bloomberg, Western Asset. As of 30 May 25. Select the image to expand the view.

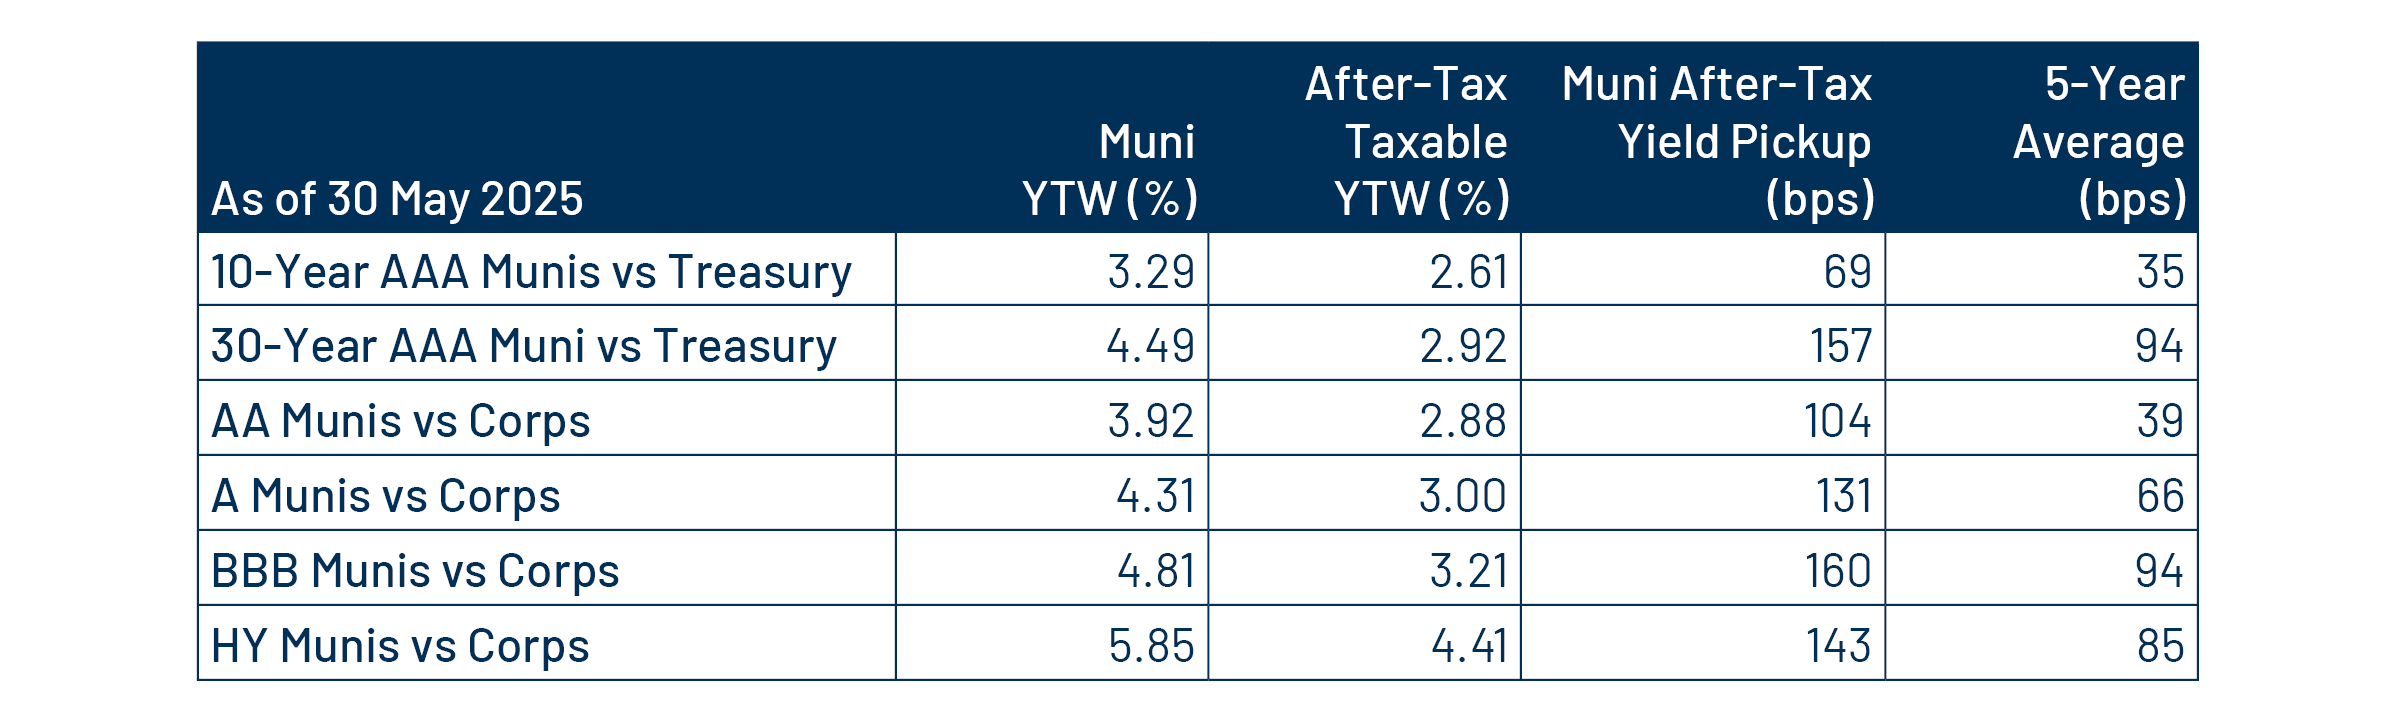
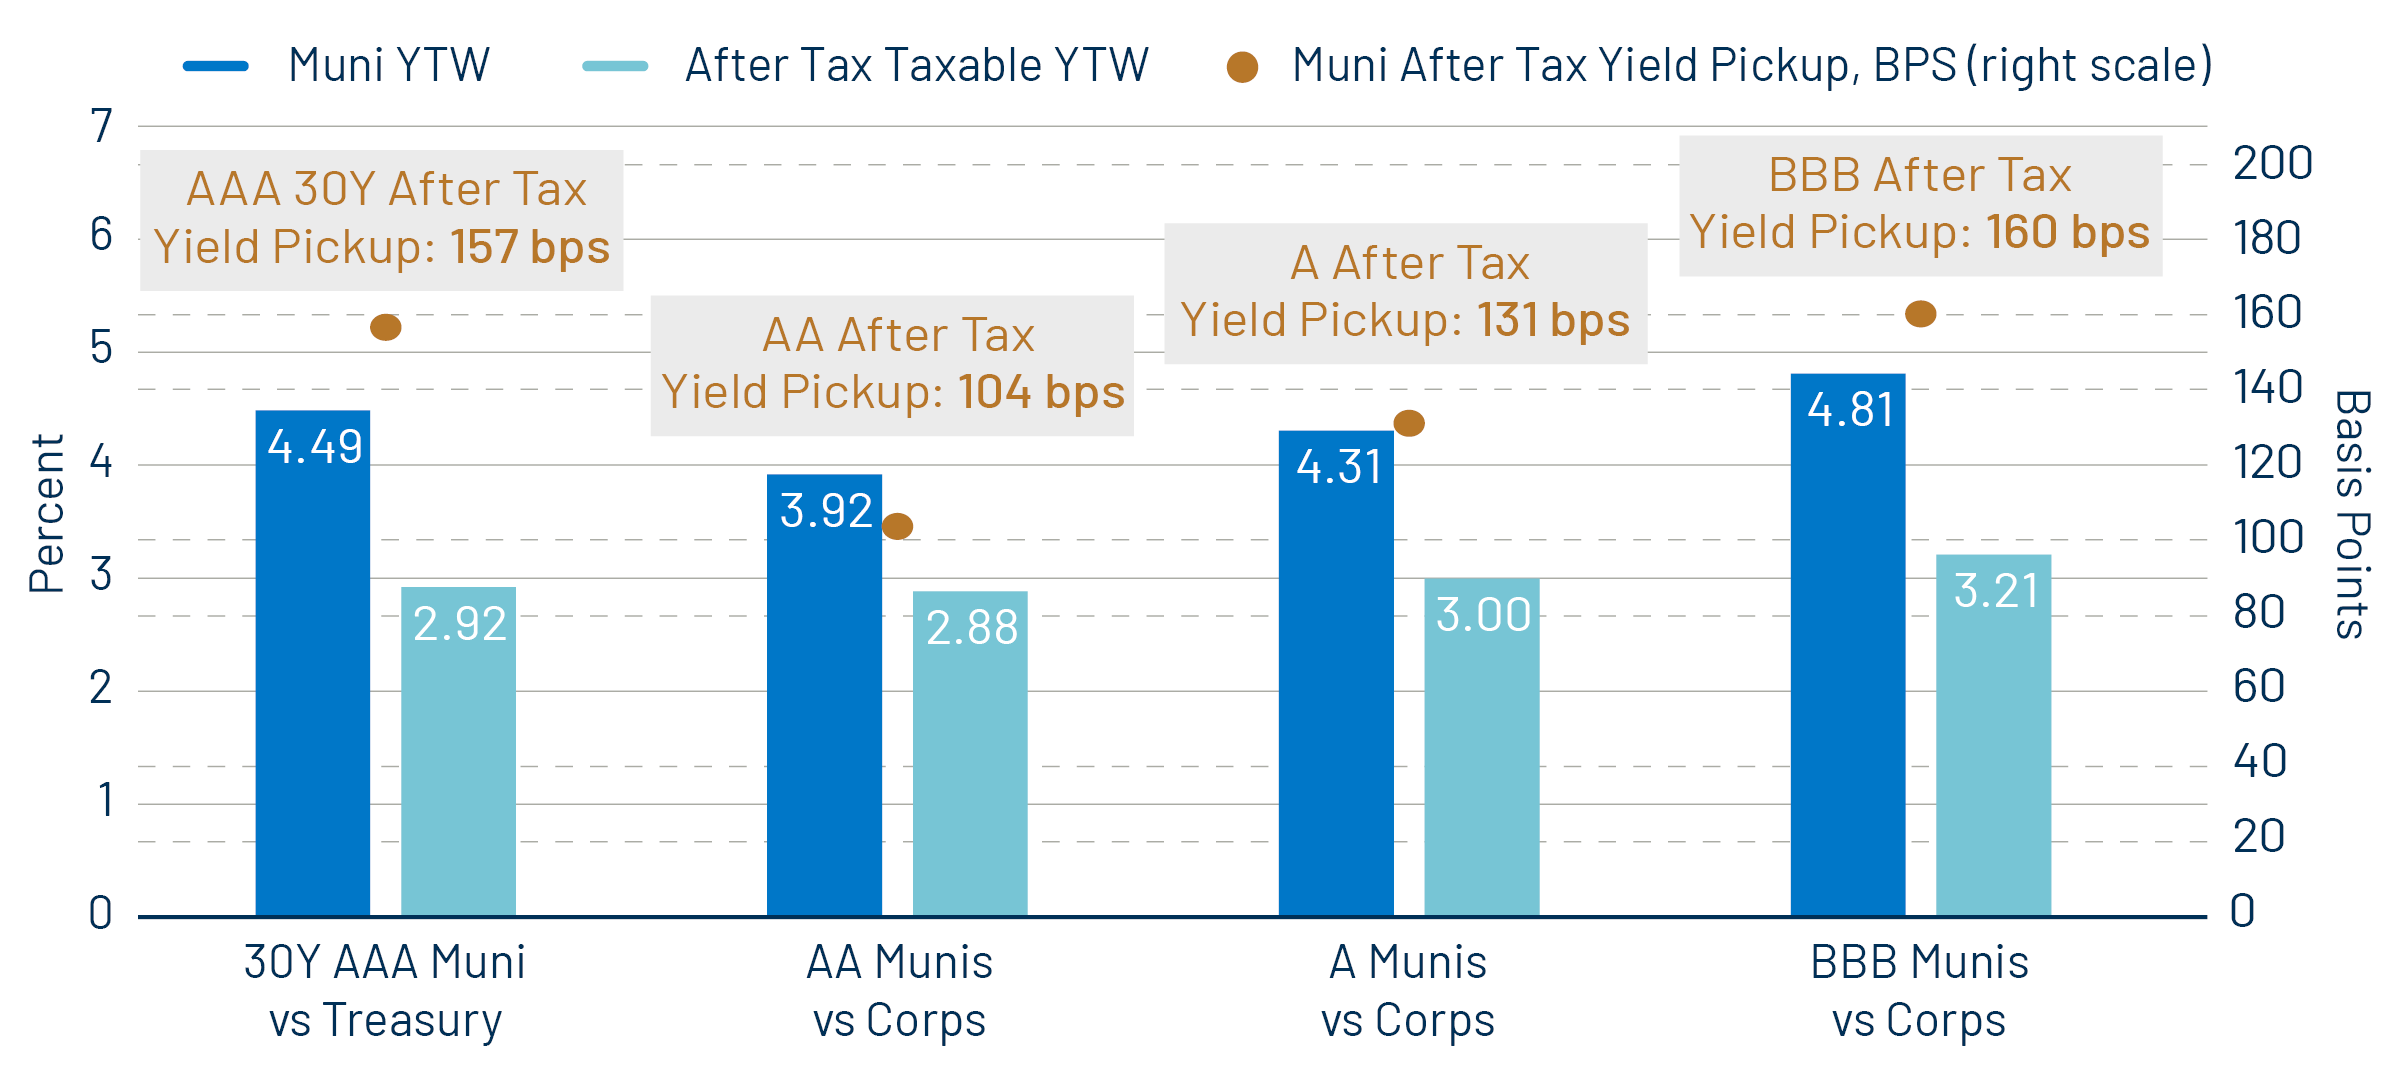
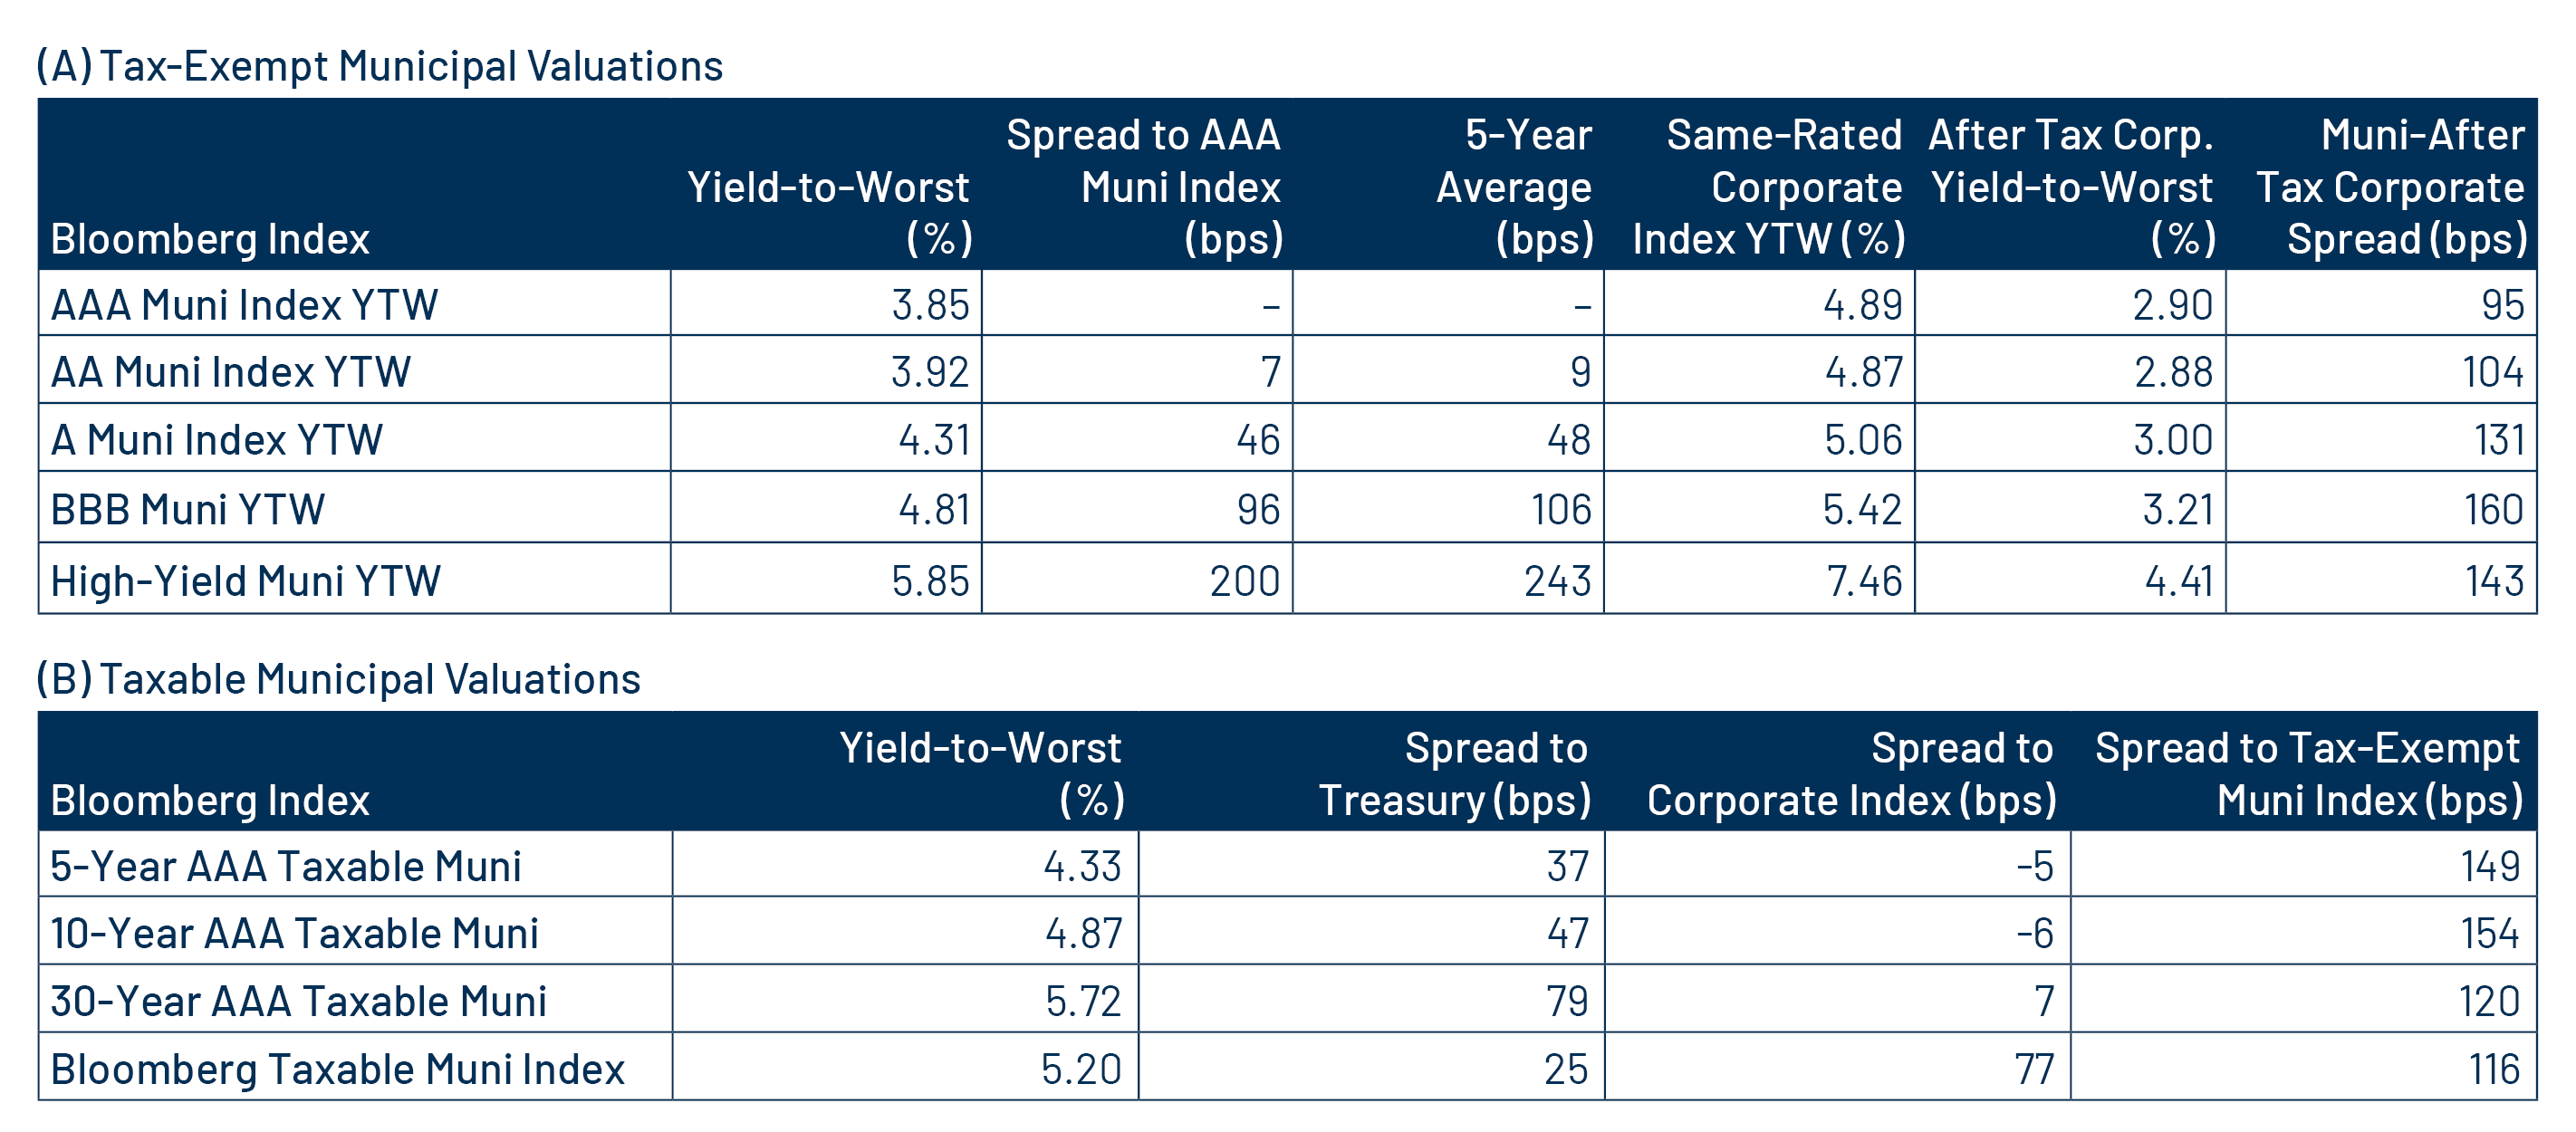
The underperformance, despite generally favorable credit fundamentals, contributes to the value we recognize in the municipal asset class. The Bloomberg Municipal Bond Index has recorded only five negative calendar year returns over the past 40 years, and we anticipate that strengthening technicals in the mid to latter parts of the year can be supportive of sector performance. For investors subject to the highest tax bracket, the majority of the muni market offers over 100 bps of after-tax yield pickup versus comparable taxable counterparts. This pickup, along with expected Federal Reserve rate cuts pushing front-end rates lower, can support demand.

Exhibit 3: After-Tax Yield Pickup by Quality Cohort
After-Tax Yield Pickup by Quality Cohort
Source, Bloomberg, Western Asset. As of 30 May 25. 10- and 30-Year comparison reflects Bloomberg Valuation Service (BVAL) AAA Muni Curve and US On-/Off-the-Run Sovereign Curve. AA Muni reflects the Bloomberg AA Muni Bond Index. A Muni reflects the Bloomberg A Muni Bond Index. BBB Muni reflects the Bloomberg BBB Muni Bond Index. HY Muni reflects the Bloomberg High Yield Muni Bond Index. AA Corp reflects the Bloomberg AA Corporate Bond Index. A Corp reflects the Bloomberg A Corporate Bond Index. BBB Corp reflects the Bloomberg BBB Corporate Bond Index. After-tax yield considers top marginal tax rate of 40.8%. Indexes are unmanaged and one cannot directly invest in them. They do not include fees, expenses or sales charges. Past performance is not an indicator or a guarantee of future results. Select the image to expand the view.

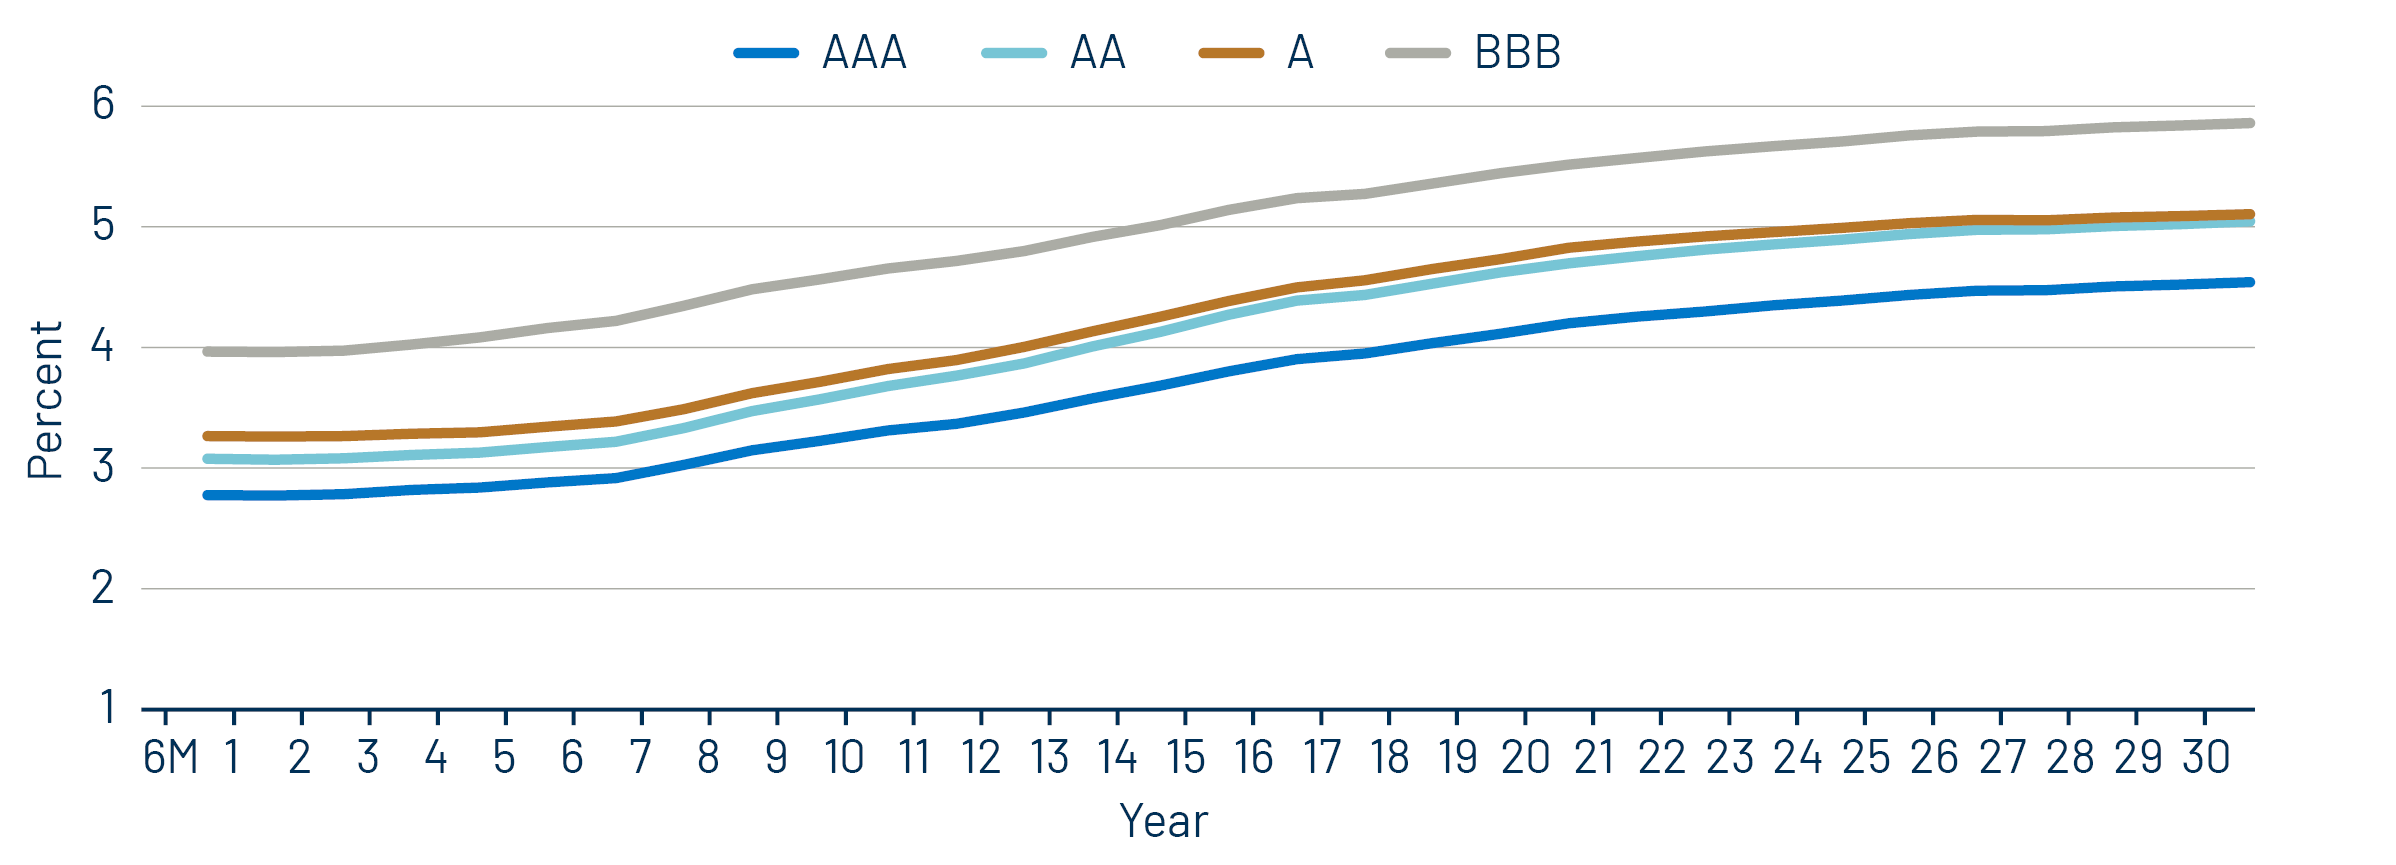
Municipal Credit Curves and Relative Value

Exhibit 4: Muni Credit Curves
Muni Credit Curves
Source: Bloomberg, Western Asset. As of 30 May 25. Bloomberg Valuation Service (BVAL) Municipal Credit Indices (AAA, AA, A, BBB, respectively) and US Sovereign Curves. Taxable-Equivalent Muni Credit Curves consider the top marginal effective tax rate of 40.8%. AA Muni is represented by the US General Obligation AA Muni BVAL Yield Curve. The BVAL curve is populated with pricing from uninsured AA General Obligation bonds. A Muni is represented by the US General Obligation A Muni BVAL Yield Curve. The BVAL curve is populated with pricing from uninsured A General Obligation bonds. BBB Muni is represented by the US General Obligation BBB Muni BVAL Yield Curve. The BVAL curve is populated with pricing from uninsured BBB General Obligation bonds. Indices are unmanaged and one cannot directly invest in them. They do not include fees, expenses or sales charges. Past performance is not an indicator or a guarantee of future results. Select the image to expand the view.
Exhibit 5: Taxable-Equivalent Muni Credit Curves
Taxable-Equivalent Muni Credit Curves
Source: Bloomberg, Western Asset. As of 30 May 25. Bloomberg Valuation Service (BVAL) Municipal Credit Indices (AAA, AA, A, BBB, respectively) and US Sovereign Curves. Taxable-Equivalent Muni Credit Curves consider the top marginal effective tax rate of 40.8%. AA Muni is represented by the US General Obligation AA Muni BVAL Yield Curve. The BVAL curve is populated with pricing from uninsured AA General Obligation bonds. A Muni is represented by the US General Obligation A Muni BVAL Yield Curve. The BVAL curve is populated with pricing from uninsured A General Obligation bonds. BBB Muni is represented by the US General Obligation BBB Muni BVAL Yield Curve. The BVAL curve is populated with pricing from uninsured BBB General Obligation bonds. Indices are unmanaged and one cannot directly invest in them. They do not include fees, expenses or sales charges. Past performance is not an indicator or a guarantee of future results. Select the image to expand the view.
Exhibit 6: AAA Munis vs. Treasuries
AAA Munis vs. Treasuries
Source: Muni Yields: Thomson Reuters MMD, Treasury Yields: Bloomberg. As of 30 May 25. Past performance is not a guarantee of future results. It is not possible to invest directly in an index. Select the image to expand the view.
Exhibit 7: Tax-Exempt and Taxable Muni Valuations
Tax-Exempt and Taxable Muni Valuations
Source: Bloomberg, Western Asset. As of 30 May 25. Yield-to-worst (YTW) is the lowest potential yield that can be received on a bond without the issuer actually defaulting. AAA, AA, A, BBB Corporate Indices; After-Tax Yield assumes a top effective tax rate of 40.8%. Taxable Muni Index Corporate comparable used is the Global Corporate Aggregate (ex. BBB) to better align credit quality and duration. Select the image to expand the view.

Western Asset Key Themes for Muni Investors

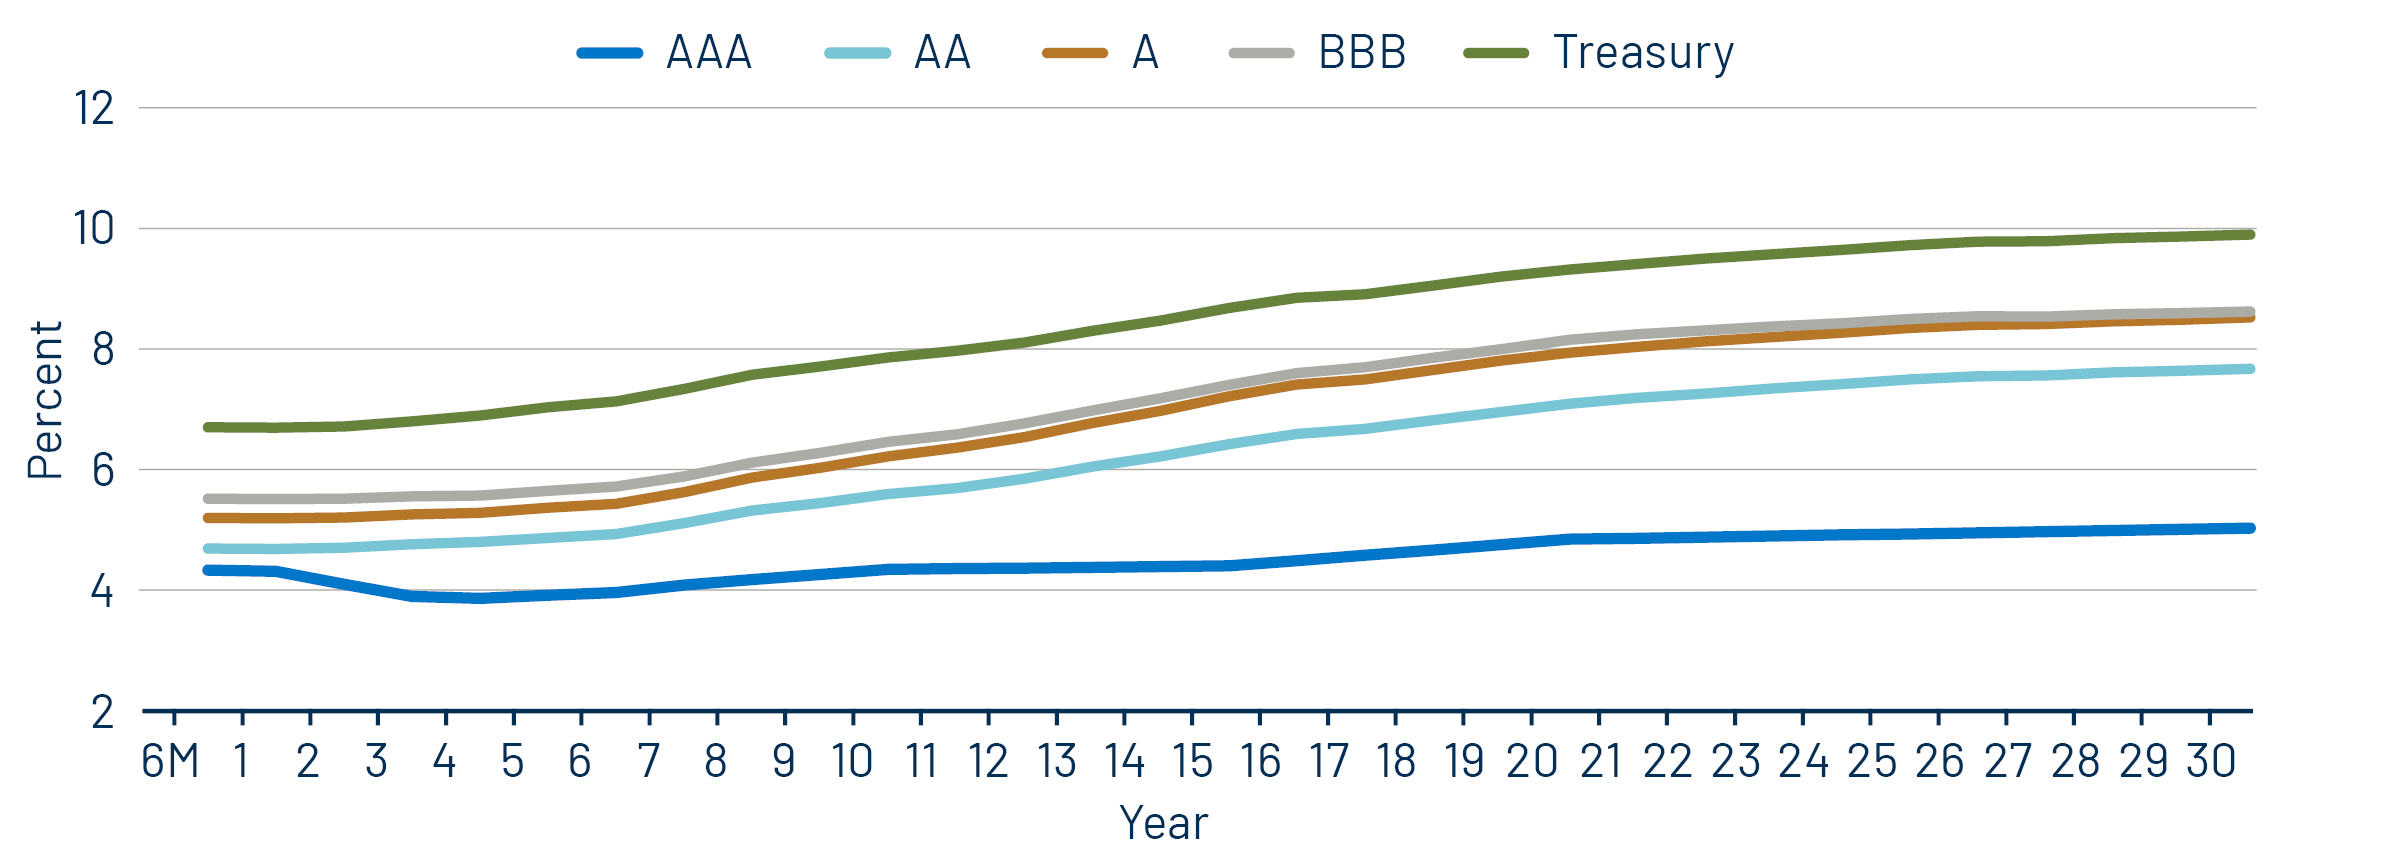
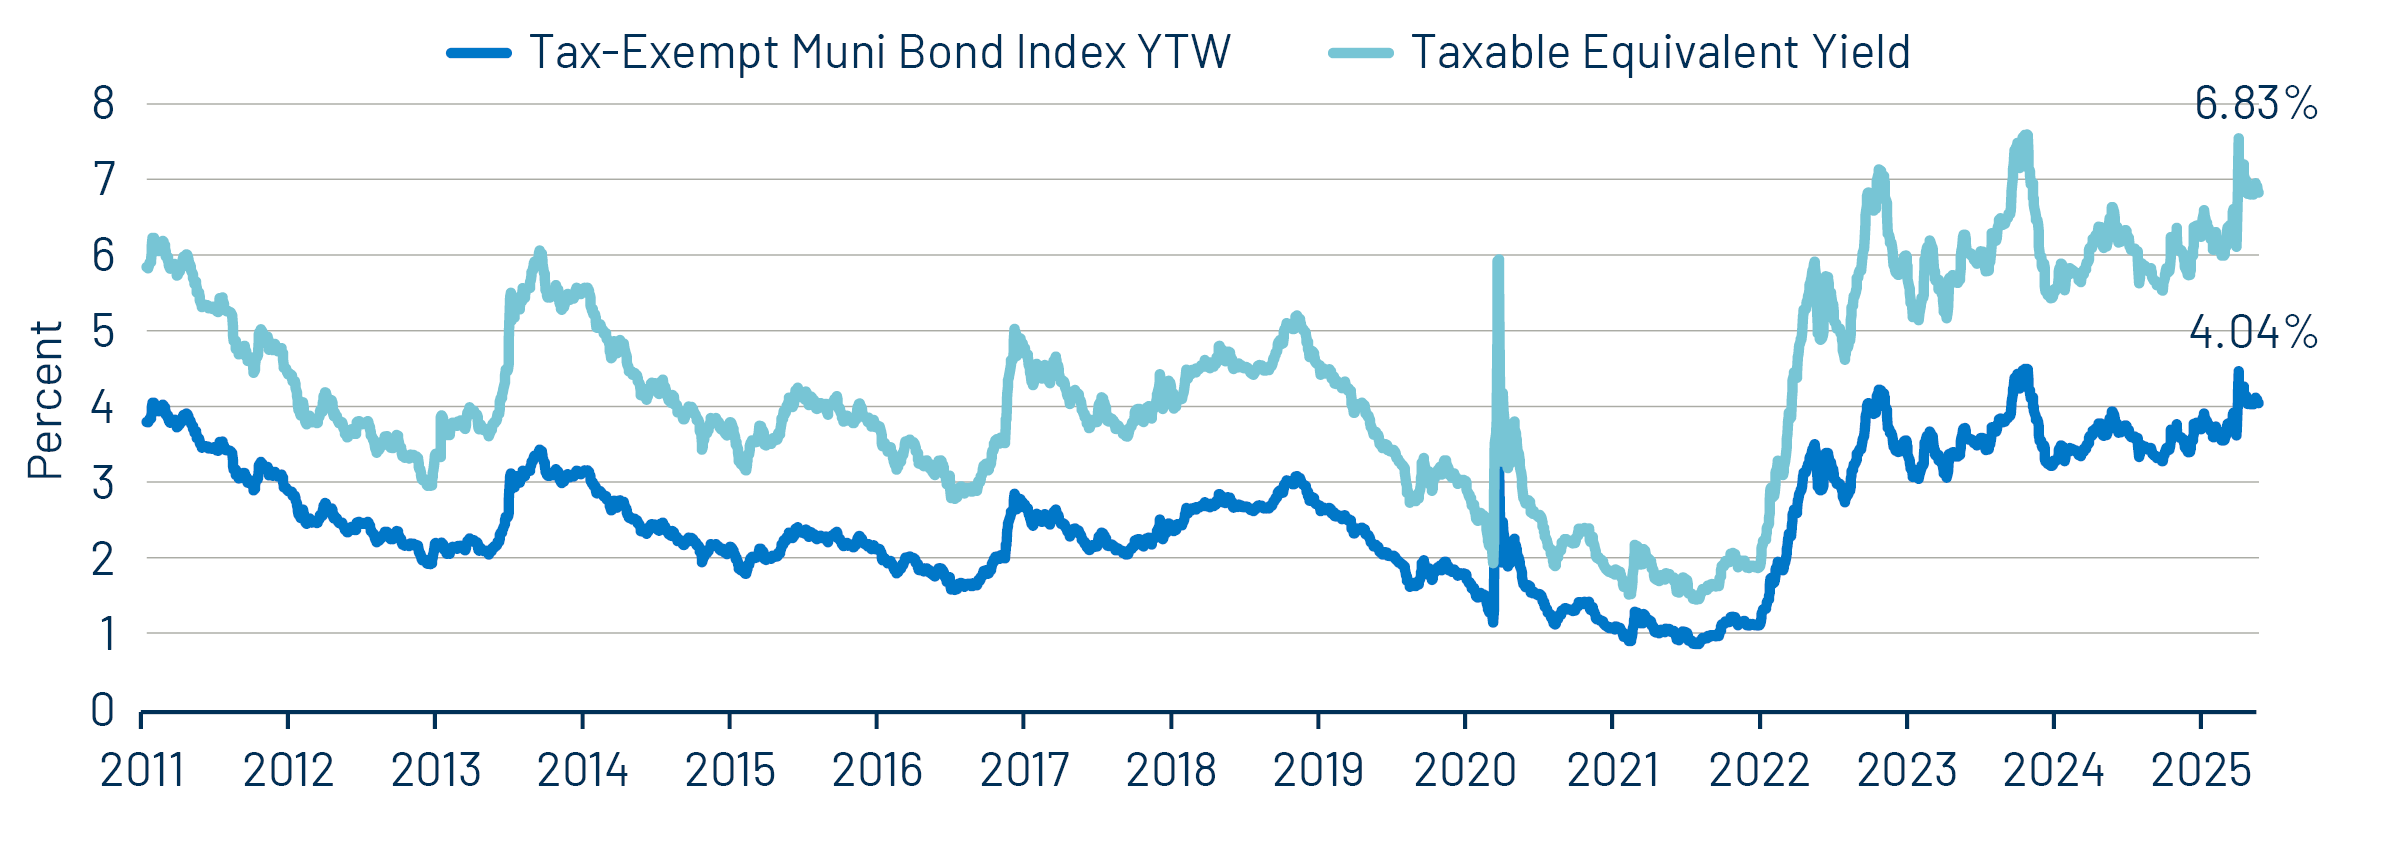
Theme #1: Municipal taxable-equivalent yields and income opportunities remain near decade-high levels.

Exhibit 8: Muni and Taxable-Equivalent Muni Yield-to-Worst
Muni and Taxable-Equivalent Muni Yield-to-Worst
Source: Bloomberg, Western Asset. As of 30 May 25. Bloomberg Municipal Bond Index yield considering highest marginal tax rate of 40.8%. Indexes are unmanaged and one cannot directly invest in them. They do not include fees, expenses or sales charges. Past performance is not an indicator or a guarantee of future results. Select the image to expand the view.

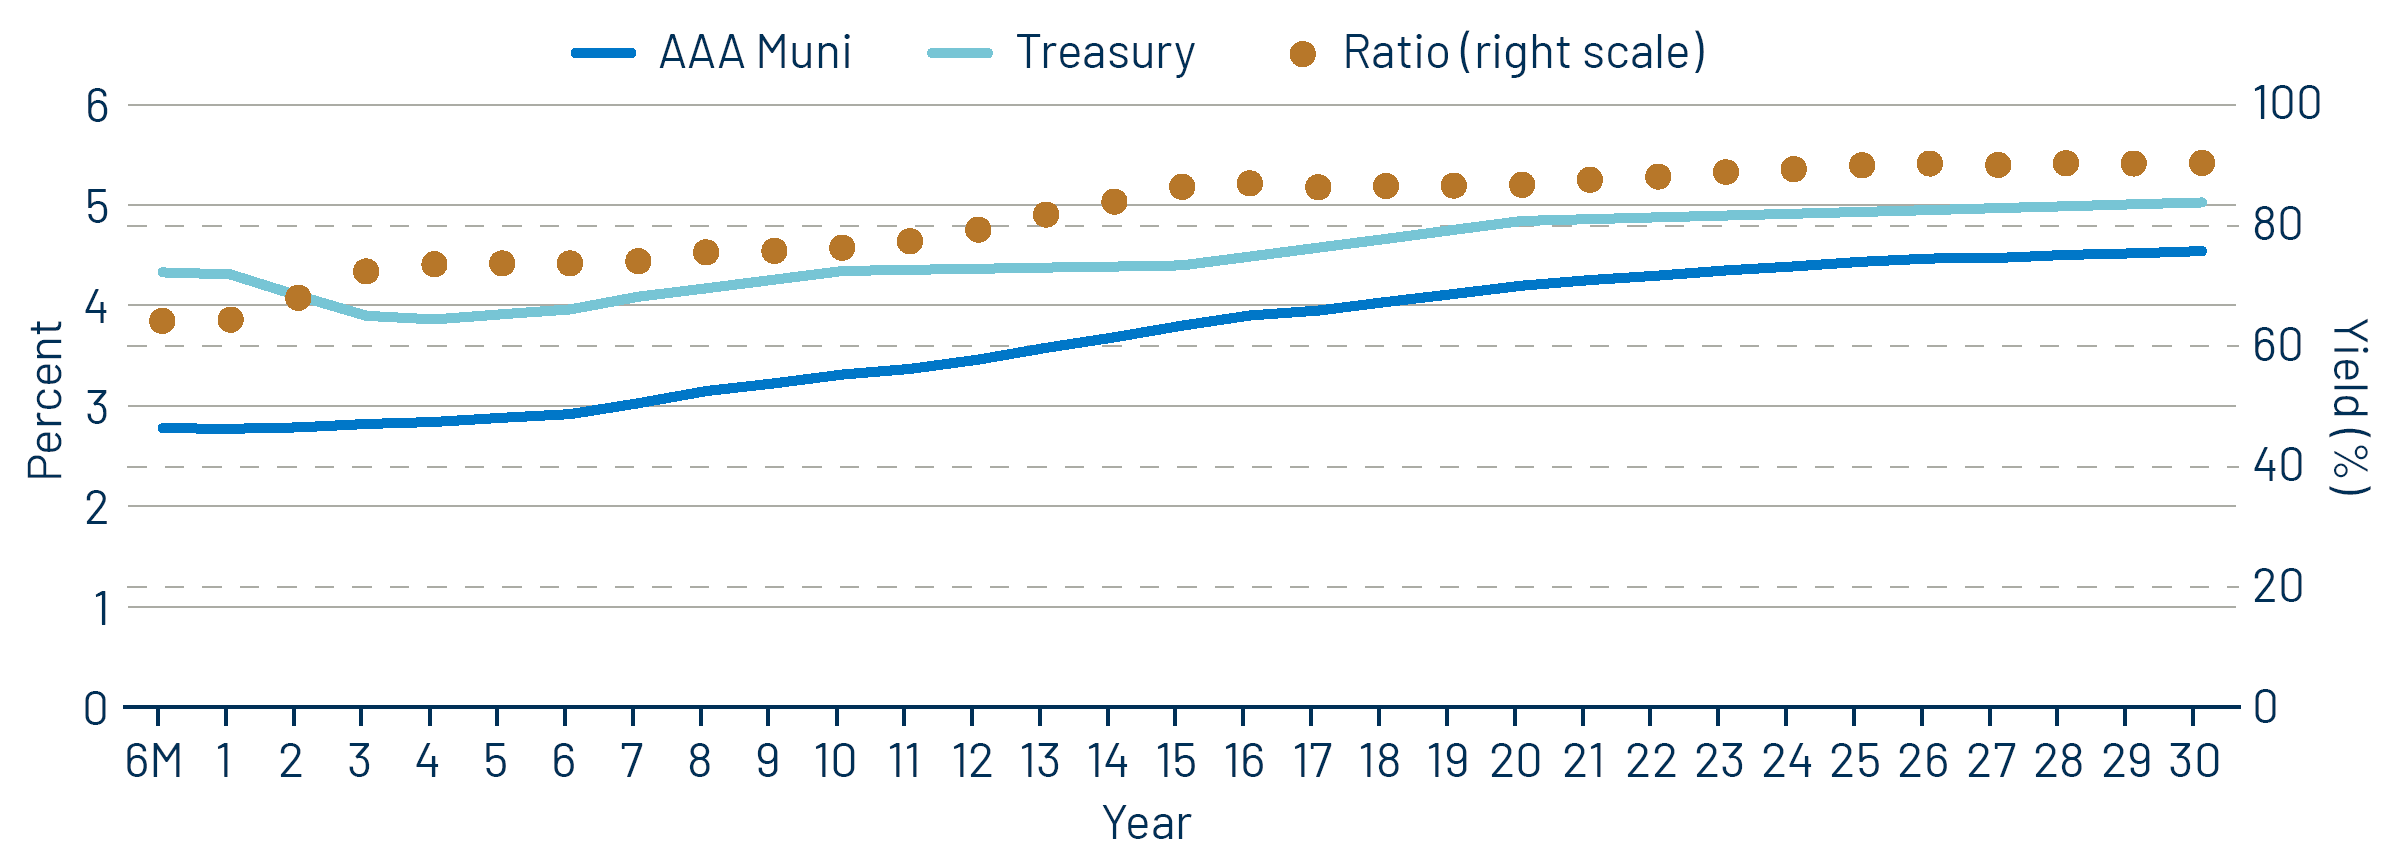
Theme #2: The muni curve has steepened, offering better value in intermediate and longer maturities.

Exhibit 9: AAA Municipal vs. Treasury Yield Curves
AAA Municipal vs. Treasury Yield Curves
Source: Bloomberg, Western Asset. As of 30 May 25. Bloomberg Valuation Service (BVAL) AAA Muni Curve and US On-/Off-the-Run Sovereign Curve. Indexes are unmanaged and one cannot directly invest in them. They do not include fees, expenses or sales charges. Past performance is not an indicator or a guarantee of future results. Select the image to expand the view.

Theme #3: Munis offer attractive after-tax yield compared to taxable alternatives.

Exhibit 10: Municipal vs. Taxable Fixed-Income Yields by Quality
Municipal vs. Taxable Fixed-Income Yields by Quality
Source: Western Asset, Bloomberg. As 30 May 25. 10- and 30-Year comparison reflects Bloomberg Valuation Service (BVAL) AAA Muni Curve and US On-/Off-the-Run Sovereign Curve. AA Muni reflects the Bloomberg AA Muni Bond Index. A Muni reflects the Bloomberg A Muni Bond Index. BBB Muni reflects the Bloomberg BBB Muni Bond Index. HY Muni reflects the Bloomberg High Yield Muni Bond Index. AA Corp reflects the Bloomberg AA Corporate Bond Index. A Corp reflects the Bloomberg A Corporate Bond Index. BBB Corp reflects the Bloomberg BBB Corporate Bond Index. After-tax yield considers the top marginal tax rate of 40.8%. Indexes are unmanaged and one cannot directly invest in them. They do not include fees, expenses or sales charges. Past performance is not an indicator or a guarantee of future results. Select the image to expand the view.

© Western Asset Management Company, LLC 2025. The information contained in these materials ("the materials") is intended for the exclusive use of the designated recipient ("the recipient"). This information is proprietary and confidential and may contain commercially sensitive information, and may not be copied, reproduced or republished, in whole or in part, without the prior written consent of Western Asset Management Company ("Western Asset").
Past performance does not predict future returns. These materials should not be deemed to be a prediction or projection of future performance. These materials are intended for investment professionals including professional clients, eligible counterparties, and qualified investors only.
These materials have been produced for illustrative and informational purposes only. These materials contain Western Asset's opinions and beliefs as of the date designated on the materials; these views are subject to change and may not reflect real-time market developments and investment views.
Third party data may be used throughout the materials, and this data is believed to be accurate to the best of Western Asset's knowledge at the time of publication, but cannot be guaranteed. These materials may also contain strategy or product awards or rankings from independent third parties or industry publications which are based on unbiased quantitative and/or qualitative information determined independently by each third party or publication. In some cases, Western Asset may subscribe to these third party's standard industry services or publications. These standard subscriptions and services are available to all asset managers and do not influence rankings or awards in any way.
Investment strategies or products discussed herein may involve a high degree of risk, including the loss of some or all capital. Investments in any products or strategies described in these materials may be volatile, and investors should have the financial ability and willingness to accept such risks.
Unless otherwise noted, investment performance contained in these materials is reflective of a strategy composite. All other strategy data and information included in these materials reflects a representative portfolio which is an account in the composite that Western Asset believes most closely reflects the current portfolio management style of the strategy. Performance is not a consideration in the selection of the representative portfolio. The characteristics of the representative portfolio shown may differ from other accounts in the composite. Information regarding the representative portfolio and the other accounts in the composite are available upon request. Statements in these materials should not be considered investment advice. References, either general or specific, to securities and/or issuers in the materials are for illustrative purposes only and are not intended to be, and should not be interpreted as, recommendation to purchase or sell such securities. Employees and/or clients of Western Asset may have a position in the securities or issuers mentioned.
These materials are not intended to provide, and should not be relied on for, accounting, legal, tax, investment or other advice. The recipient should consult its own counsel, accountant, investment, tax, and any other advisers for this advice, including economic risks and merits, related to making an investment with Western Asset. The recipient is responsible for observing the applicable laws and regulations of their country of residence.
Founded in 1971, Western Asset Management Company is a global fixed-income investment manager with offices in Pasadena, New York, London, Singapore, Tokyo, Melbourne, São Paulo, Hong Kong, and Zürich. Western Asset is a wholly owned subsidiary of Franklin Resources, Inc. but operates autonomously. Western Asset is comprised of six legal entities across the globe, each with distinct regional registrations: Western Asset Management Company, LLC, a registered Investment Adviser with the Securities and Exchange Commission; Western Asset Management Company Ltda. is regulated by Comissão de Valores Mobiliários; Western Asset Management Company Pty Ltd ABN 41 117 767 923 is the holder of the Australian Financial Services License 303160; Western Asset Management Company Pte. Ltd. Co. Reg. No. 200007692R is a holder of a Capital Markets Services License for fund management and regulated by the Monetary Authority of Singapore; Western Asset Management Company Ltd, a registered Financial Instruments Business Operator and regulated by the Financial Services Agency of Japan; and Western Asset Management Company Limited is authorised and regulated by the Financial Conduct Authority ("FCA") (FRN 145930). This communication is intended for distribution to Professional Clients only if deemed to be a financial promotion in the UK as defined by the FCA. This communication may also be intended for certain EEA countries where Western Asset has been granted permission to do so. For the current list of the approved EEA countries please contact Western Asset at +44 (0)20 7422 3000.