skip navigation
Blog

Stay up to date on timely topics and market events. Subscribe to our Blog now.

MARKETS
April 12, 2022

Weekly Municipal Monitor—Tax Season Demand Technicals in Focus

By Dave Fare

Stay up to date on timely topics and market events. Subscribe to our Blog now.

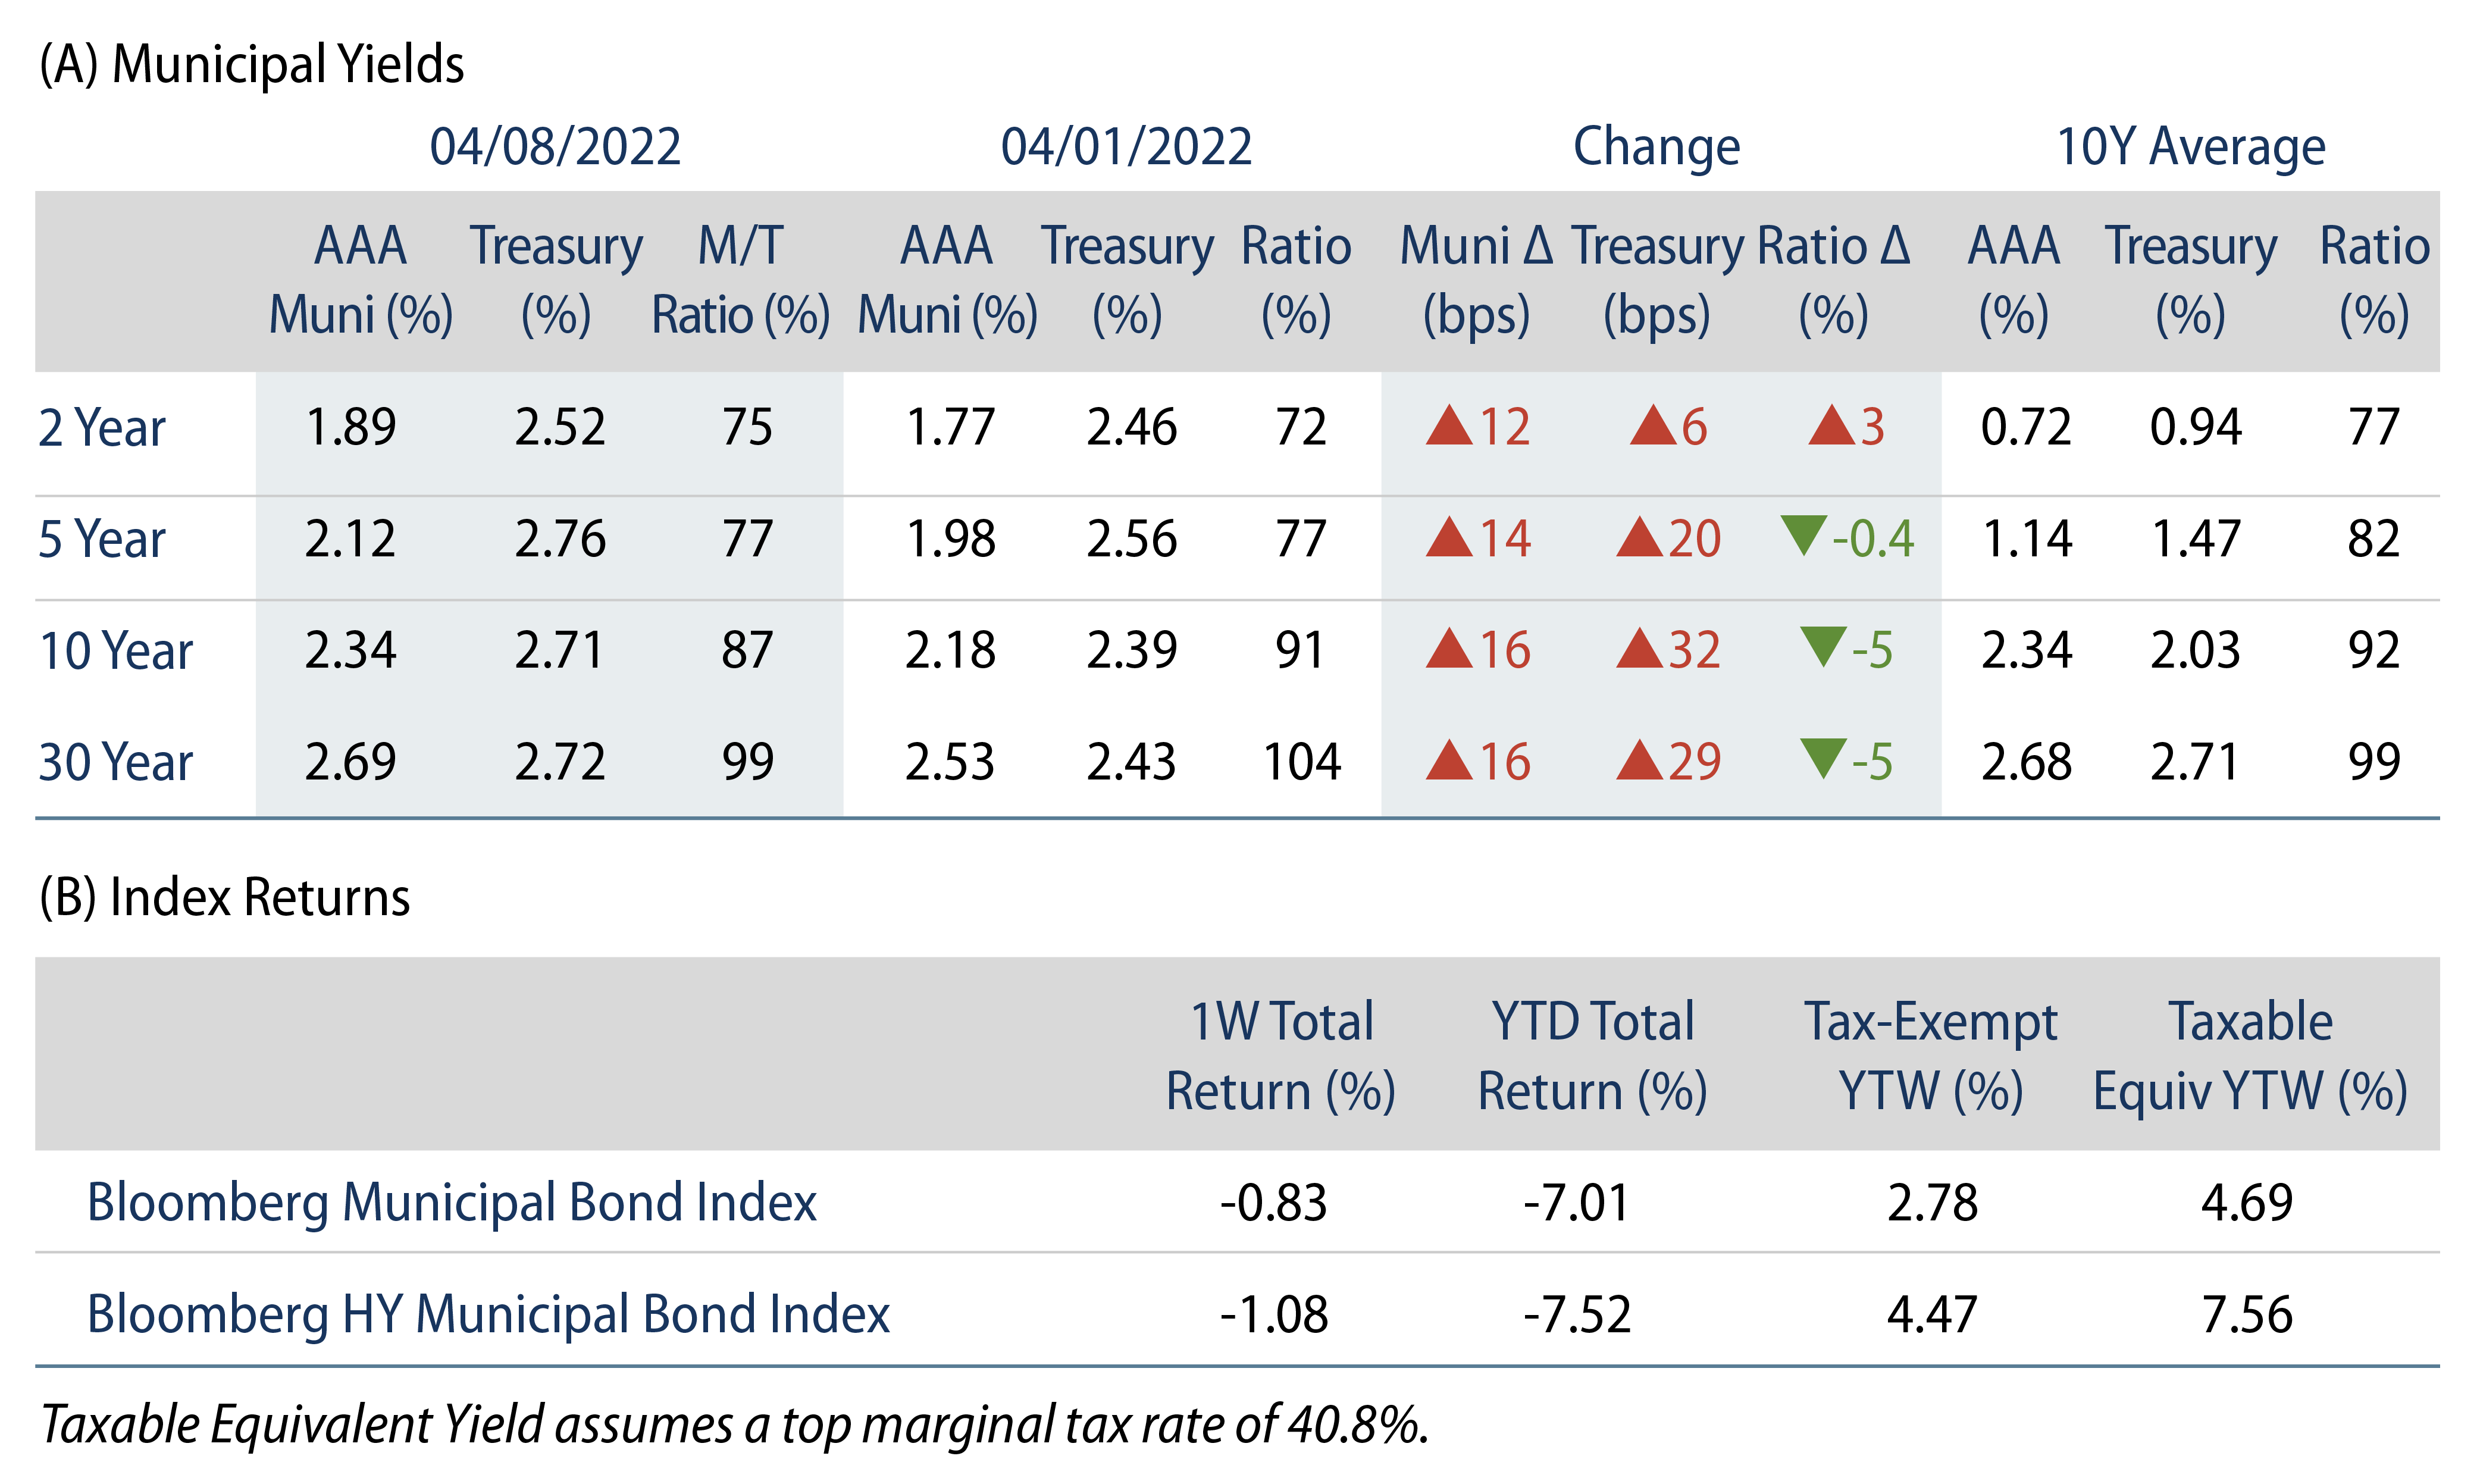
Municipals Posted Negative Returns During the Week

US municipals posted negative returns this week, with high-grade municipal yields moving 12-16 bps higher across the curve. Supply and demand technicals weakened as both fund outflows and supply increased. Munis underperformed Treasuries in short maturities and outperformed in long maturities. The Bloomberg Municipal Index returned -0.83%, while the HY Muni Index returned -1.08%. This week we highlight the seasonal demand weakness associated with tax season.

Market Technicals Remain Weak as Fund Outflows and Supply Increased

Fund Flows: During the week ending April 6, weekly reporting municipal mutual funds recorded $3.2 billion of outflows, according to Lipper. Long-term funds recorded $2.4 billion of outflows, high-yield funds recorded $1 billion of outflows, and intermediate funds recorded $566 million of outflows. The week’s fund outflows extend the current outflow streak to 13 consecutive weeks, contributing to $27 billion of net outflows year to date (YTD).

Supply: The muni market recorded $12.2 billion of new-issue volume, up 23% from the prior week. Total YTD issuance of $114 billion is 7% higher than last year’s levels, with tax-exempt issuance trending 19% higher year-over-year (YoY) and taxable issuance trending 28% lower YoY. This week’s new-issue calendar is expected to decline to $5 billion. Largest deals include $625 million Maryland Economic Development and $500 million President and Fellows Harvard College transactions.

This Week in Munis: Tax Season Demand Technicals in Focus

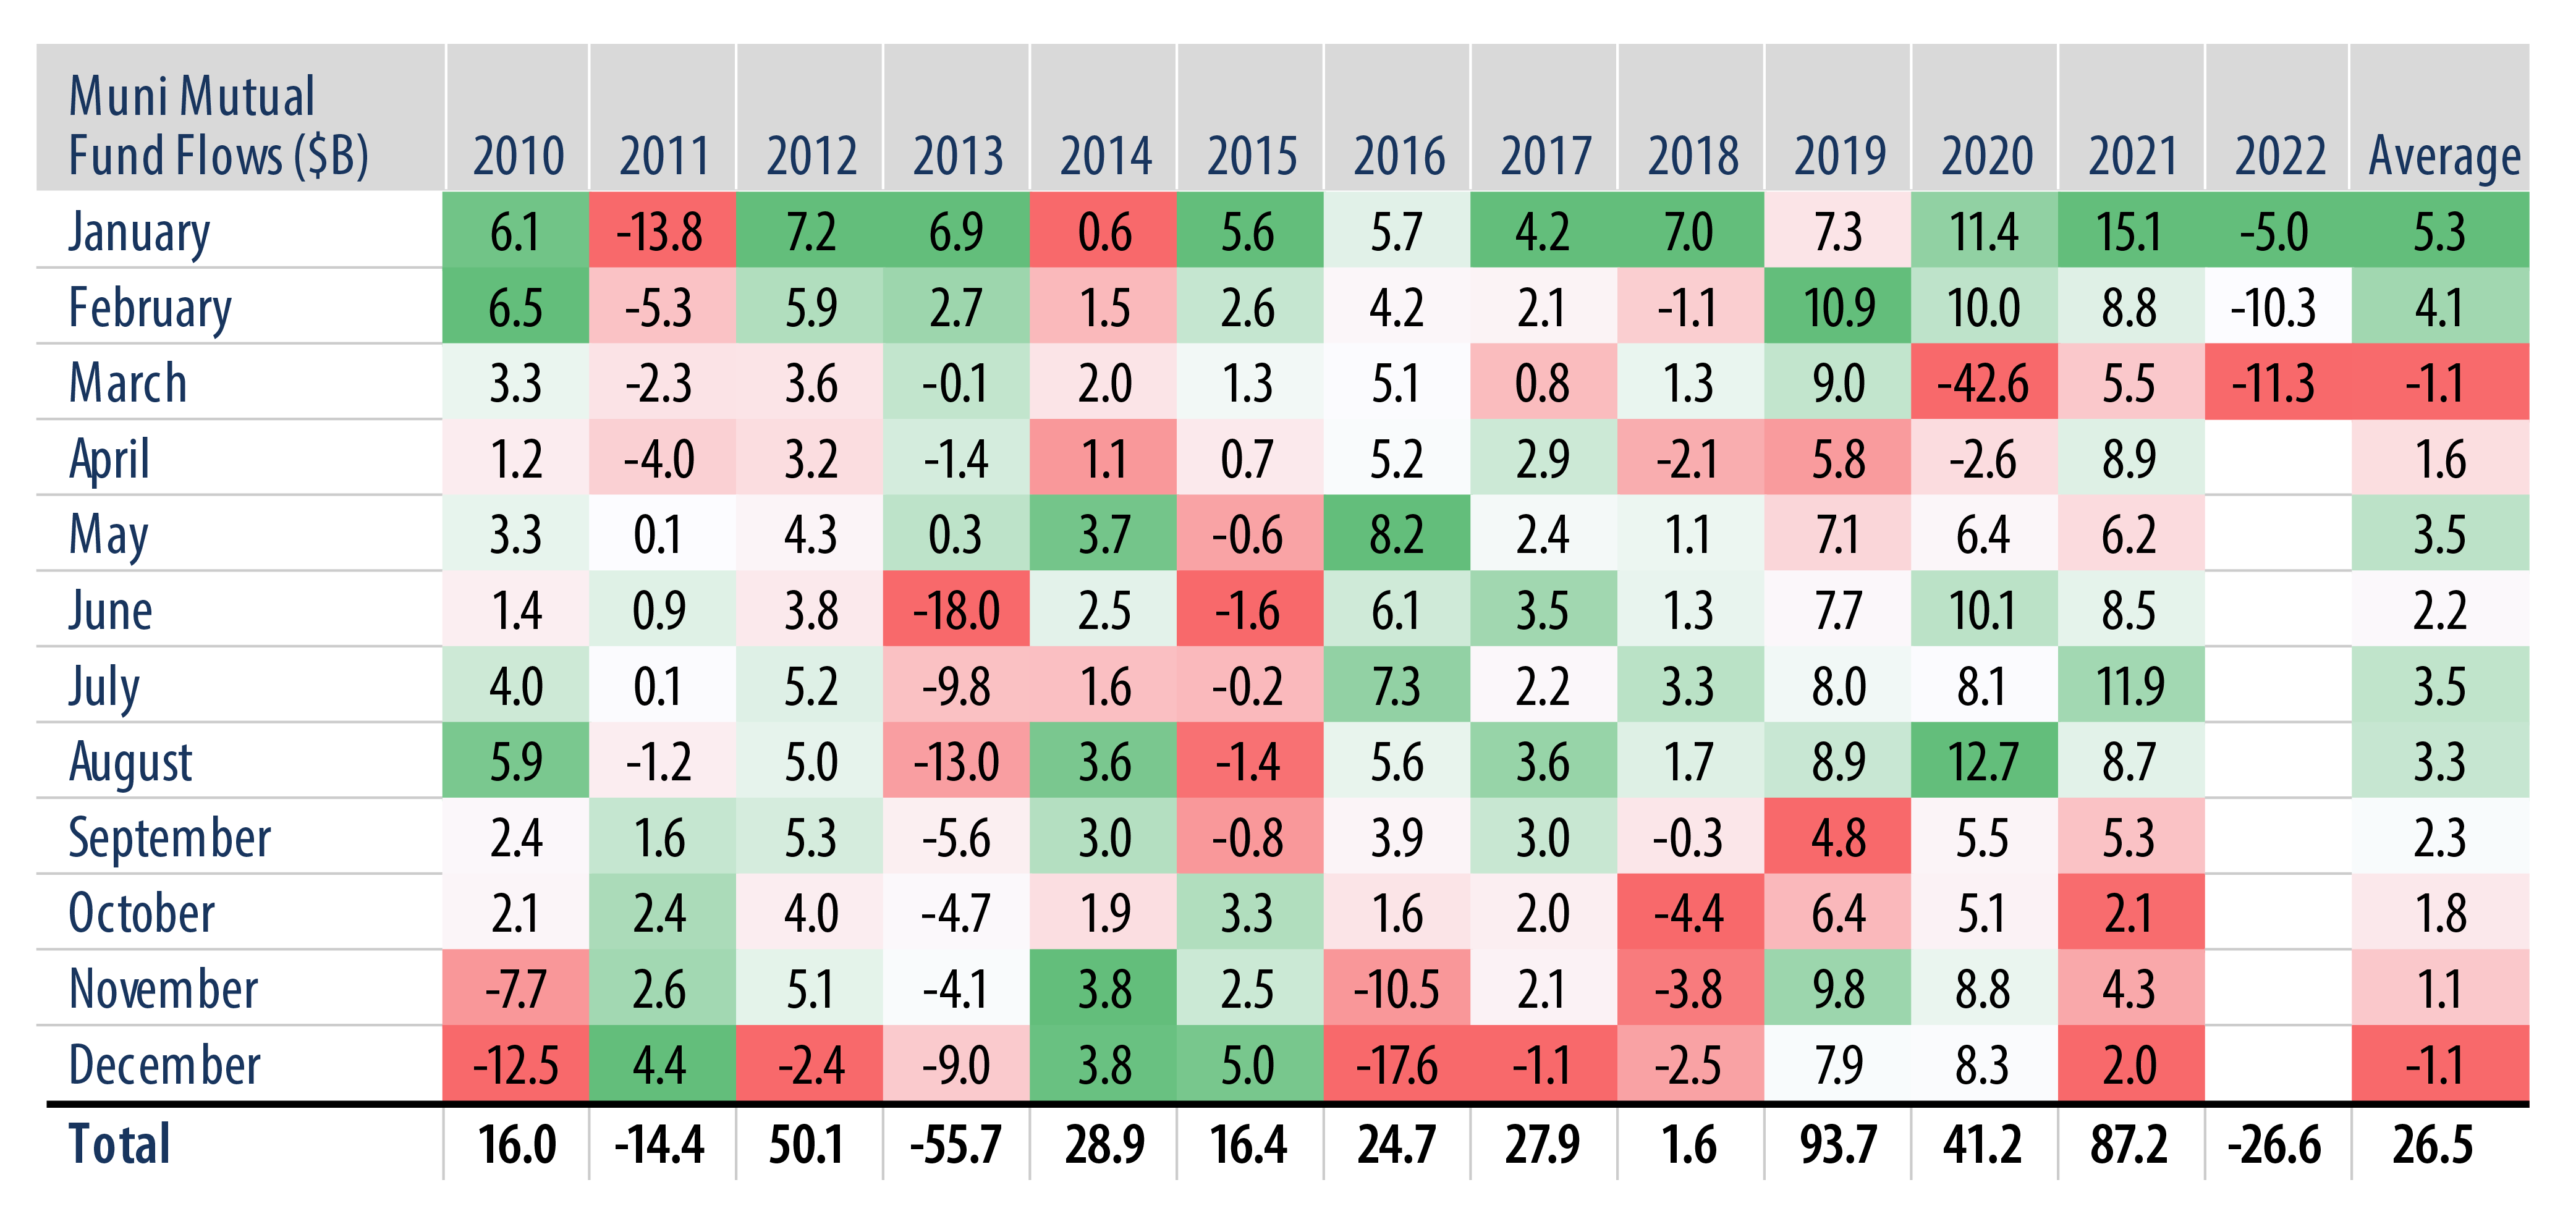
March and April have historically been relatively weaker months for municipal demand—at least partially attributable to seasonal selling associated with many high net worth individuals utilizing their high-quality municipal allocation to fund tax bills.

From 2010 to 2021, the month of March averaged $1.1 billion of municipal mutual fund outflows, compared to average inflows of $2.5 billion in all other months. YTD flows are consistent with this trend, as outflows of $5 billion and $10 billion in January and February, respectively, accelerated to $11 billion in March.

Exhibit 1: Muni Mutual Fund Flows
Explore Muni Mutual Fund Flows
Source: Bloomberg, ICI. As of 31 Mar 22. Select the image to expand the view.

Notably, the prior two tax seasons included tax-related selling that extended into the summer, given the tax deadline extensions that the IRS granted due to the pandemic. However, as we approach this year’s normal April deadline, we anticipate the majority of tax-related municipal selling has already transpired.

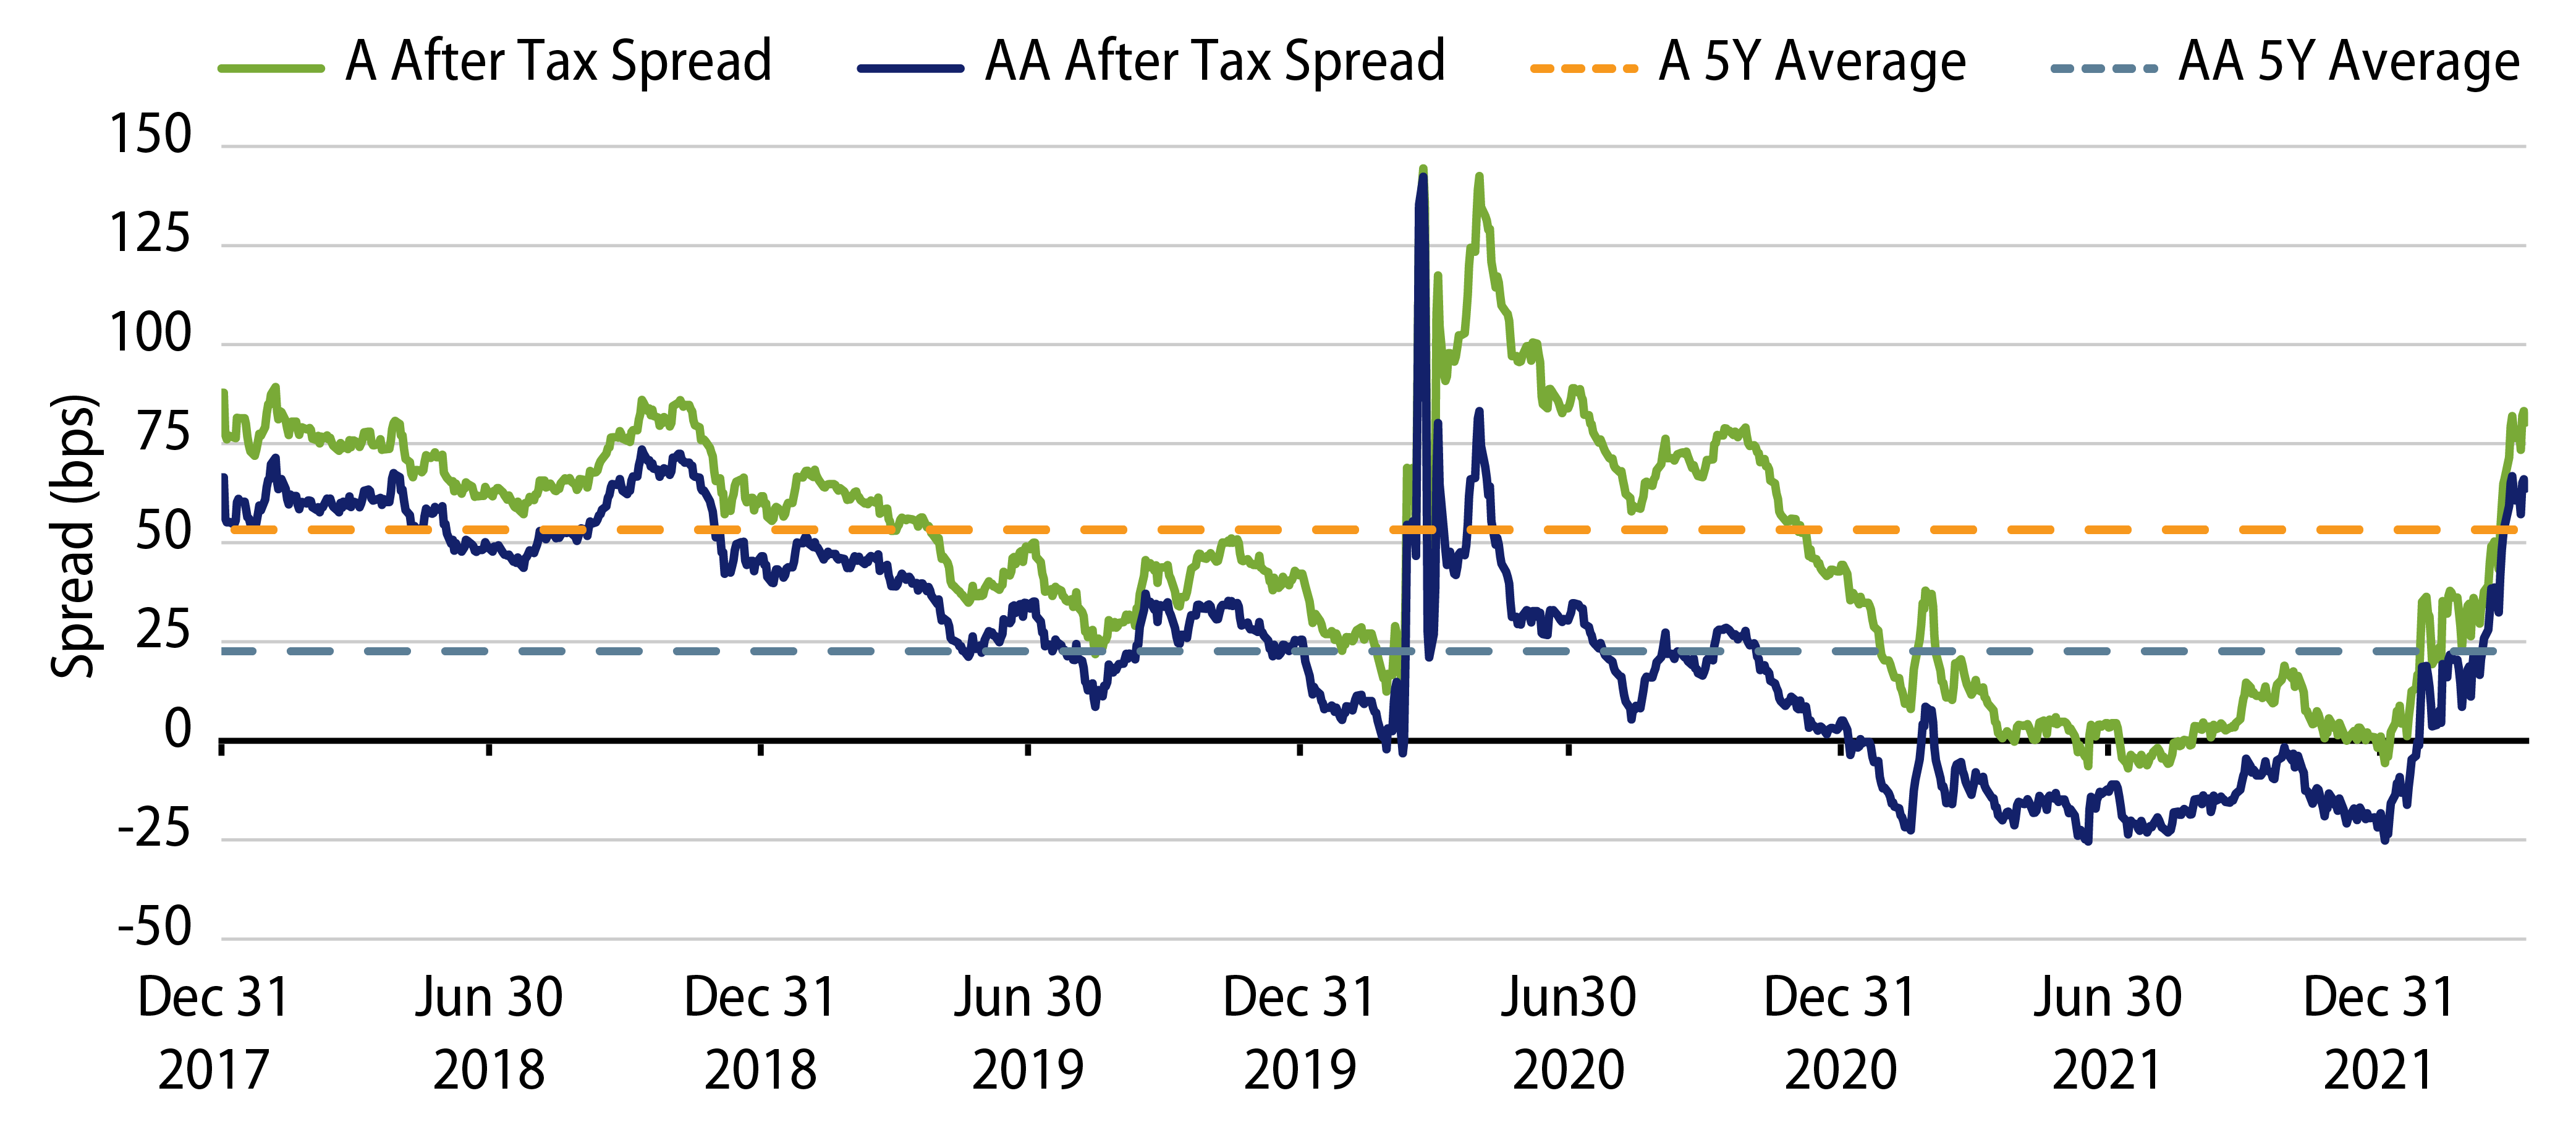
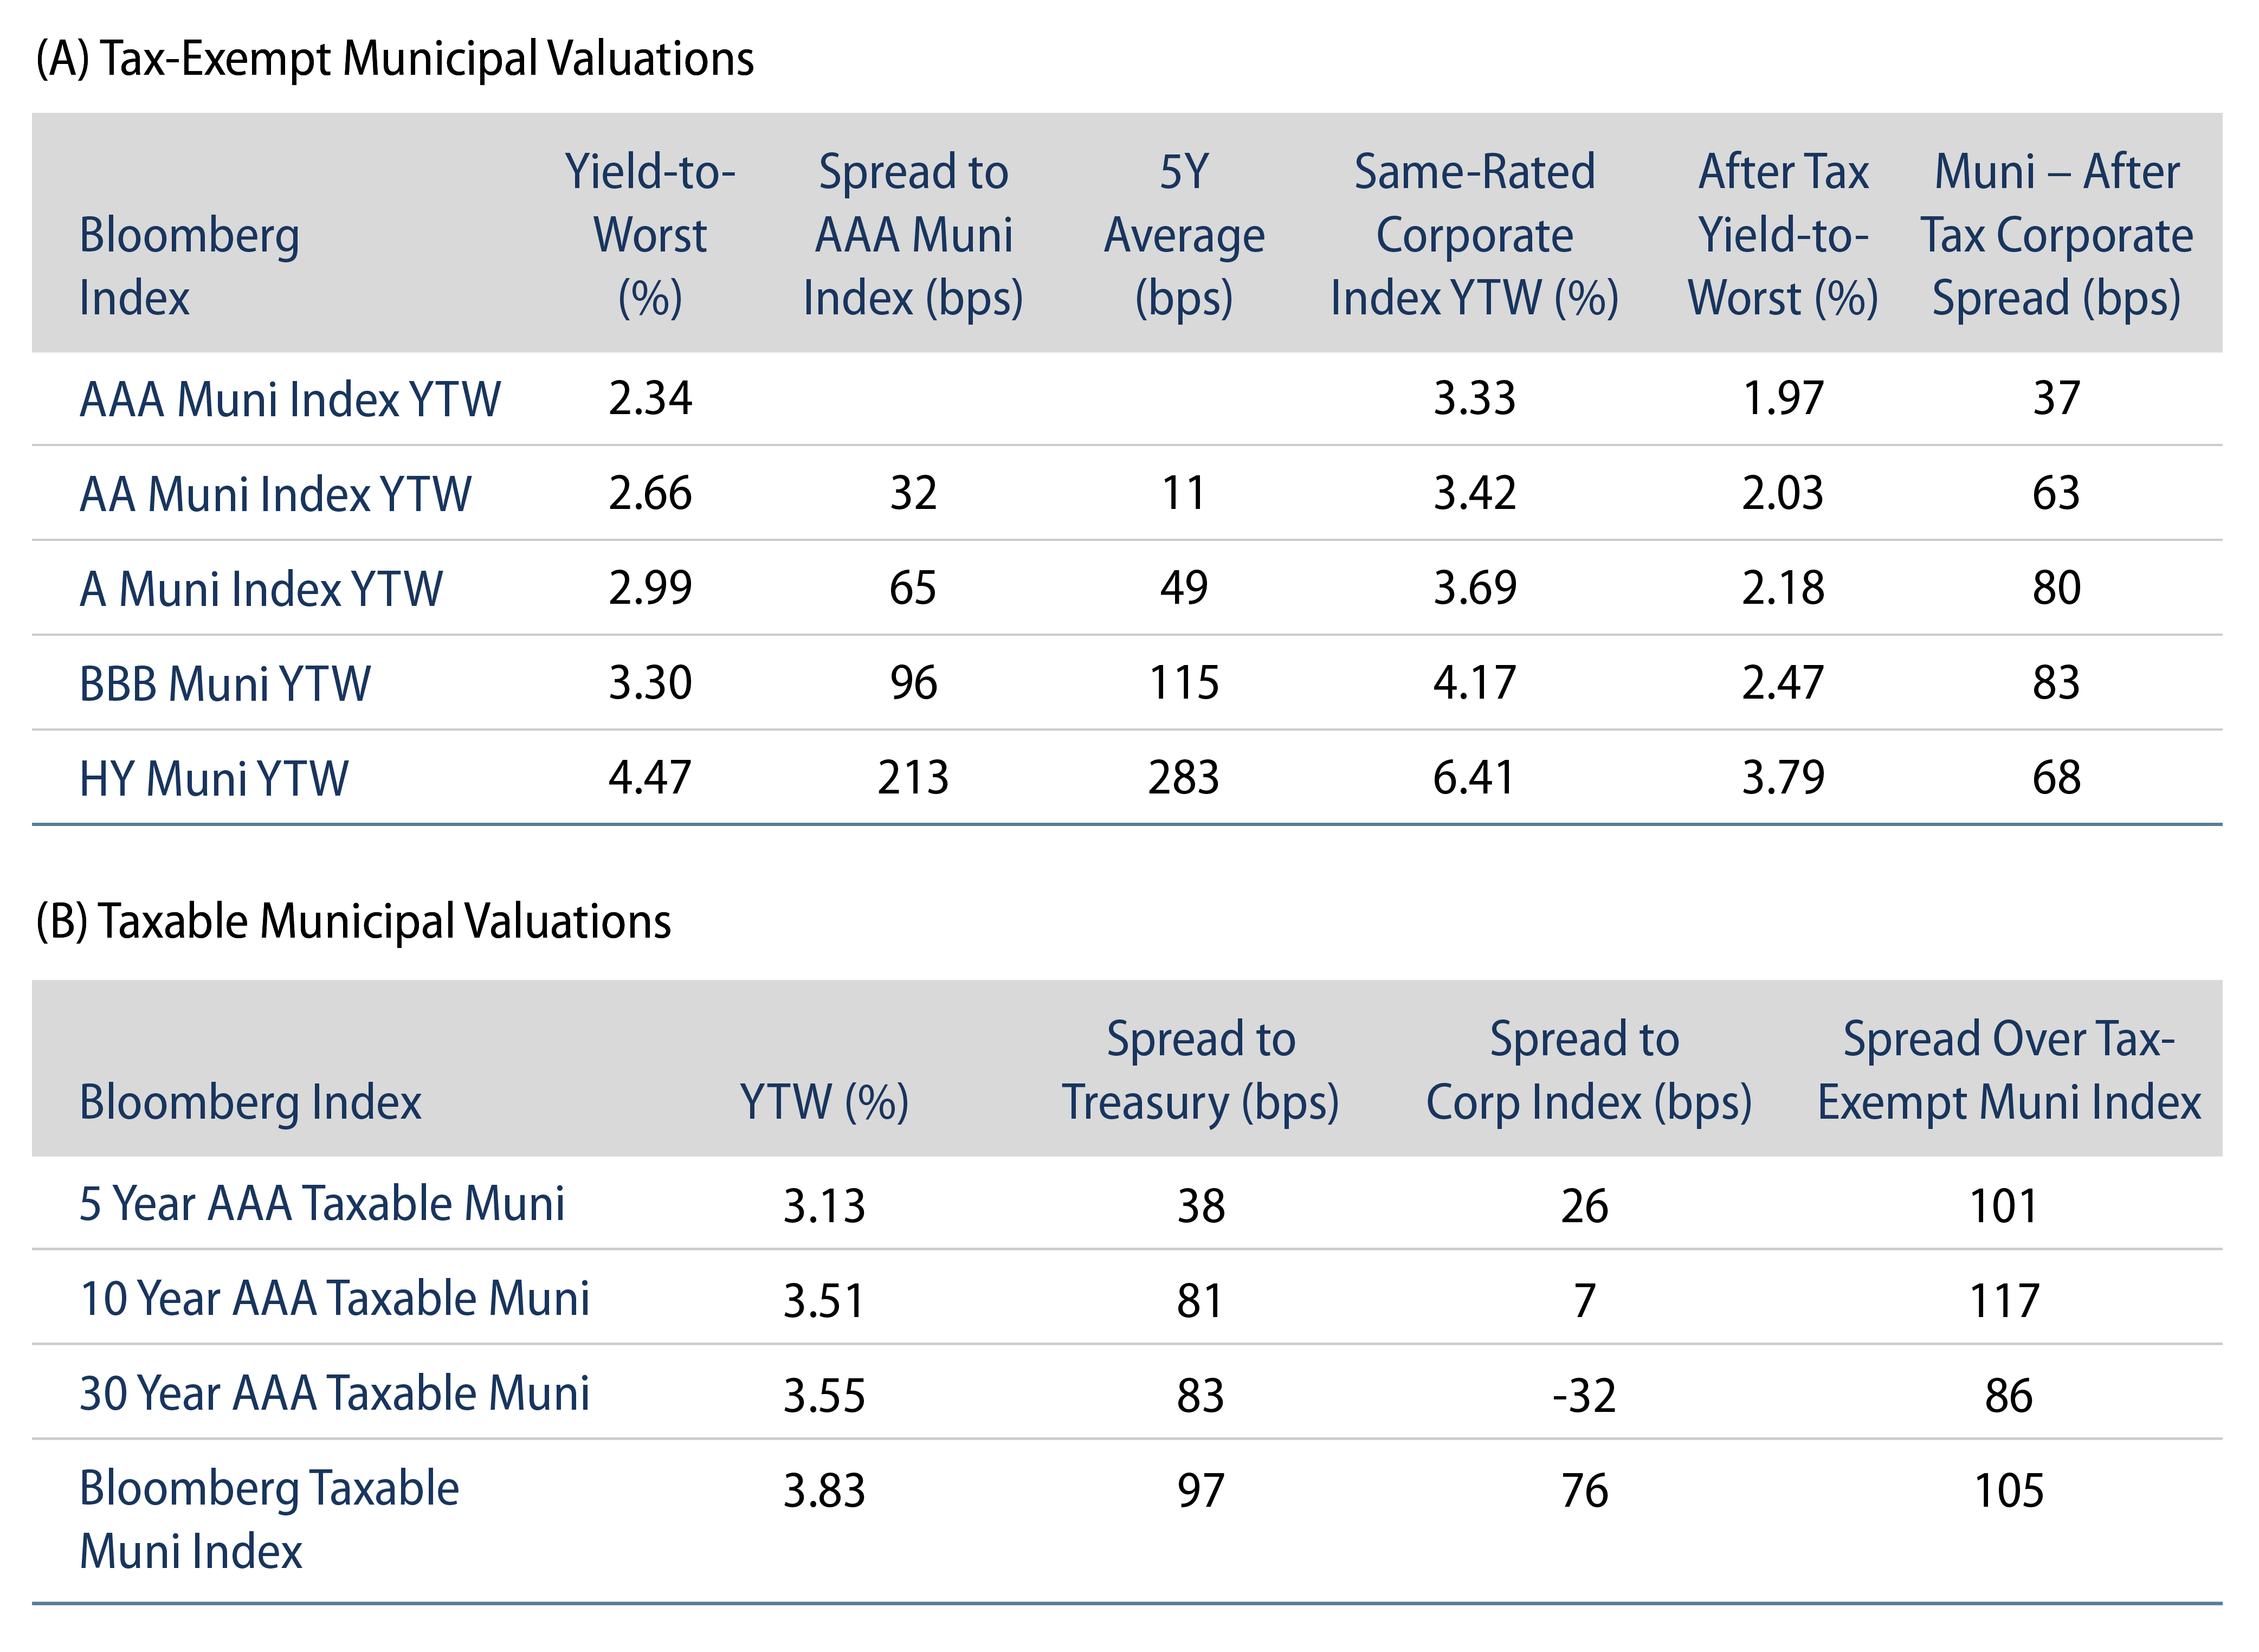
Emerging from tax season, we believe we could see demand return from both retail and institutional buyers as municipals now screen more attractive relative to both Treasuries and investment-grade credit. This relative value proposition could further improve with any developments on the tax-policy front, as President Biden has proposed higher marginal tax rates for both individuals and corporations in his upcoming fiscal 2023 budget. We remain constructive on the long-term value proposition of the tax-exempt asset class and believe these seasonal liquidity-driven conditions have helped contribute to a much better entry point for taxpayers to extract after-tax relative value.

Exhibit 2: Investment-Grade Muni After-Tax Corporate Spreads
Explore Investment-Grade Muni After-Tax Corporate Spreads
Source: Bloomberg. As of 08 Apr 22. AA Muni Spread: AA Municipal Bond Index YTW—AA Corporate Index YTW After Taxes considering the top marginal tax rate. A Muni Spread: A Municipal Bond Index YTW—A Corporate Index YTW After Taxes considering the top marginal tax rate. Select the image to expand the view.
Exhibit 3: Tax-Exempt and Taxable Muni Valuations
Explore Tax-Exempt and Taxable Muni Valuations
Source: Bloomberg. As of 08 Apr 22. Select the image to expand the view.
Exhibit 4: Municipal Bond Yields and Index Return
Explore Municipal Bond Yields and Index Return
Source: Bloomberg. As of 08 Apr 22. Select the image to expand the view.
© Western Asset Management Company, LLC 2024. The information contained in these materials ("the materials") is intended for the exclusive use of the designated recipient ("the recipient"). This information is proprietary and confidential and may contain commercially sensitive information, and may not be copied, reproduced or republished, in whole or in part, without the prior written consent of Western Asset Management Company ("Western Asset").
Past performance does not predict future returns. These materials should not be deemed to be a prediction or projection of future performance. These materials are intended for investment professionals including professional clients, eligible counterparties, and qualified investors only.
These materials have been produced for illustrative and informational purposes only. These materials contain Western Asset's opinions and beliefs as of the date designated on the materials; these views are subject to change and may not reflect real-time market developments and investment views.
Third party data may be used throughout the materials, and this data is believed to be accurate to the best of Western Asset's knowledge at the time of publication, but cannot be guaranteed. These materials may also contain strategy or product awards or rankings from independent third parties or industry publications which are based on unbiased quantitative and/or qualitative information determined independently by each third party or publication. In some cases, Western Asset may subscribe to these third party's standard industry services or publications. These standard subscriptions and services are available to all asset managers and do not influence rankings or awards in any way.
Investment strategies or products discussed herein may involve a high degree of risk, including the loss of some or all capital. Investments in any products or strategies described in these materials may be volatile, and investors should have the financial ability and willingness to accept such risks.
Unless otherwise noted, investment performance contained in these materials is reflective of a strategy composite. All other strategy data and information included in these materials reflects a representative portfolio which is an account in the composite that Western Asset believes most closely reflects the current portfolio management style of the strategy. Performance is not a consideration in the selection of the representative portfolio. The characteristics of the representative portfolio shown may differ from other accounts in the composite. Information regarding the representative portfolio and the other accounts in the composite are available upon request. Statements in these materials should not be considered investment advice. References, either general or specific, to securities and/or issuers in the materials are for illustrative purposes only and are not intended to be, and should not be interpreted as, recommendation to purchase or sell such securities. Employees and/or clients of Western Asset may have a position in the securities or issuers mentioned.
These materials are not intended to provide, and should not be relied on for, accounting, legal, tax, investment or other advice. The recipient should consult its own counsel, accountant, investment, tax, and any other advisers for this advice, including economic risks and merits, related to making an investment with Western Asset. The recipient is responsible for observing the applicable laws and regulations of their country of residence.
Founded in 1971, Western Asset Management Company is a global fixed-income investment manager with offices in Pasadena, New York, London, Singapore, Tokyo, Melbourne, São Paulo, Hong Kong, and Zürich. Western Asset is a wholly owned subsidiary of Franklin Resources, Inc. but operates autonomously. Western Asset is comprised of six legal entities across the globe, each with distinct regional registrations: Western Asset Management Company, LLC, a registered Investment Adviser with the Securities and Exchange Commission; Western Asset Management Company Distribuidora de Títulos e Valores Mobiliários Limitada is authorized and regulated by Comissão de Valores Mobiliários and Brazilian Central Bank; Western Asset Management Company Pty Ltd ABN 41 117 767 923 is the holder of the Australian Financial Services License 303160; Western Asset Management Company Pte. Ltd. Co. Reg. No. 200007692R is a holder of a Capital Markets Services License for fund management and regulated by the Monetary Authority of Singapore; Western Asset Management Company Ltd, a registered Financial Instruments Business Operator and regulated by the Financial Services Agency of Japan; and Western Asset Management Company Limited is authorised and regulated by the Financial Conduct Authority ("FCA") (FRN 145930). This communication is intended for distribution to Professional Clients only if deemed to be a financial promotion in the UK as defined by the FCA. This communication may also be intended for certain EEA countries where Western Asset has been granted permission to do so. For the current list of the approved EEA countries please contact Western Asset at +44 (0)20 7422 3000.