skip navigation
Western Asset Management Company
Blog

Stay up to date on timely topics and market events. Subscribe to our Blog now.

MARKETS
July 14, 2026

Weekly Municipal Monitor—Summer Travel

By Michael Linko

Stay up to date on timely topics and market events. Subscribe to our Blog now.

Macros, Markets and Munis

Municipals posted negative returns last week but outperformed taxable fixed-income as market volatility picked up amid an escalation of the US-Iran conflict with renewed military strikes that drove oil prices higher and spurred inflation concerns. Treasury yields rose 7-8 basis points across the curve during the week. Municipals trailed Treasuries higher but outperformed thanks to strong demand. Supply rebounded from the prior week, but demand remained robust. As summer travel season begins, this week we provide an update on the transportation sector.

Supply Rebounded, but Demand Remained Strong

Fund Flows ($1.4 billion of net inflows): During the week ending July 8, weekly reporting municipal mutual funds recorded $1.4 billion of net inflows, marking the 12th consecutive week of inflows, according to Lipper. The intermediate-term category led demand with $523 million of inflows. The long-term category recorded $405 million of inflows and the short-term category reported $326 million of inflows. Last week’s inflows bring year-to-date (YTD) inflows to $57 billion.

Supply (YTD supply of $315 billion; up 12% YoY): The muni market recorded $1 billion of new-issue supply last week, rebounding from the prior holiday-shortened week. YTD new-issue supply of $315 billion is 12% higher than the prior record-issuance year, with tax-exempt issuance up 13% year-over-year (YoY) and taxable issuance up 6%. This week’s calendar is expected to increase to $12 billion. Largest deals include $2.5 billion New York State Thruway and $2.4 billion Aquarion CT Water Authority transactions.

This Week in Munis: Summer Travel

With geopolitical conflict contributing to oil price volatility, fuel prices are back on the shortlist of issues worth watching in the municipal transportation sector. Not because every move at the pump changes credit quality overnight, but because fuel costs expose important differences in the credit profiles of toll roads, airports and mass transit systems. From a credit perspective, the key question is not simply whether fuel prices move higher or lower, but which issuers have the demand stability, pricing power and financial flexibility to absorb that volatility.

Toll roads remain a strong credit story within the transportation sector, as vehicle miles traveled continue to exceed pre-pandemic levels. While higher gasoline prices can reduce discretionary driving, the effect on mature toll systems has historically been modest. Short-run gasoline demand elasticity is generally estimated at roughly -0.02 to -0.04, implying that even a 25% increase in fuel prices would likely reduce driving demand by only about 0.5% to 1.0%. Established commuter corridors and urban expressways typically maintain stable traffic volumes because drivers often lack practical alternatives. Many issuers also benefit from annual toll escalators of 3% to 5% or CPI-linked pricing frameworks that allow revenue growth to outpace traffic growth. Combined with senior-lien debt service coverage ratios that often exceed 2.0x, the sector’s overall credit outlook remains stable to positive.
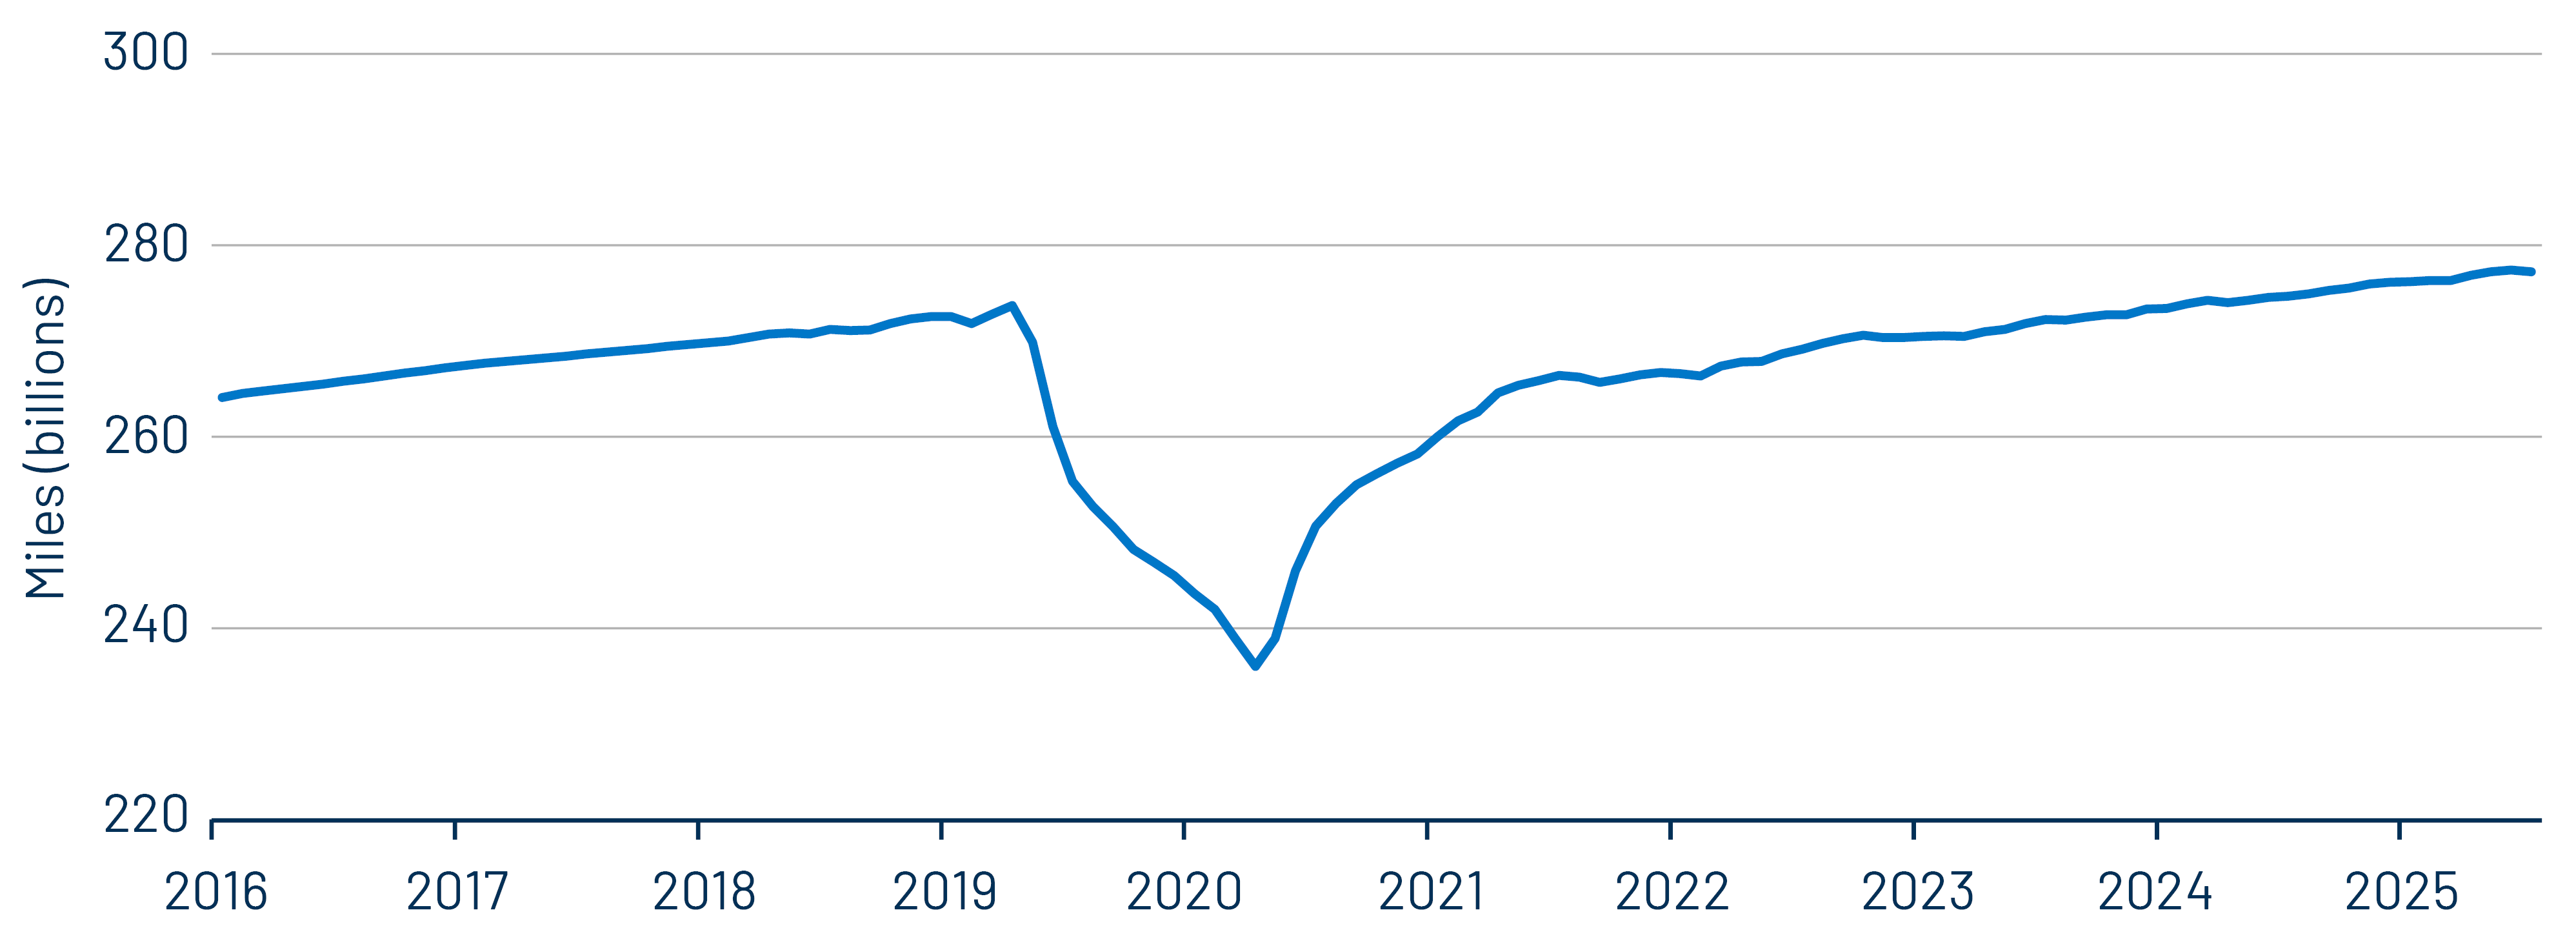
Exhibit 1: Vehicle Miles Traveled (12-Month Trailing)
Vehicle Miles Traveled (12-Month Trailing)
Source: Bloomberg, Federal Highway Administration, Western Asset. As of 31 May 26. Select the image to expand the view.

Airports face a different challenge because fuel prices affect credit quality indirectly through the airlines. Jet fuel can account for roughly one-quarter of airline operating expenses, so rising fuel costs often lead carriers to increase fares, reduce capacity or concentrate service at their most profitable hubs. Air travel demand is generally more price-sensitive than automobile travel, with route-level fare elasticity commonly estimated near -1.4. As a result, a 10% increase in airfares could reduce passenger demand by approximately 14%, particularly across leisure and short-haul markets. Although TSA checkpoint screenings remained above 900 million in 2025, passenger growth has begun to normalize. At the same time, US airports face an estimated $174 billion of infrastructure needs over the next five years, increasing pressure on future borrowing requirements and cost-per-enplanement metrics. As a result, credit differentiation is likely to widen between large, diversified hub airports and smaller facilities with greater dependence on a limited number of airline partners.
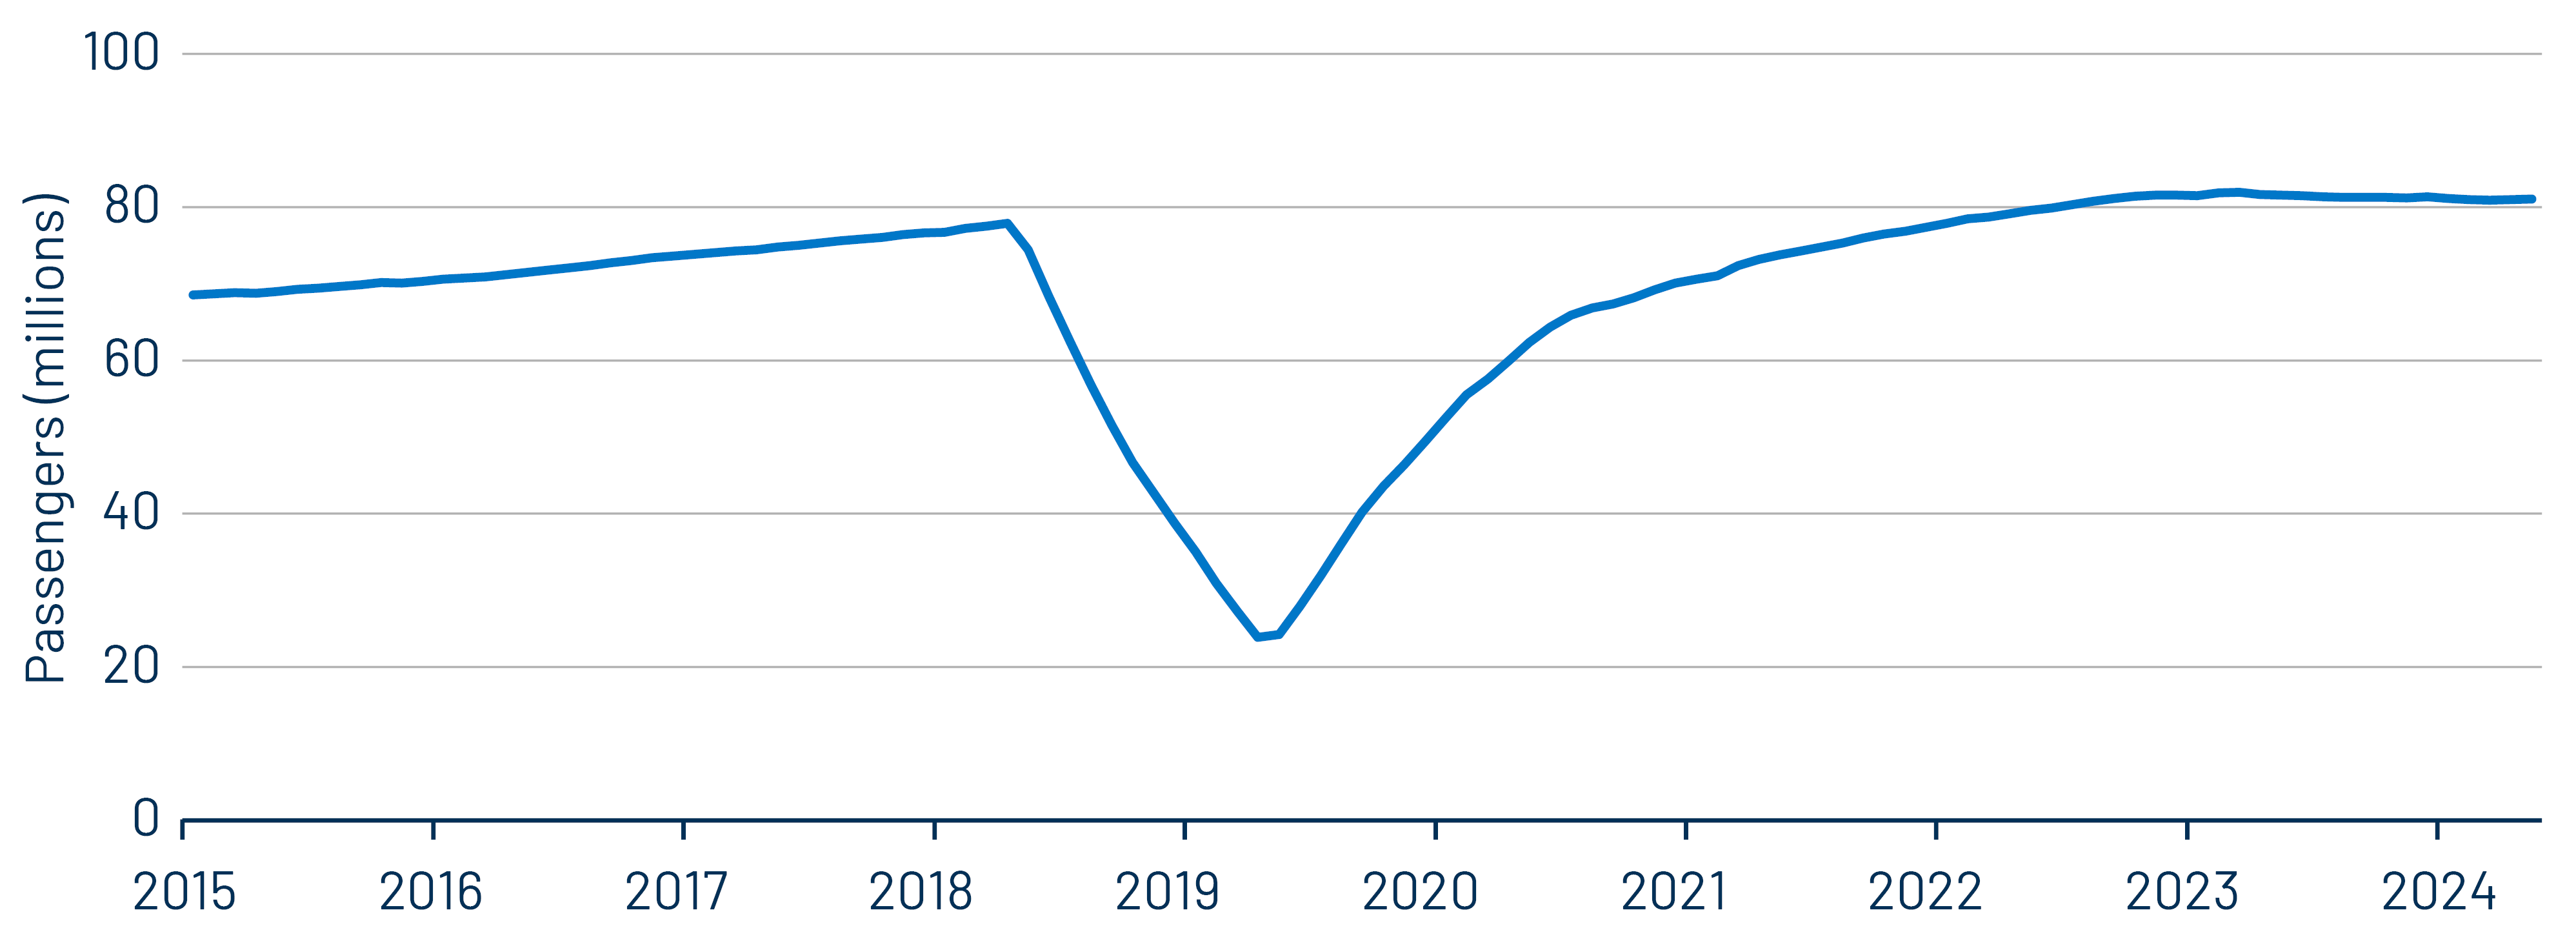
Exhibit 2: Monthly Domestic and International US Airline Passengers (12-Month Trailing)
Monthly Domestic and International US Airline Passengers (12-Month Trailing)
Source: TSA, Western Asset, Bloomberg. As of 30 Apr 26. 2026 Select the image to expand the view.

Mass transit presents the most challenging credit profile within the transportation sector. National ridership has recovered to roughly 8.1 billion annual trips, but many agencies continue to contend with weak farebox recovery. For example, the New York MTA’s maximum daily ridership remains approximately 17% below pre-pandemic highs. In addition, mass transit systems are challenged by labor-intensive operating budgets and an estimated $140 billion state-of-good-repair backlog. Historically, a 10% increase in gasoline prices has produced only about a 0.6% short-term increase in transit ridership, highlighting the relatively limited demand response to higher fuel costs. While higher fuel prices may provide a modest boost to ridership, they also increase diesel, electricity and other operating costs. Consequently, the primary credit challenge for most transit systems remains the sustainability of recurring operating support rather than ridership growth alone.
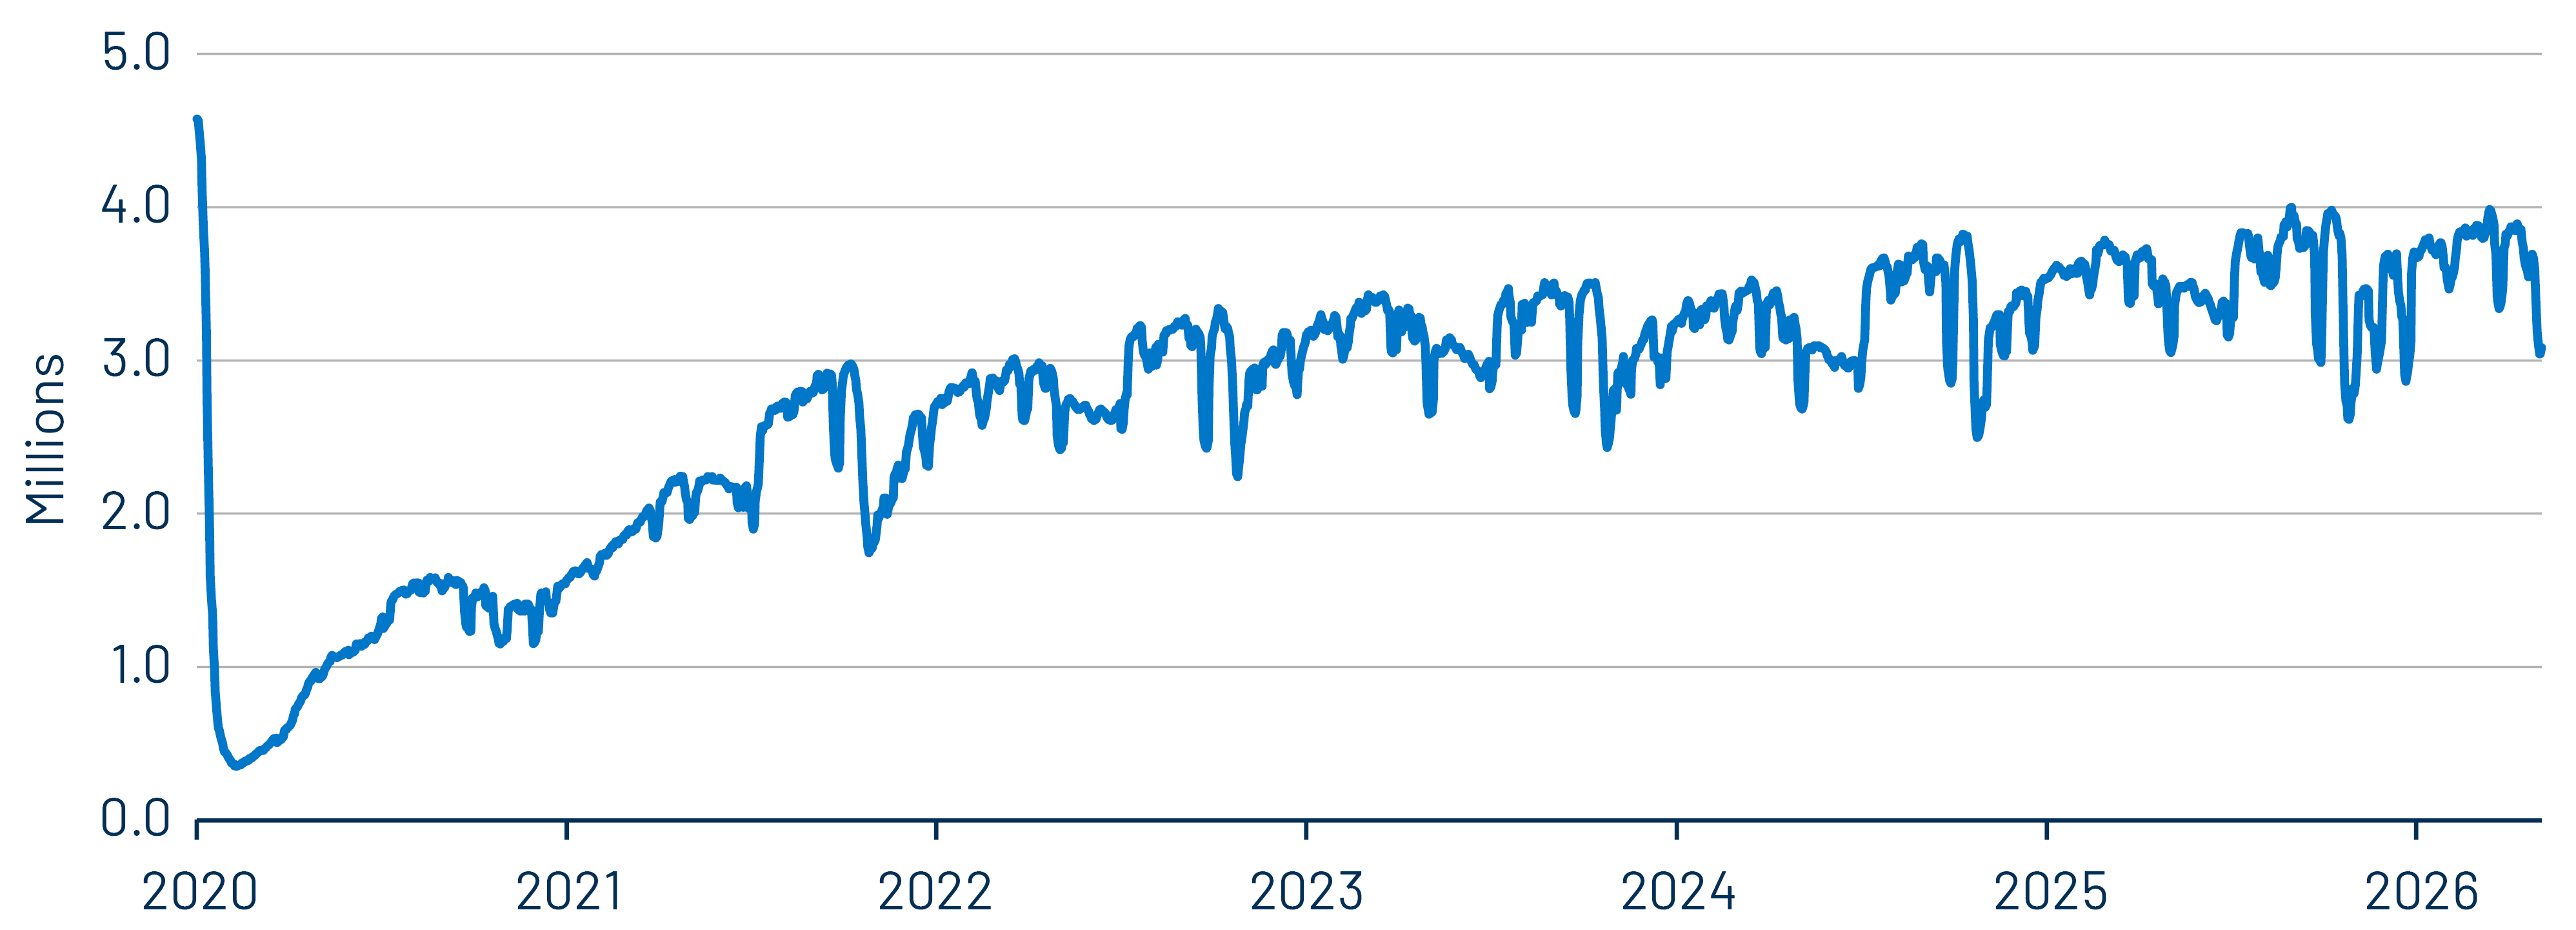
Exhibit 3: MTA Ridership (Seven-Day Average)
MTA Ridership (Seven-Day Average)
Source: Bloomberg, New York MTA Daily Traffic, Western Asset. As of 08 Jul 26. Select the image to expand the view.

From a valuation perspective, we believe the transportation sector continues to offer attractive income opportunities for municipal investors. However, following broad fundamental improvement across the municipal market and tighter spreads across fixed-income, relative value between transportation subsectors has become increasingly compressed. As a result, issuer selection has become more important than broad sector allocation. We believe active managers’ ability to evaluate the downstream effects of geopolitical developments, fuel price volatility and issuer-specific operating fundamentals can enhance security selection and ultimately improve risk-adjusted investment outcomes.
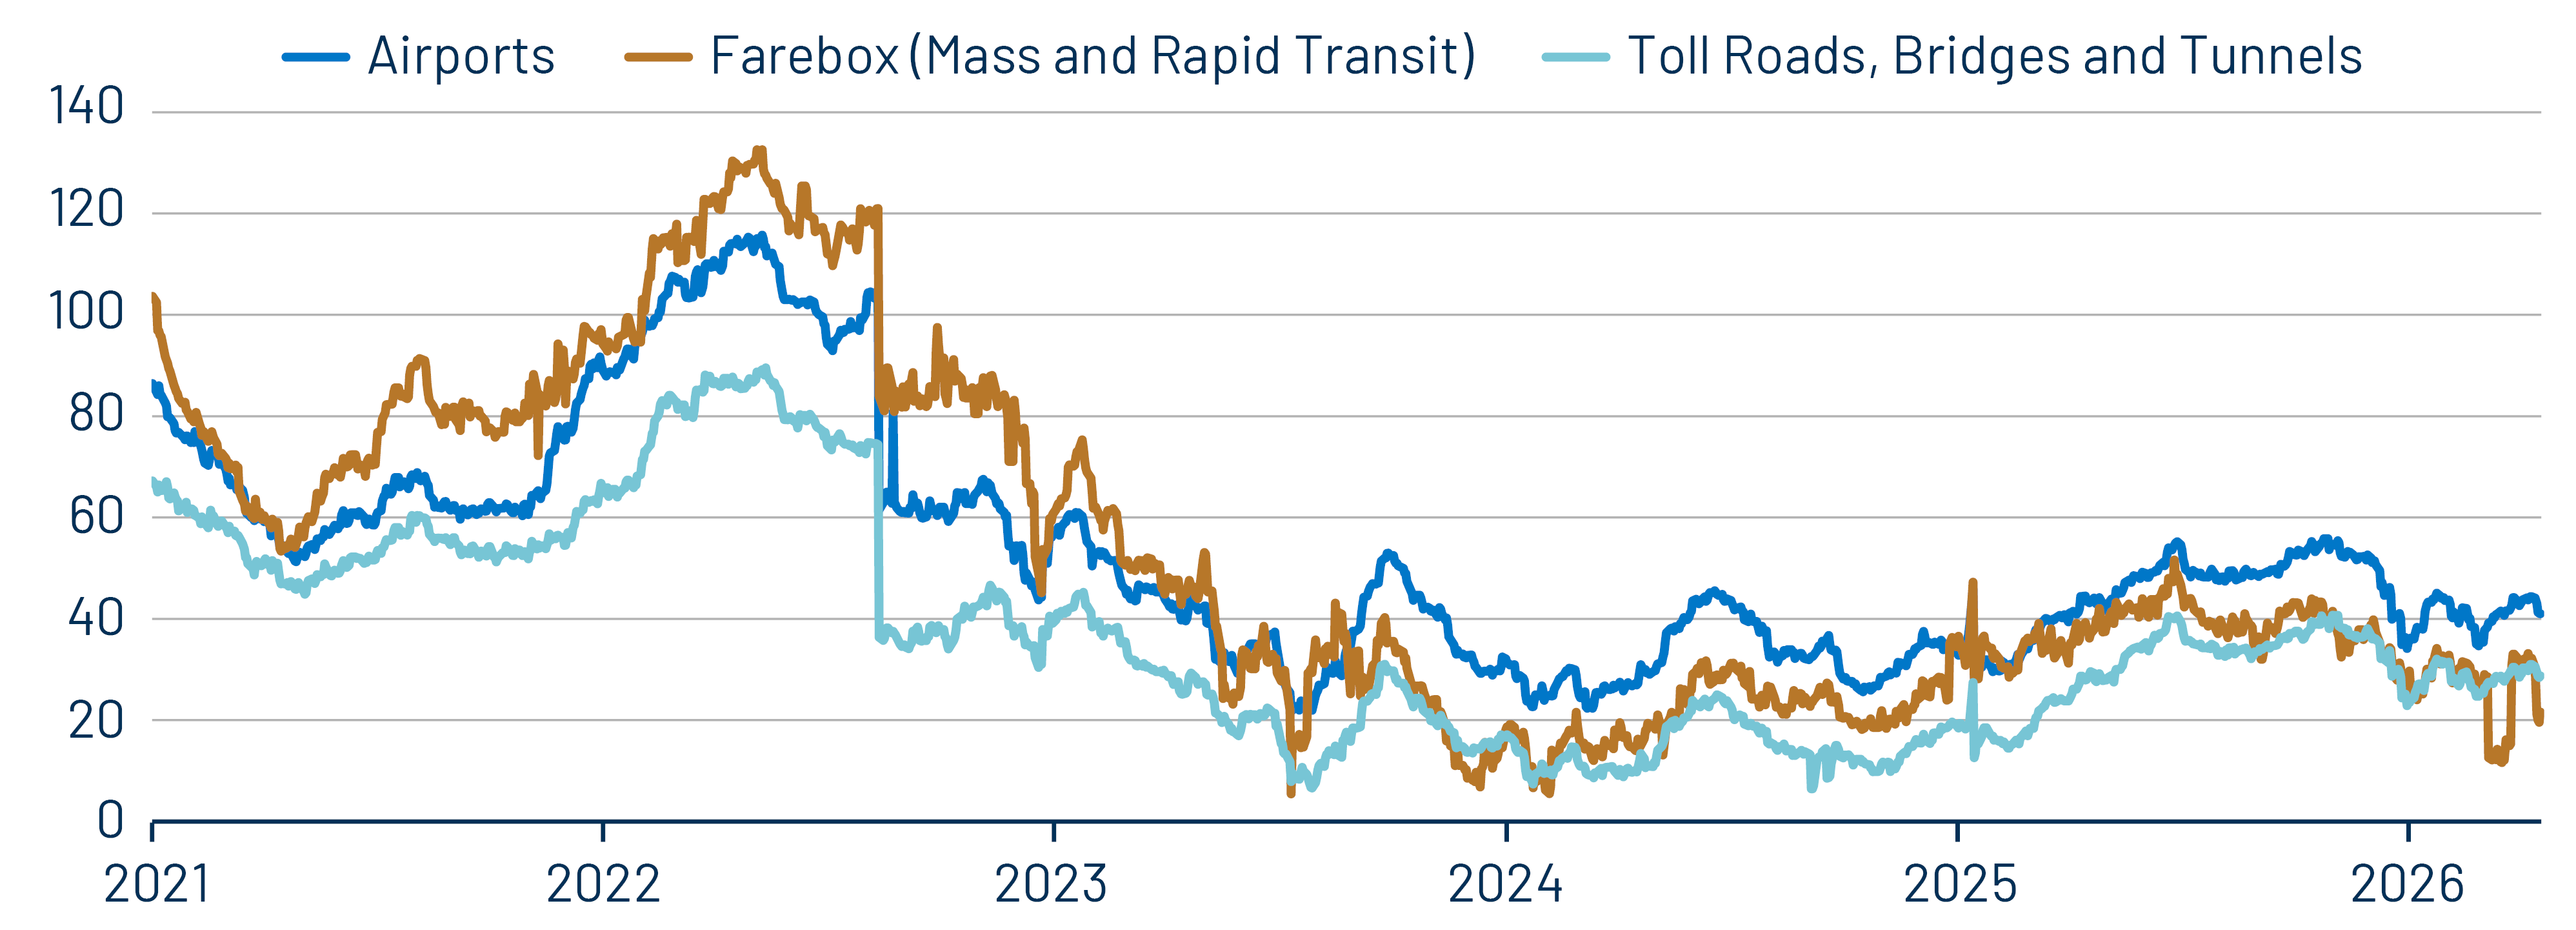
Exhibit 4: Toll Road, Airport, Mass Transit Muni OAS
Toll Road, Airport, Mass Transit Muni OAS
Source: Bloomberg Municipal Bond Index average sector OAS, Western Asset. An option-adjusted spread (OAS) is a measure of risk that shows credit spreads with adjustments made to neutralize the impact of embedded options. As of 08 Jul 26. Select the image to expand the view.

Municipal Credit Curves and Relative Value
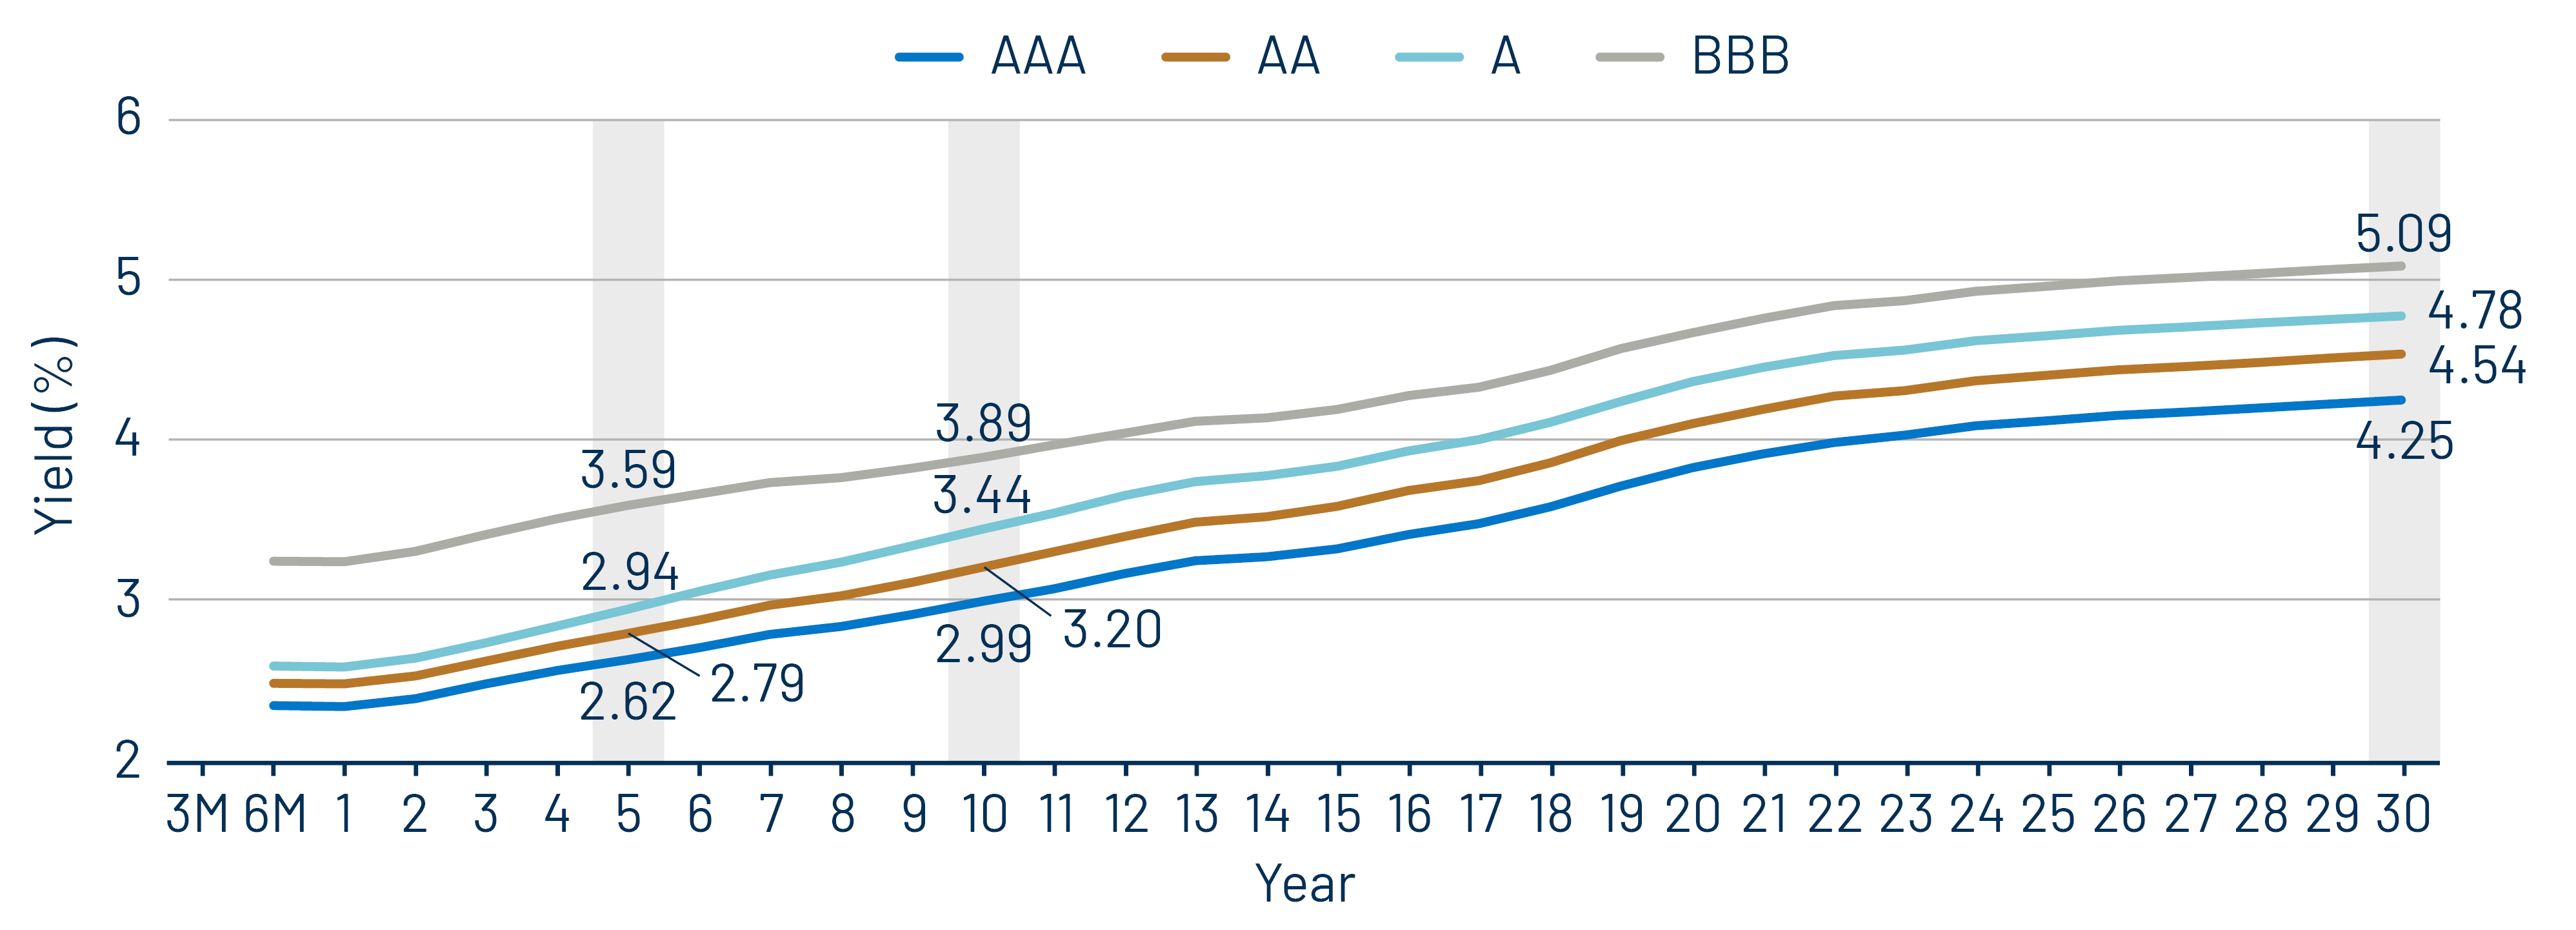
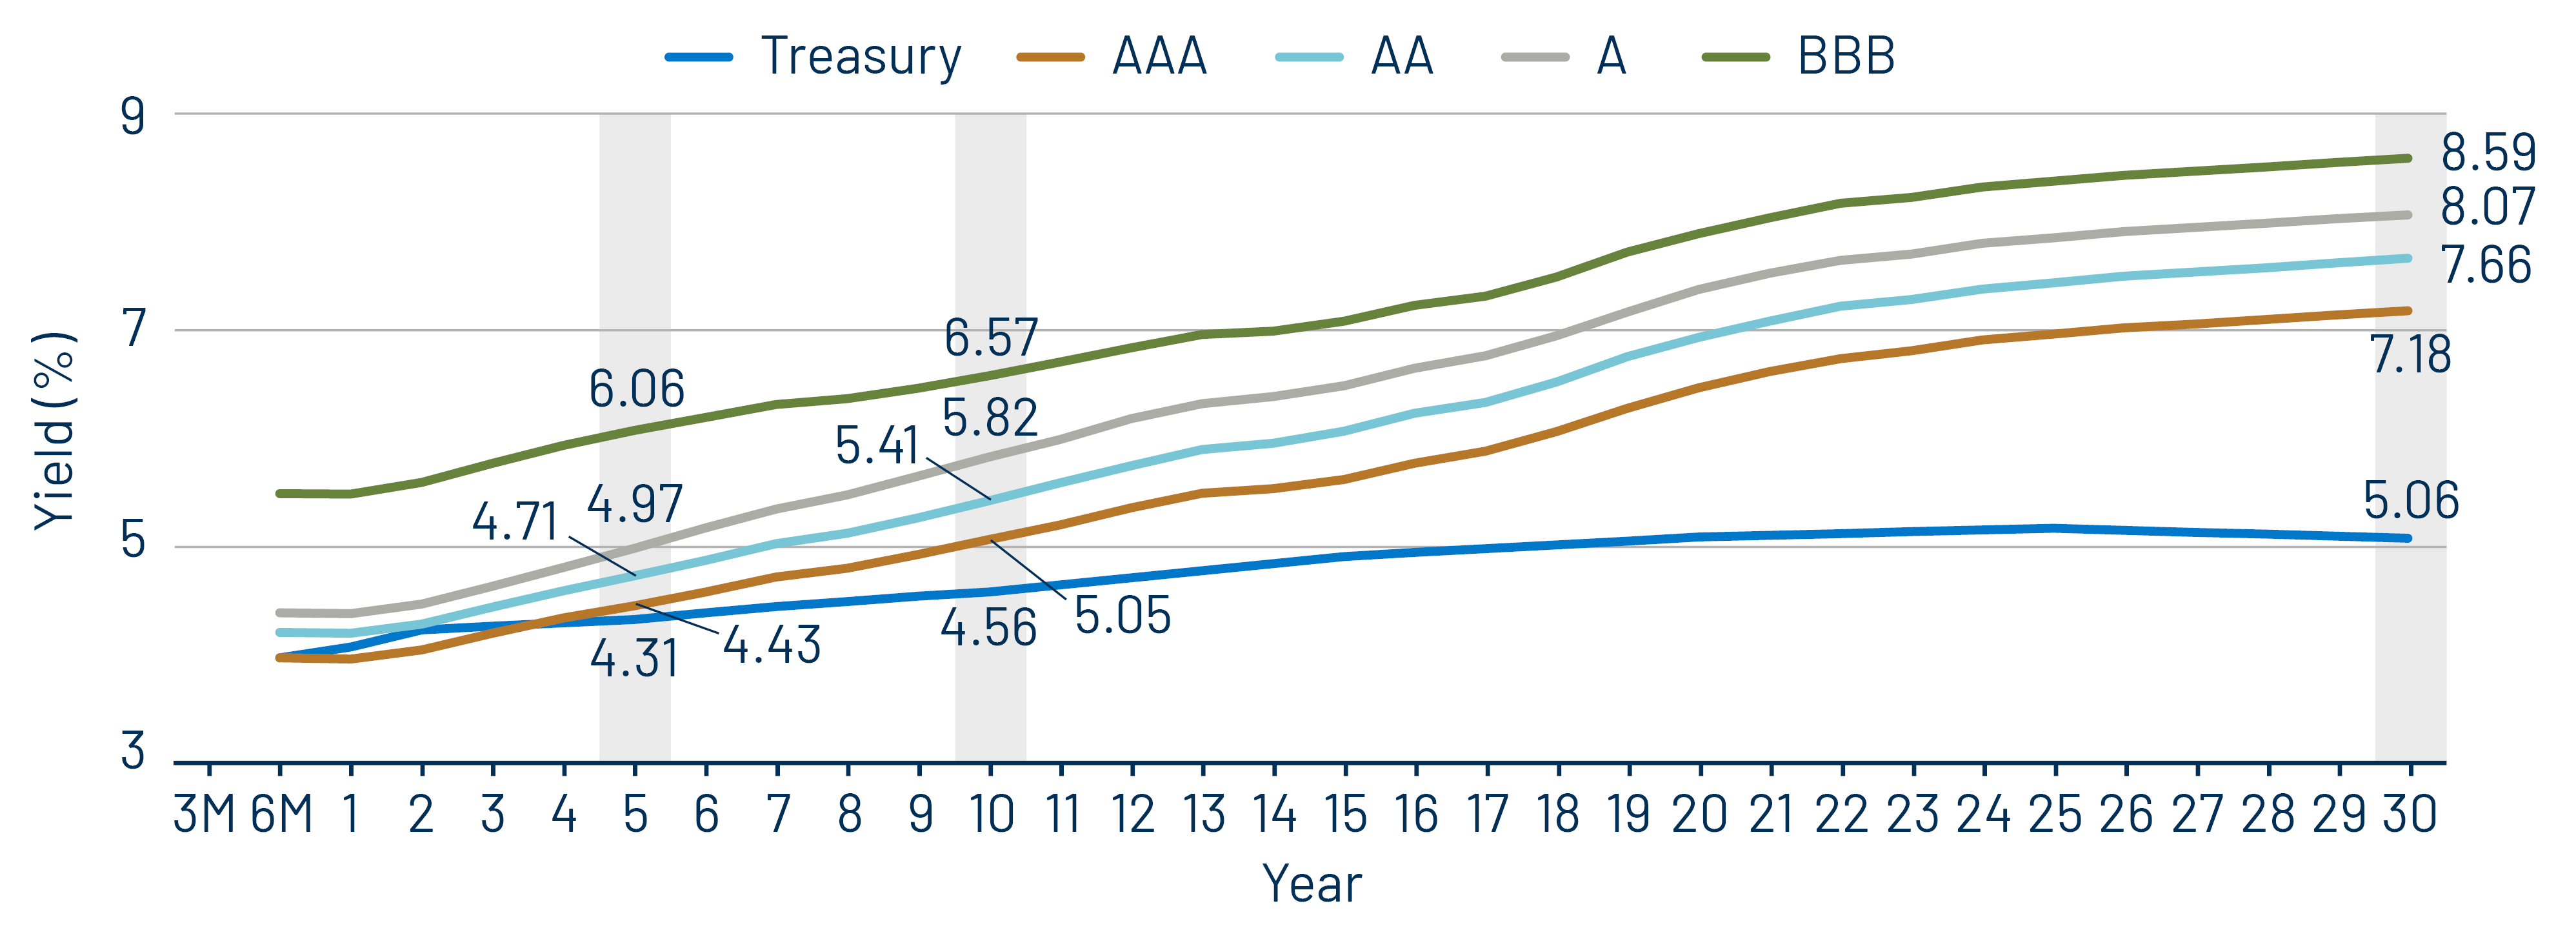
Exhibit 5: Muni Credit Curves
Muni Credit Curves
Source: Bloomberg, Western Asset. As of 10 Jul 26. Bloomberg Valuation Service (BVAL) Municipal Credit Indices (AAA, AA, A, BBB, respectively) and US Sovereign Curves. Taxable-Equivalent Muni Credit Curves consider the top marginal effective tax rate of 40.8%. AA Muni is represented by the US General Obligation AA Muni BVAL Yield Curve. The BVAL curve is populated with pricing from uninsured AA General Obligation bonds. A Muni is represented by the US General Obligation A Muni BVAL Yield Curve. The BVAL curve is populated with pricing from uninsured A General Obligation bonds. BBB Muni is represented by the US General Obligation BBB Muni BVAL Yield Curve. The BVAL curve is populated with pricing from uninsured BBB General Obligation bonds. Indices are unmanaged and one cannot directly invest in them. They do not include fees, expenses or sales charges. Past performance is not an indicator or a guarantee of future results. Select the image to expand the view.
Exhibit 6: Taxable-Equivalent Muni Credit Curves
Taxable-Equivalent Muni Credit Curves
Source: Bloomberg, Western Asset. As of 10 Jul 26. Bloomberg Valuation Service (BVAL) Municipal Credit Indices (AAA, AA, A, BBB, respectively) and US Sovereign Curves. Taxable-Equivalent Muni Credit Curves consider the top marginal effective tax rate of 40.8%. AA Muni is represented by the US General Obligation AA Muni BVAL Yield Curve. The BVAL curve is populated with pricing from uninsured AA General Obligation bonds. A Muni is represented by the US General Obligation A Muni BVAL Yield Curve. The BVAL curve is populated with pricing from uninsured A General Obligation bonds. BBB Muni is represented by the US General Obligation BBB Muni BVAL Yield Curve. The BVAL curve is populated with pricing from uninsured BBB General Obligation bonds. Indices are unmanaged and one cannot directly invest in them. They do not include fees, expenses or sales charges. Past performance is not an indicator or a guarantee of future results. Select the image to expand the view.
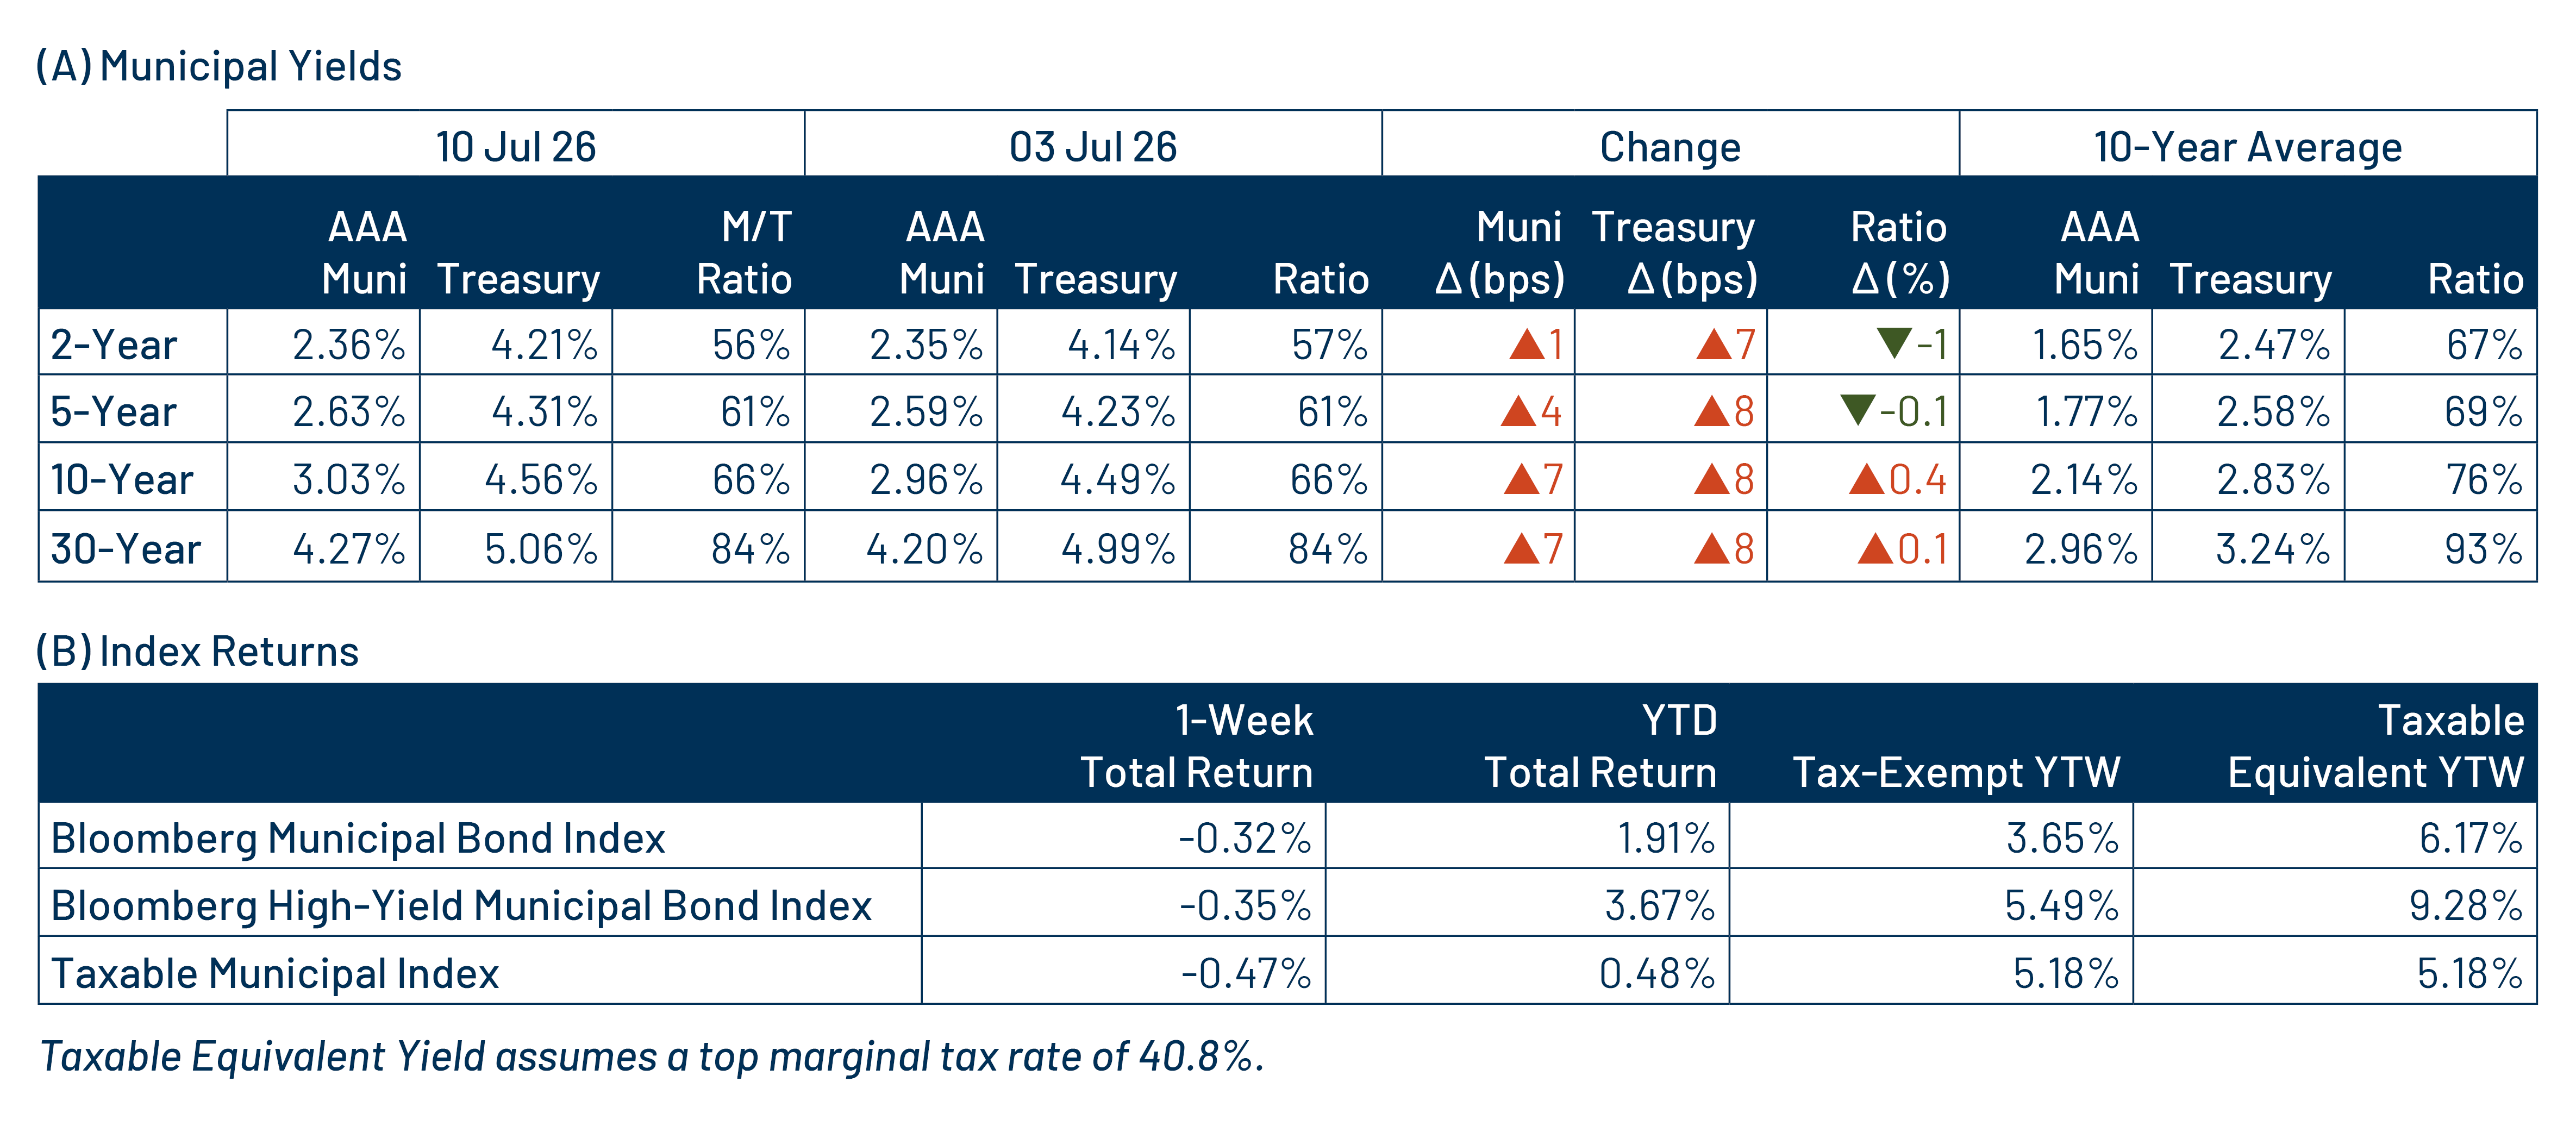
Exhibit 7: AAA Munis vs. Treasuries
AAA Munis vs. Treasuries
Source: Muni Yields: Thomson Reuters MMD, Treasury Yields: Bloomberg. As of 10 Jul 26. Past performance is not a guarantee of future results. It is not possible to invest directly in an index. Select the image to expand the view.
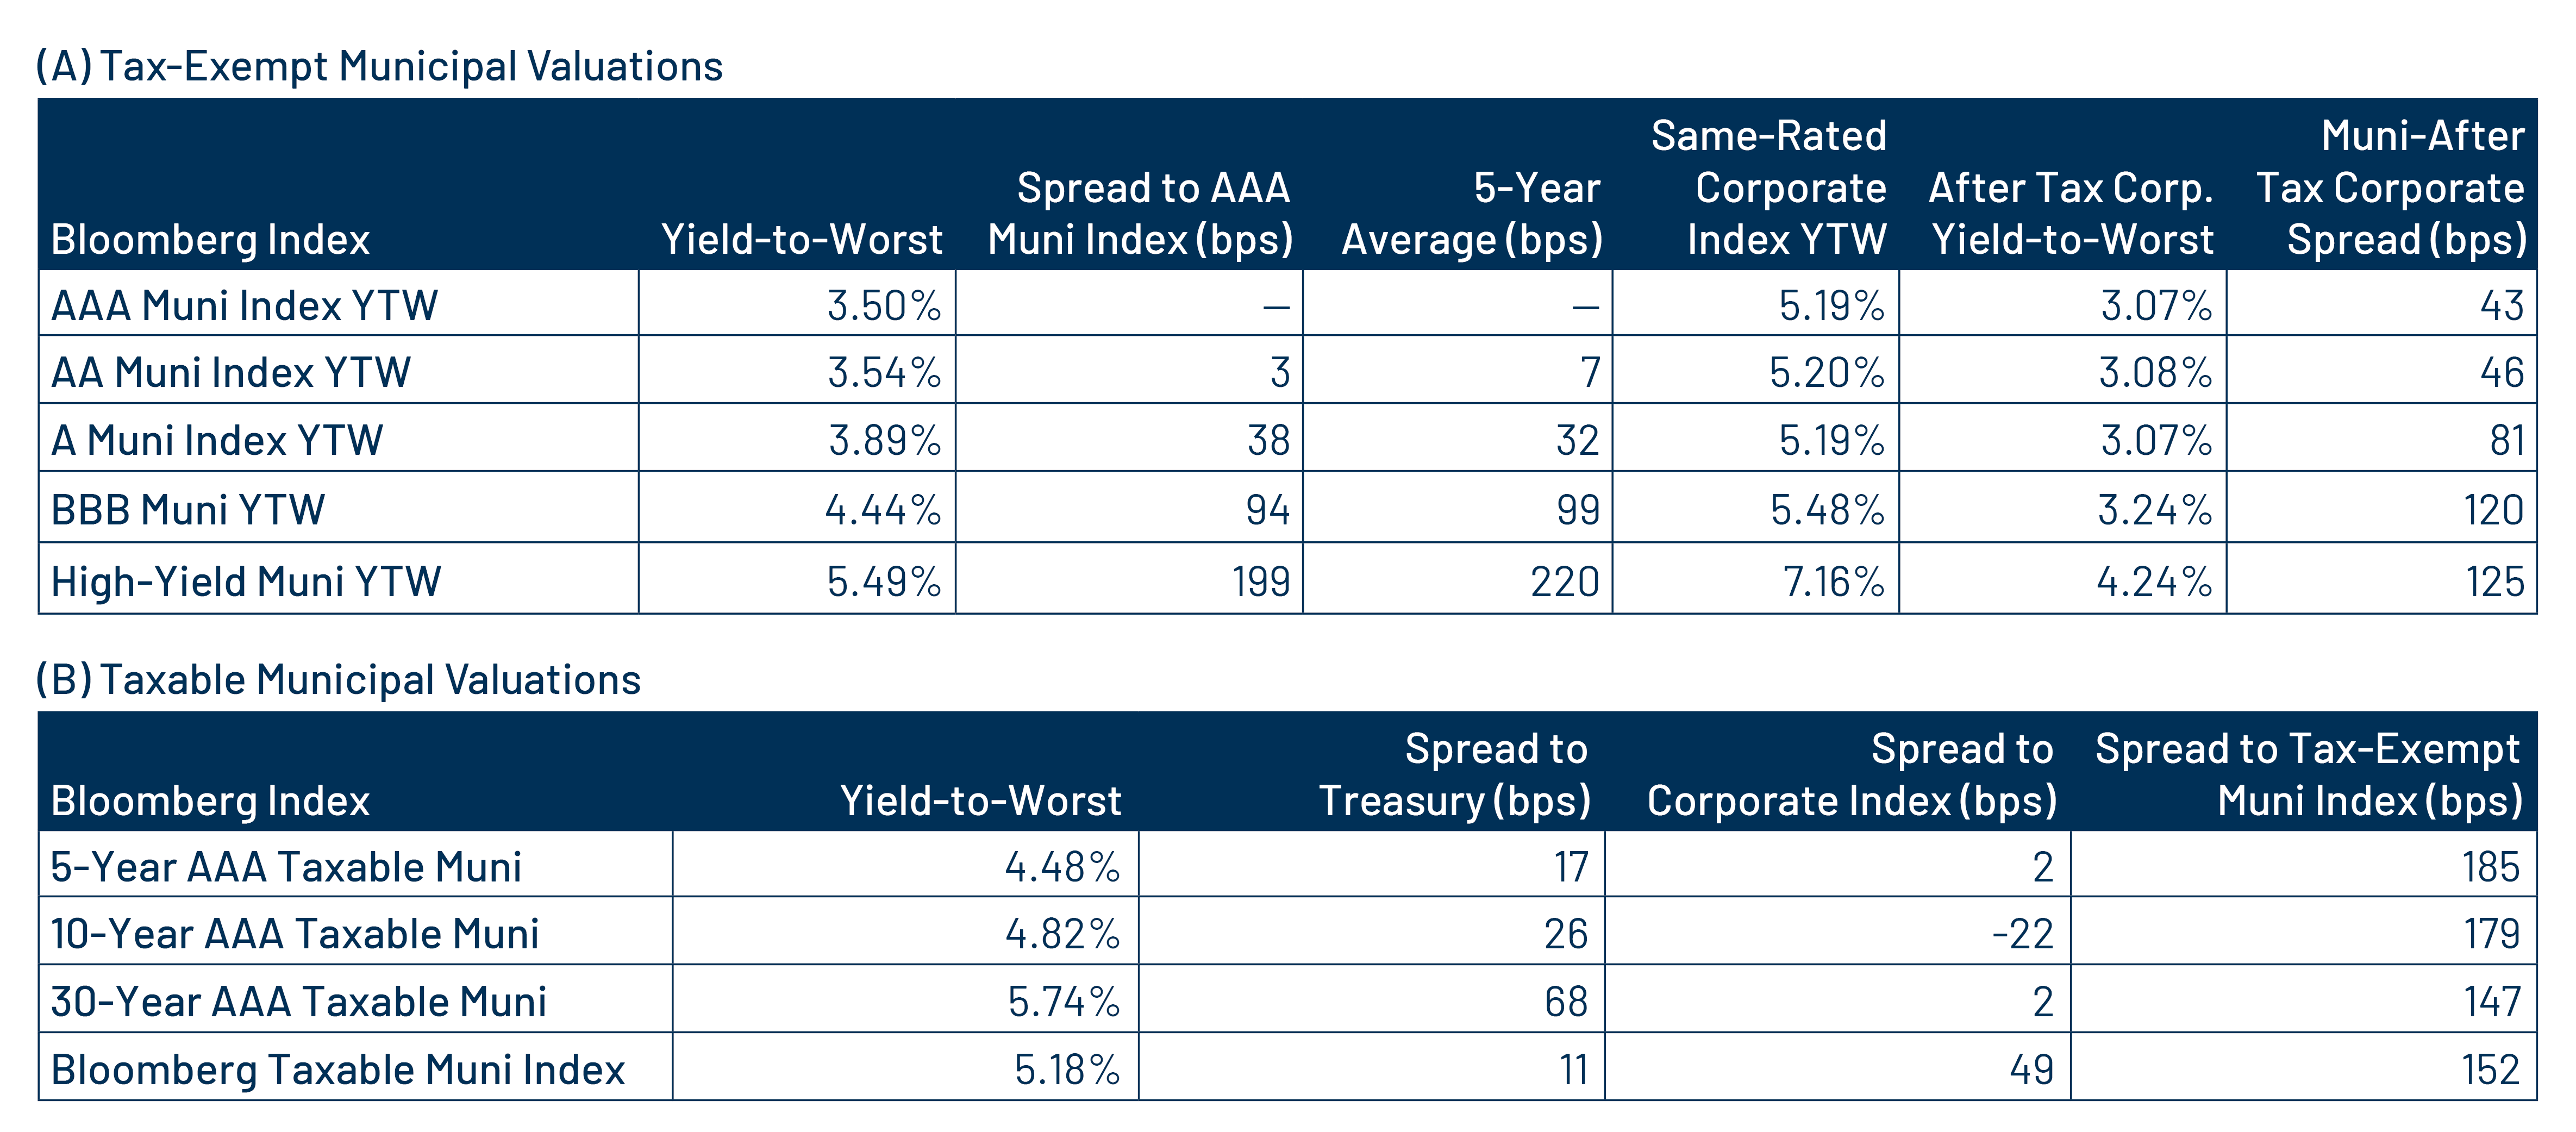
Exhibit 8: Tax-Exempt and Taxable Muni Valuations
Tax-Exempt and Taxable Muni Valuations
Source: Bloomberg, Western Asset. As of 10 Jul 26. Yield-to-worst (YTW) is the lowest potential yield that can be received on a bond without the issuer actually defaulting. AAA, AA, A, BBB Corporate Indices; After-Tax Yield assumes a top effective tax rate of 40.8%. Taxable Muni Index Corporate comparable used is the Global Corporate Aggregate (ex. BBB) to better align credit quality and duration. Select the image to expand the view.

Western Asset Key Themes for Muni Investors

Theme 1: Municipal taxable-equivalent yields remain elevated relative to historical averages.
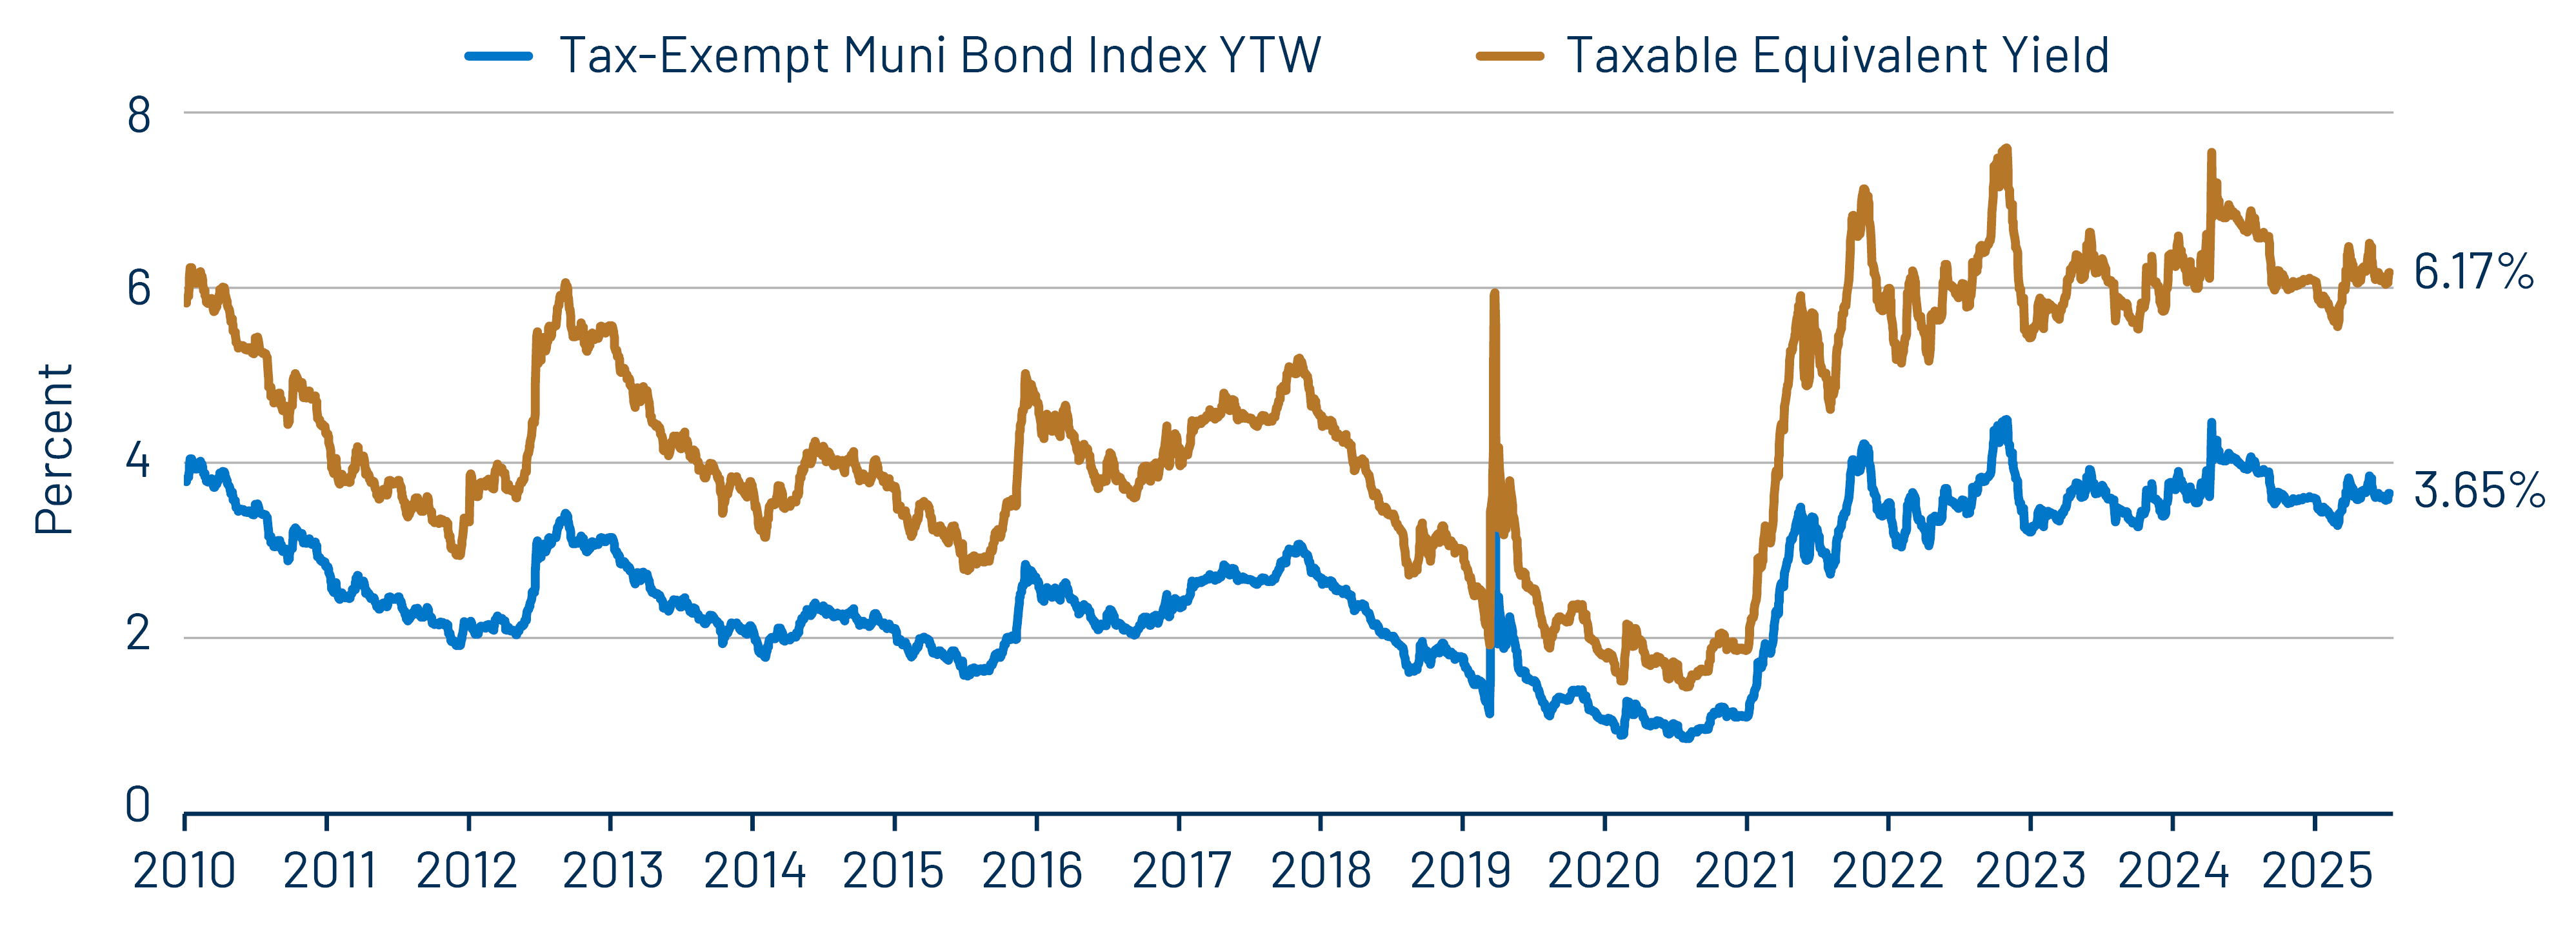
Exhibit 9: Muni and Taxable-Equivalent Muni Yield-to-Worst
Muni and Taxable-Equivalent Muni Yield-to-Worst
Source: Bloomberg, Western Asset. As of 10 Jul 26. Bloomberg Municipal Bond Index yield considering highest marginal tax rate of 40.8%. Indexes are unmanaged and one cannot directly invest in them. They do not include fees, expenses or sales charges. Past performance is not an indicator or a guarantee of future results. Select the image to expand the view.

Theme 2: Munis offer attractive after-tax yield pickup vs. longer-duration or lower-quality taxable alternatives.
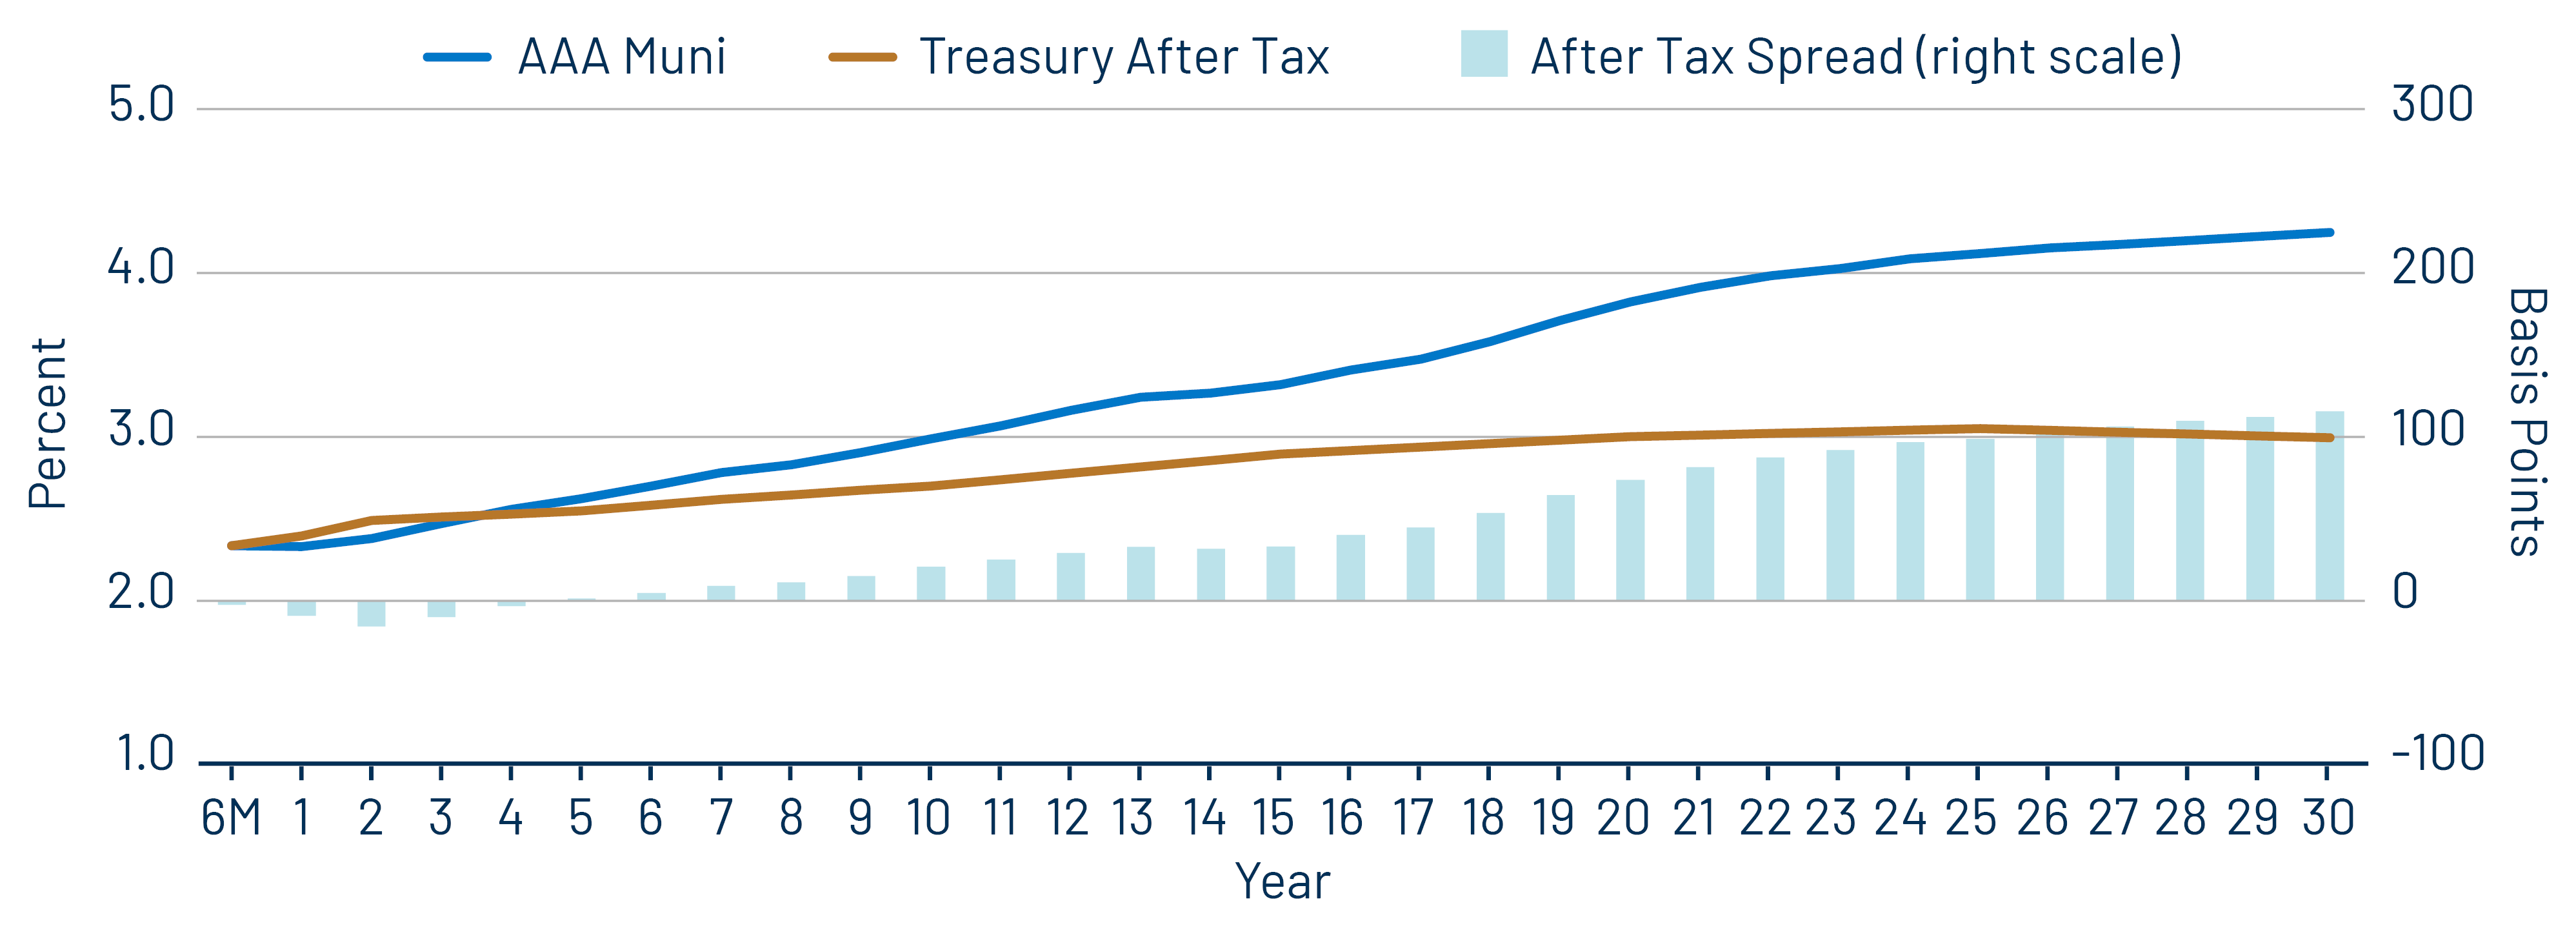
Exhibit 10: AAA Municipal vs. Treasury Yield Curves
AAA Municipal vs. Treasury Yield Curves
Source: Bloomberg, Western Asset. As of 10 Jul 26. Bloomberg Valuation Service (BVAL) AAA Muni Curve and US On-/Off-the-Run Sovereign Curve. Indexes are unmanaged and one cannot directly invest in them. They do not include fees, expenses or sales charges. Past performance is not an indicator or a guarantee of future results. Select the image to expand the view.

Theme 3: The muni curve remains steep and offers relative value in longer maturities.
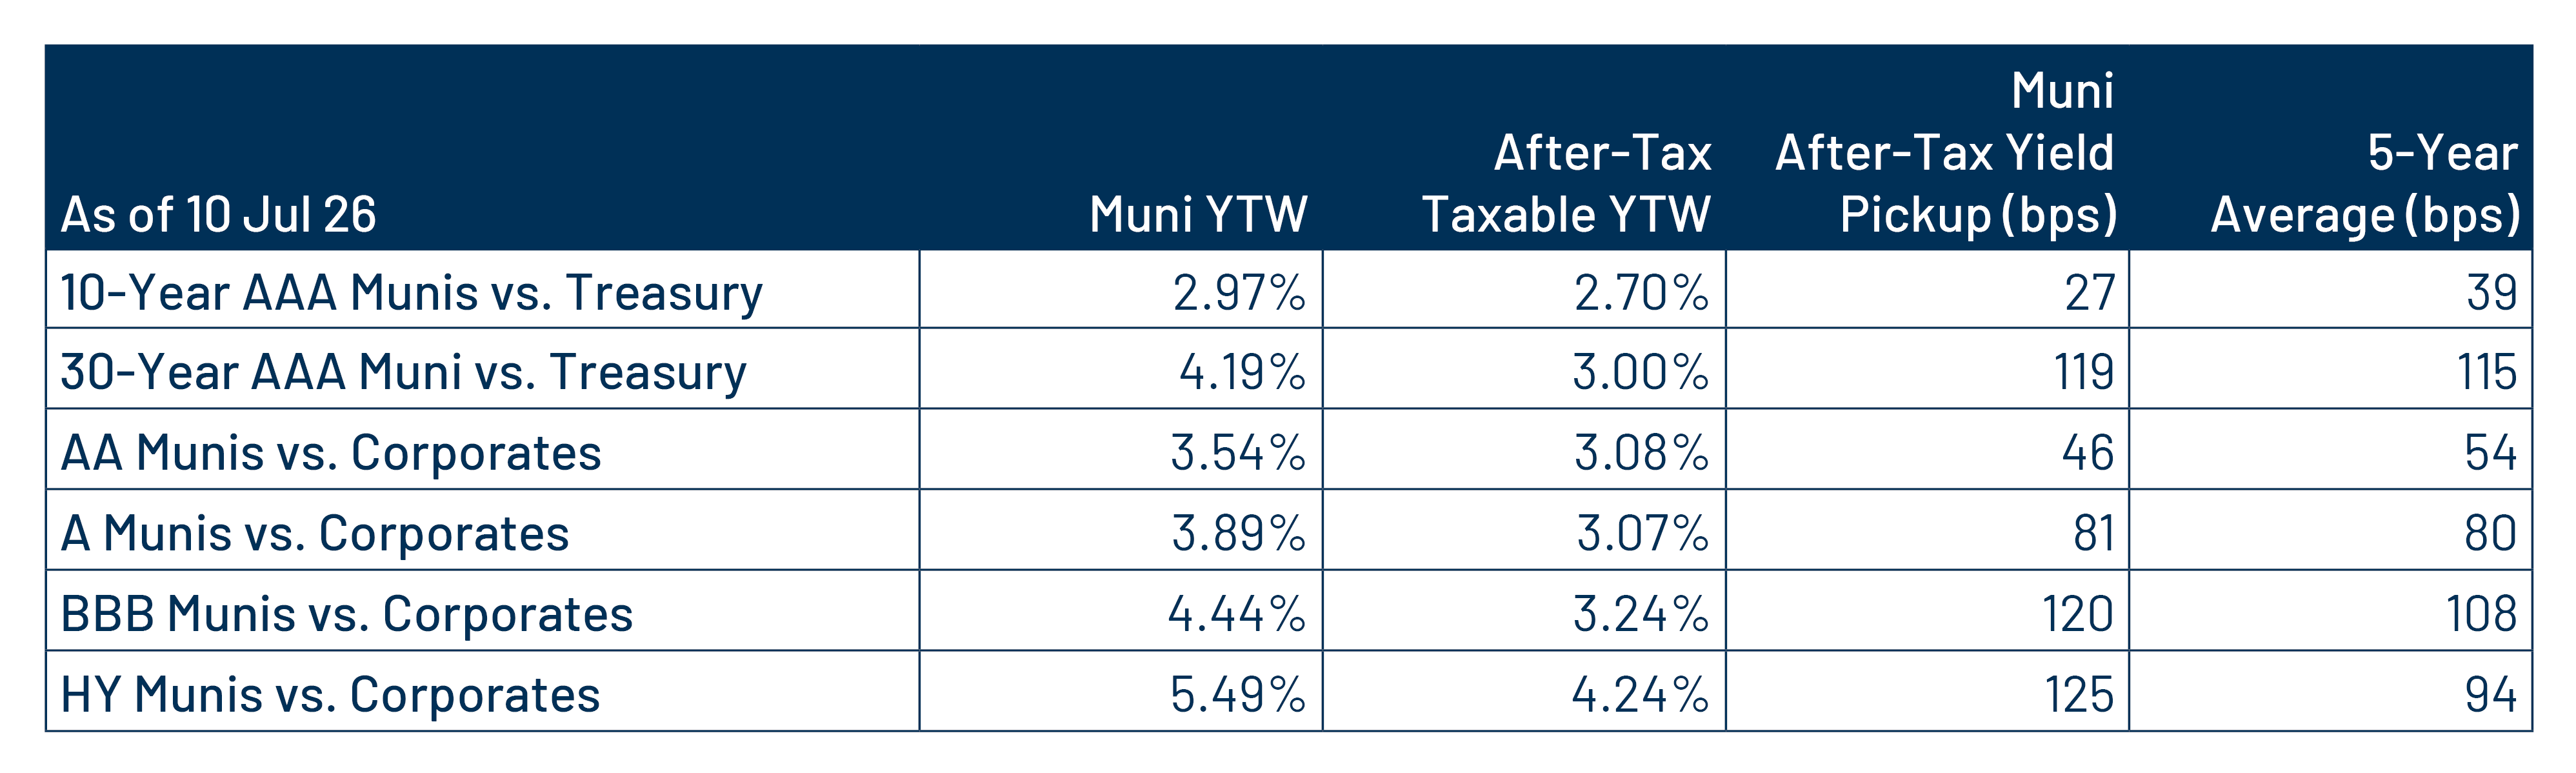
Exhibit 11: Municipal vs. Taxable Fixed-Income Yields by Quality
Municipal vs. Taxable Fixed-Income Yields by Quality
Source: Western Asset, Bloomberg. As of 10 Jul 26. 10- and 30-Year comparison reflects Bloomberg Valuation Service (BVAL) AAA Muni Curve and US On-/Off-the-Run Sovereign Curve. AA Muni reflects the Bloomberg AA Muni Bond Index. A Muni reflects the Bloomberg A Muni Bond Index. BBB Muni reflects the Bloomberg BBB Muni Bond Index. HY Muni reflects the Bloomberg High Yield Muni Bond Index. AA Corp reflects the Bloomberg AA Corporate Bond Index. A Corp reflects the Bloomberg A Corporate Bond Index. BBB Corp reflects the Bloomberg BBB Corporate Bond Index. After-tax yield considers the top marginal tax rate of 40.8%. Indexes are unmanaged and one cannot directly invest in them. They do not include fees, expenses or sales charges. Past performance is not an indicator or a guarantee of future results. Select the image to expand the view.

© Western Asset Management Company, LLC 2026. The information contained in these materials ("the materials") is intended for the exclusive use of the designated recipient ("the recipient"). This information is proprietary and confidential and may contain commercially sensitive information, and may not be copied, reproduced or republished, in whole or in part, without the prior written consent of Western Asset Management Company ("Western Asset").
Past performance does not predict future returns. These materials should not be deemed to be a prediction or projection of future performance. These materials are intended for investment professionals including professional clients, eligible counterparties, and qualified investors only.
For the Franklin Templeton global-non product disclosures, please click here.
These materials have been produced for illustrative and informational purposes only. These materials contain Western Asset's opinions and beliefs as of the date designated on the materials; these views are subject to change and may not reflect real-time market developments and investment views.
Third party data may be used throughout the materials, and this data is believed to be accurate to the best of Western Asset's knowledge at the time of publication, but cannot be guaranteed. These materials may also contain strategy or product awards or rankings from independent third parties or industry publications which are based on unbiased quantitative and/or qualitative information determined independently by each third party or publication. In some cases, Western Asset may subscribe to these third party's standard industry services or publications. These standard subscriptions and services are available to all asset managers and do not influence rankings or awards in any way.
Investment strategies or products discussed herein may involve a high degree of risk, including the loss of some or all capital. Investments in any products or strategies described in these materials may be volatile, and investors should have the financial ability and willingness to accept such risks.
Unless otherwise noted, investment performance contained in these materials is reflective of a strategy composite. All other strategy data and information included in these materials reflects a representative portfolio which is an account in the composite that Western Asset believes most closely reflects the current portfolio management style of the strategy. Performance is not a consideration in the selection of the representative portfolio. The characteristics of the representative portfolio shown may differ from other accounts in the composite. Information regarding the representative portfolio and the other accounts in the composite are available upon request. Statements in these materials should not be considered investment advice. References, either general or specific, to securities and/or issuers in the materials are for illustrative purposes only and are not intended to be, and should not be interpreted as, recommendation to purchase or sell such securities. Employees and/or clients of Western Asset may have a position in the securities or issuers mentioned.
These materials are not intended to provide, and should not be relied on for, accounting, legal, tax, investment or other advice. The recipient should consult its own counsel, accountant, investment, tax, and any other advisers for this advice, including economic risks and merits, related to making an investment with Western Asset. The recipient is responsible for observing the applicable laws and regulations of their country of residence.
Founded in 1971, Western Asset Management Company is a global fixed-income investment manager with offices in Pasadena, New York, London, Singapore, Tokyo, Melbourne, São Paulo, Hong Kong, and Zürich. Western Asset is a wholly owned subsidiary of Franklin Resources, Inc. but operates autonomously. Western Asset is comprised of six legal entities across the globe, each with distinct regional registrations: Western Asset Management Company, LLC, a registered Investment Adviser with the Securities and Exchange Commission; Western Asset Management Company Ltda. is regulated by Comissão de Valores Mobiliários; Western Asset Management Company Pty Ltd ABN 41 117 767 923 is the holder of the Australian Financial Services License 303160; Western Asset Management Company Pte. Ltd. Co. Reg. No. 200007692R is a holder of a Capital Markets Services License for fund management and regulated by the Monetary Authority of Singapore; Western Asset Management Company Ltd, a registered Financial Instruments Business Operator and regulated by the Financial Services Agency of Japan; and Western Asset Management Company Limited is authorised and regulated by the Financial Conduct Authority ("FCA") (FRN 145930). This communication is intended for distribution to Professional Clients only if deemed to be a financial promotion in the UK as defined by the FCA. This communication may also be intended for certain EEA countries where Western Asset has been granted permission to do so. For the current list of the approved EEA countries please contact Western Asset at +44 (0)20 7422 3000.