Macros, Markets and Munis
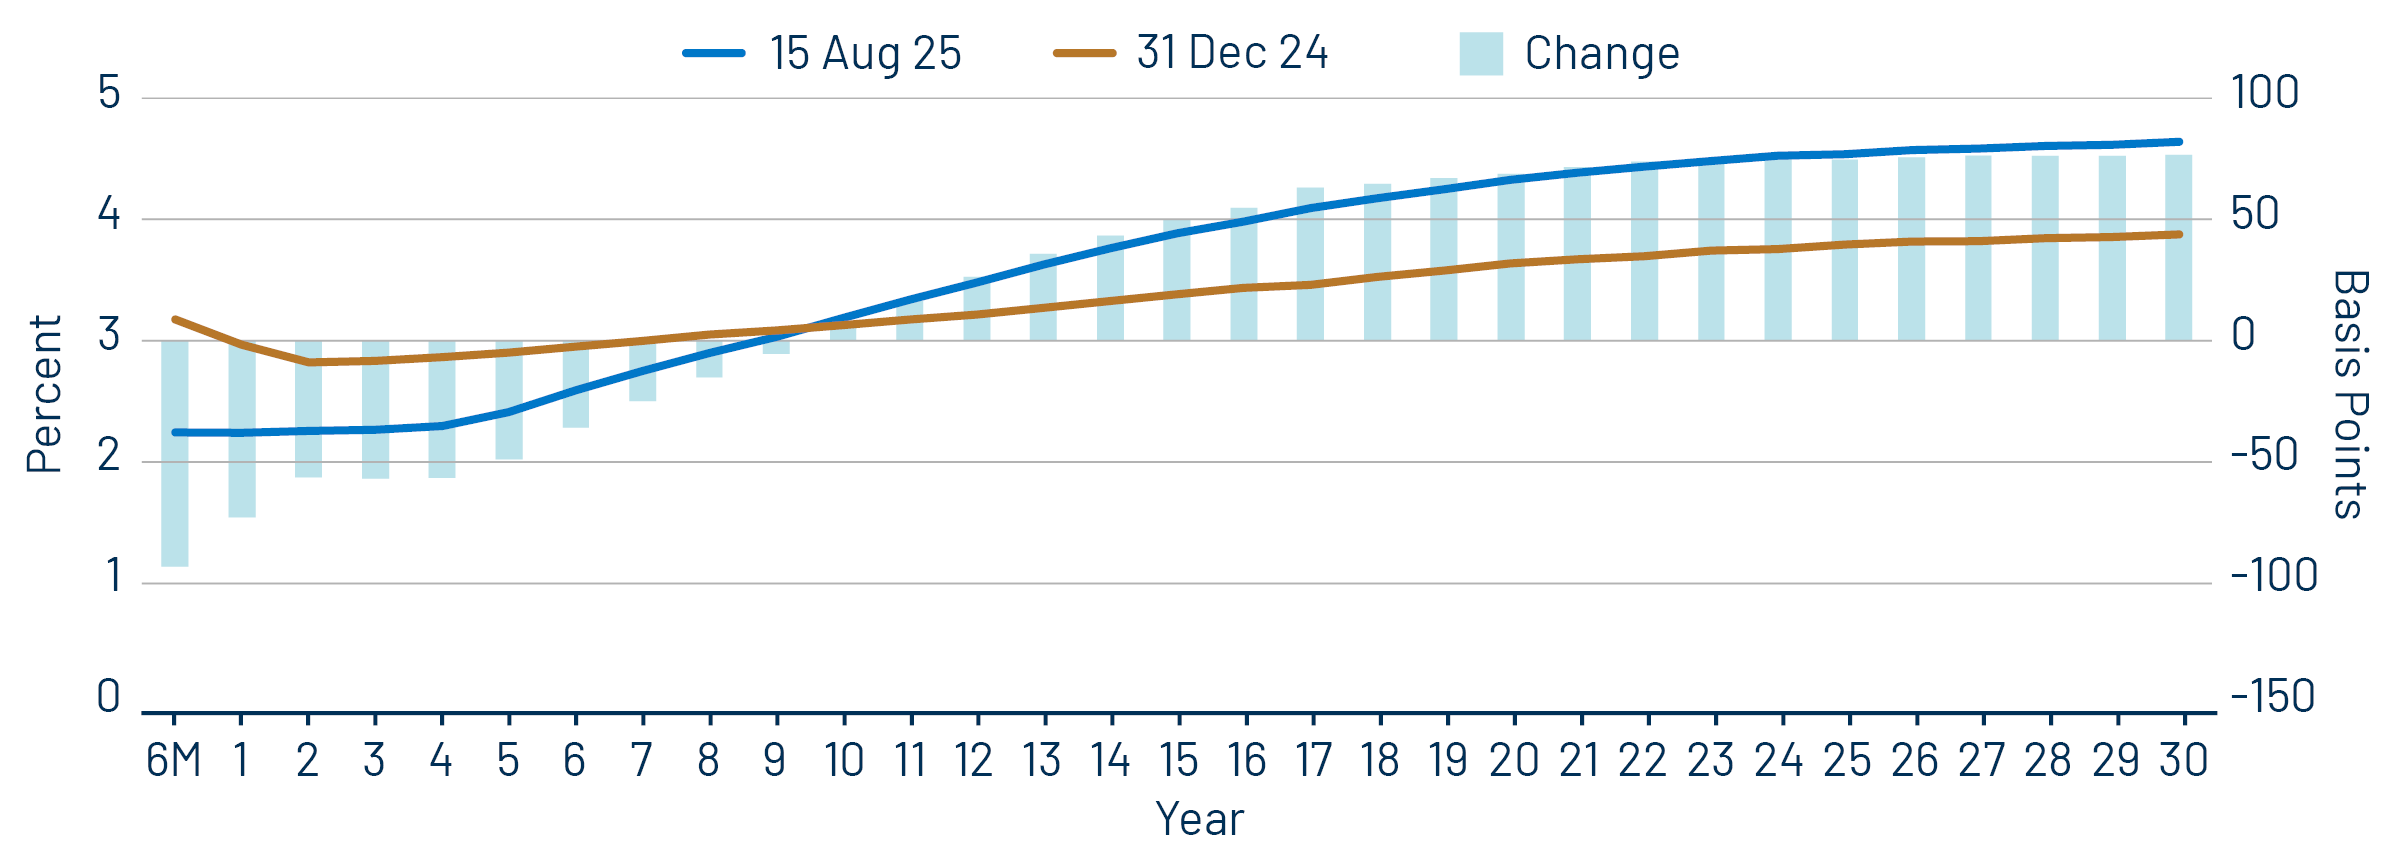
Munis posted negative returns, but generally outperformed Treasuries last week. Fixed-income markets were focused on inflation data as July Consumer Price Index (CPI) and Producer Price Index (PPI) data were released. The CPI came in slightly below expectations at 2.7% year-over-year (YoY), while PPI growth of 3.7% YoY surprised to the upside, outpacing June’s level of 2.6% and the market consensus of 3.0%. Offsetting the inflation strength were slower-than-expected retail sales and University of Michigan sentiment data. The Treasury curve steepened, with yields moving lower inside of two years, but moving higher beyond five years. The municipal yield curve also steepened but modestly outperformed. Meanwhile, technicals weakened amid fund outflows and elevated supply conditions. With summer travel underway, this week we touch on transportation sector trends.
Muni Funds Post Outflows as Supply Remained Elevated
Fund Flows ($103 million of net inflows): During the week ending August 13, weekly reporting municipal mutual funds recorded $103 million of net outflows, according to Lipper. Long-term, intermediate and high-yield categories led outflows, recording $323 million, $57 million and $18 million of redemptions, respectively. Short and short/intermediate funds recorded $275 million of net inflows. Last week’s outflows led year-to-date (YTD) inflows lower to $20 billion.
Supply (YTD supply of $371 billion; up 25% YoY): The muni market recorded $15 billion of new-issue supply last week, down 24% from the prior week but remaining at elevated levels. YTD new-issue supply of $371 billion is 25% higher than the prior year, with tax-exempt issuance up 27% YoY and taxable issuance up 6%, respectively. This week’s calendar is expected to remain elevated at $13 billion. The largest deals include $1.4 billion New York City Transitional Finance Authority and $1.2 billion Los Angeles County General Obligation transactions.
This Week in Munis: Summer Travel
As summer travel accelerates in 2025, passenger traffic trends, capital investments and policy responses are revealing distinct patterns across the toll road, airport and mass transit sectors with varying potential credit implications.
Toll Roads
Toll roads continue to benefit from steady growth in vehicle traffic. The most recent data from April 2025 indicates that average vehicle miles traveled reached 276 billion per month over the prior 12 months, up 1% YoY and above the pre-pandemic high of 274 billion. This growth in road travel has been supported by Americans’ preference for driving over flying, largely due to the greater affordability and flexibility it offers—particularly among middle- and lower-income Americans, with 63% and 68%, respectively, preferring to drive rather than fly in the most recent Enterprise Mobility Summer Travel Survey.
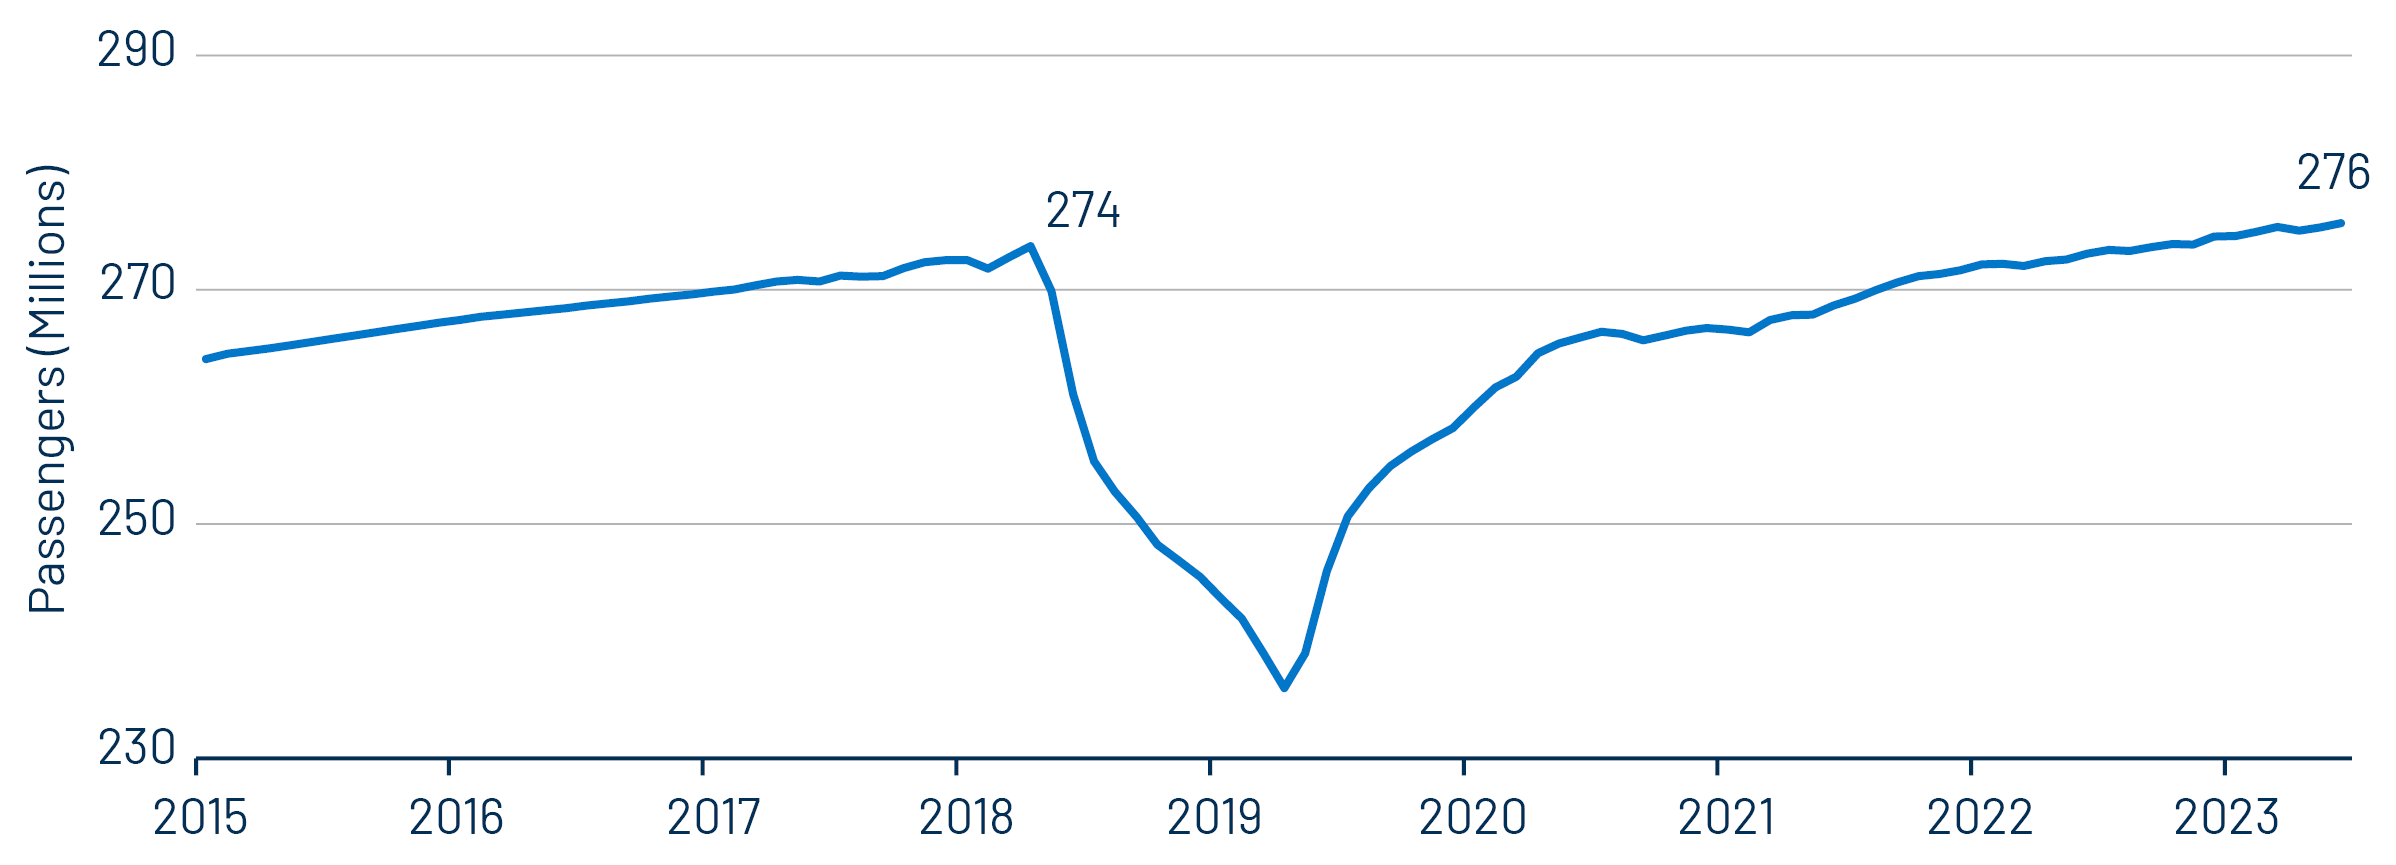
Toll roads in high-growth corridors continue to benefit from favorable demographic tailwinds, while mature systems maintain stable credit profiles. However, suburban systems with high remote work populations continue to lag, with traffic volumes still below pre-pandemic levels. Within the toll road sector, Western Asset seeks issuers that demonstrate pricing power, demand predictability and strong regional economic momentum.
Airports
Airports have broadly benefited from steadily improving enplanement levels, with the 12-month trailing average enplanements of 82 million per month, approximately 5% above pre-pandemic highs. This enplanement growth has been supported by leisure travel and a gradual rebound in business travel. Airport infrastructure investment remains robust, with airport revenue bond supply running at 30%-35% above 2024 issuance, led by large deals at LAX, JFK and Salt Lake City.
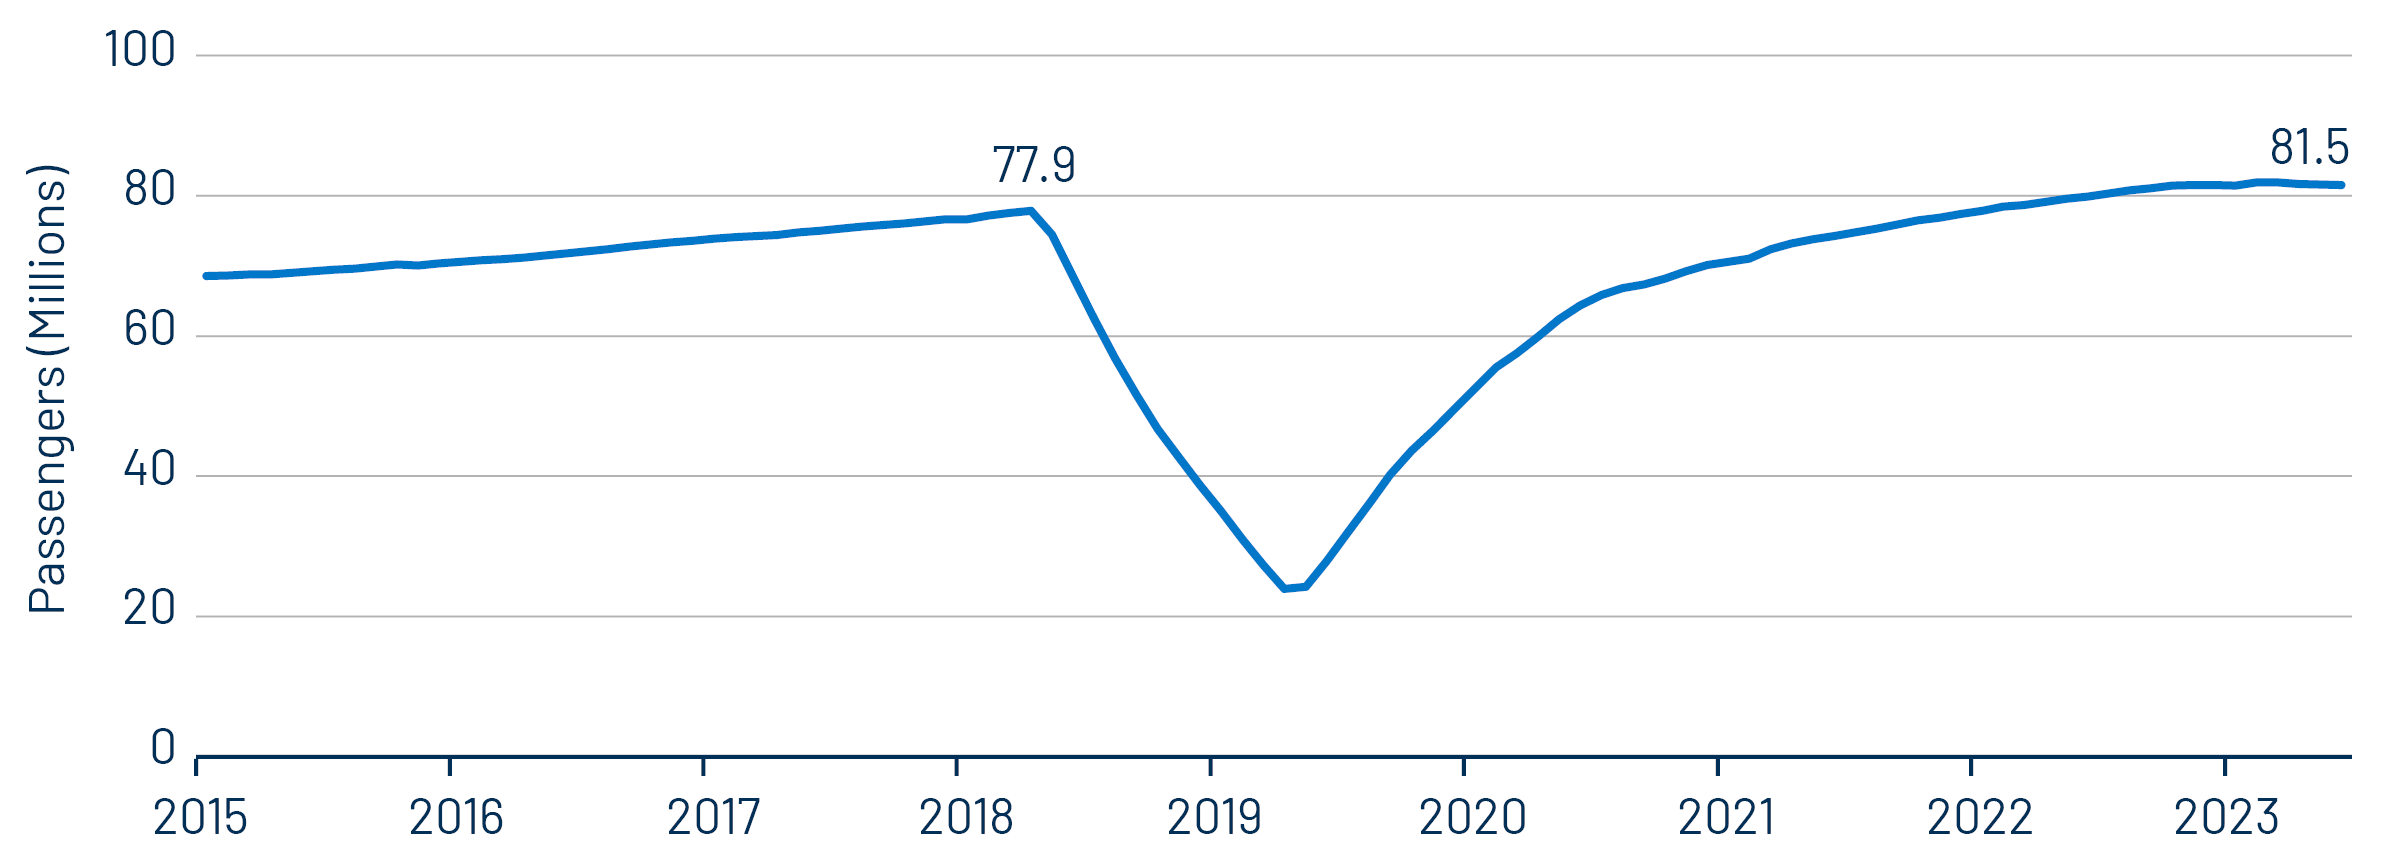
While credit outcomes are broadly stable, future divergence may emerge depending on economic conditions and operational discipline. Western Asset favors airports with large and diversified revenue streams, premium traveler services and prudent leverage management. Meanwhile, weaker airports that took on higher debt during the post-pandemic construction boom could face pressure if margins compress or traffic growth slows.
Mass Transit
Mass transit ridership continues to lag ridership levels observed prior to the pandemic but has rebounded significantly in the past year to 85% of pre-pandemic levels (up from 75% in 2024), according to the American Public Transportation Association (APTA). The recent recovery has been led by bus and non-commute trips. As ridership has remained below pre-pandemic levels, many jurisdictions have stepped in to support operations and capital programs with public funding mechanisms such as oil and gas taxes, sales taxes and state appropriations.
These measures have helped stabilize finances and avoid large-scale service cuts. Recent sector upgrades including a bellwether NY MTA (whose S&P rating of “A-” rose to “A” last week) reflect improving credit quality, though outcomes remain regionally uneven and reliant on the implementation of dedicated funding streams. Western Asset favors large systems with a history of demonstrated political support and funding sources to address short- and long-term fund needs.
Western Asset’s investment strategies generally remain overweight to the transportation sector, which has outperformed over 1- and 3-year periods, continues to offer above-average income opportunities, and benefits from ongoing improvements in economic conditions. We expect the sector’s inherent diversity and dynamic fundamentals, which include traffic trends, policy support and financial operations, to provide opportunities for risk-adjusted value within actively managed municipal portfolios.
Municipal Credit Curves and Relative Value
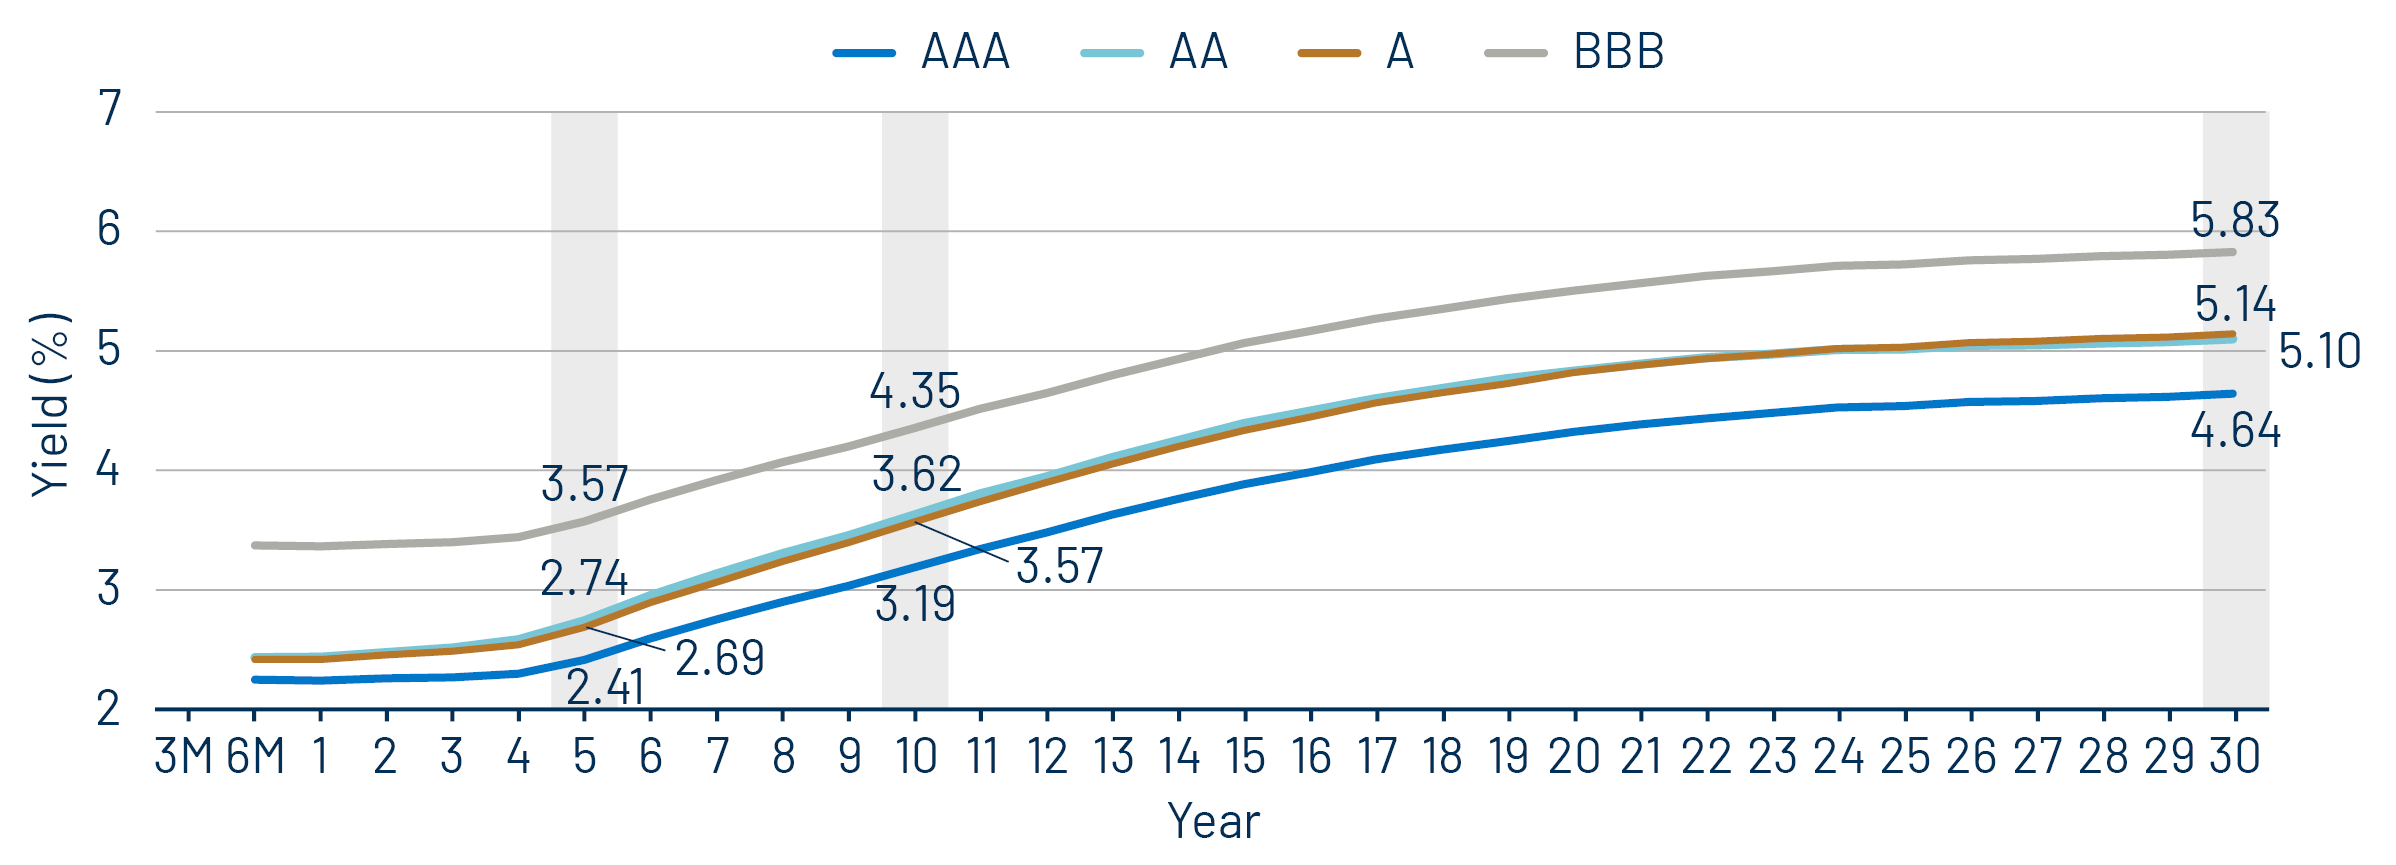
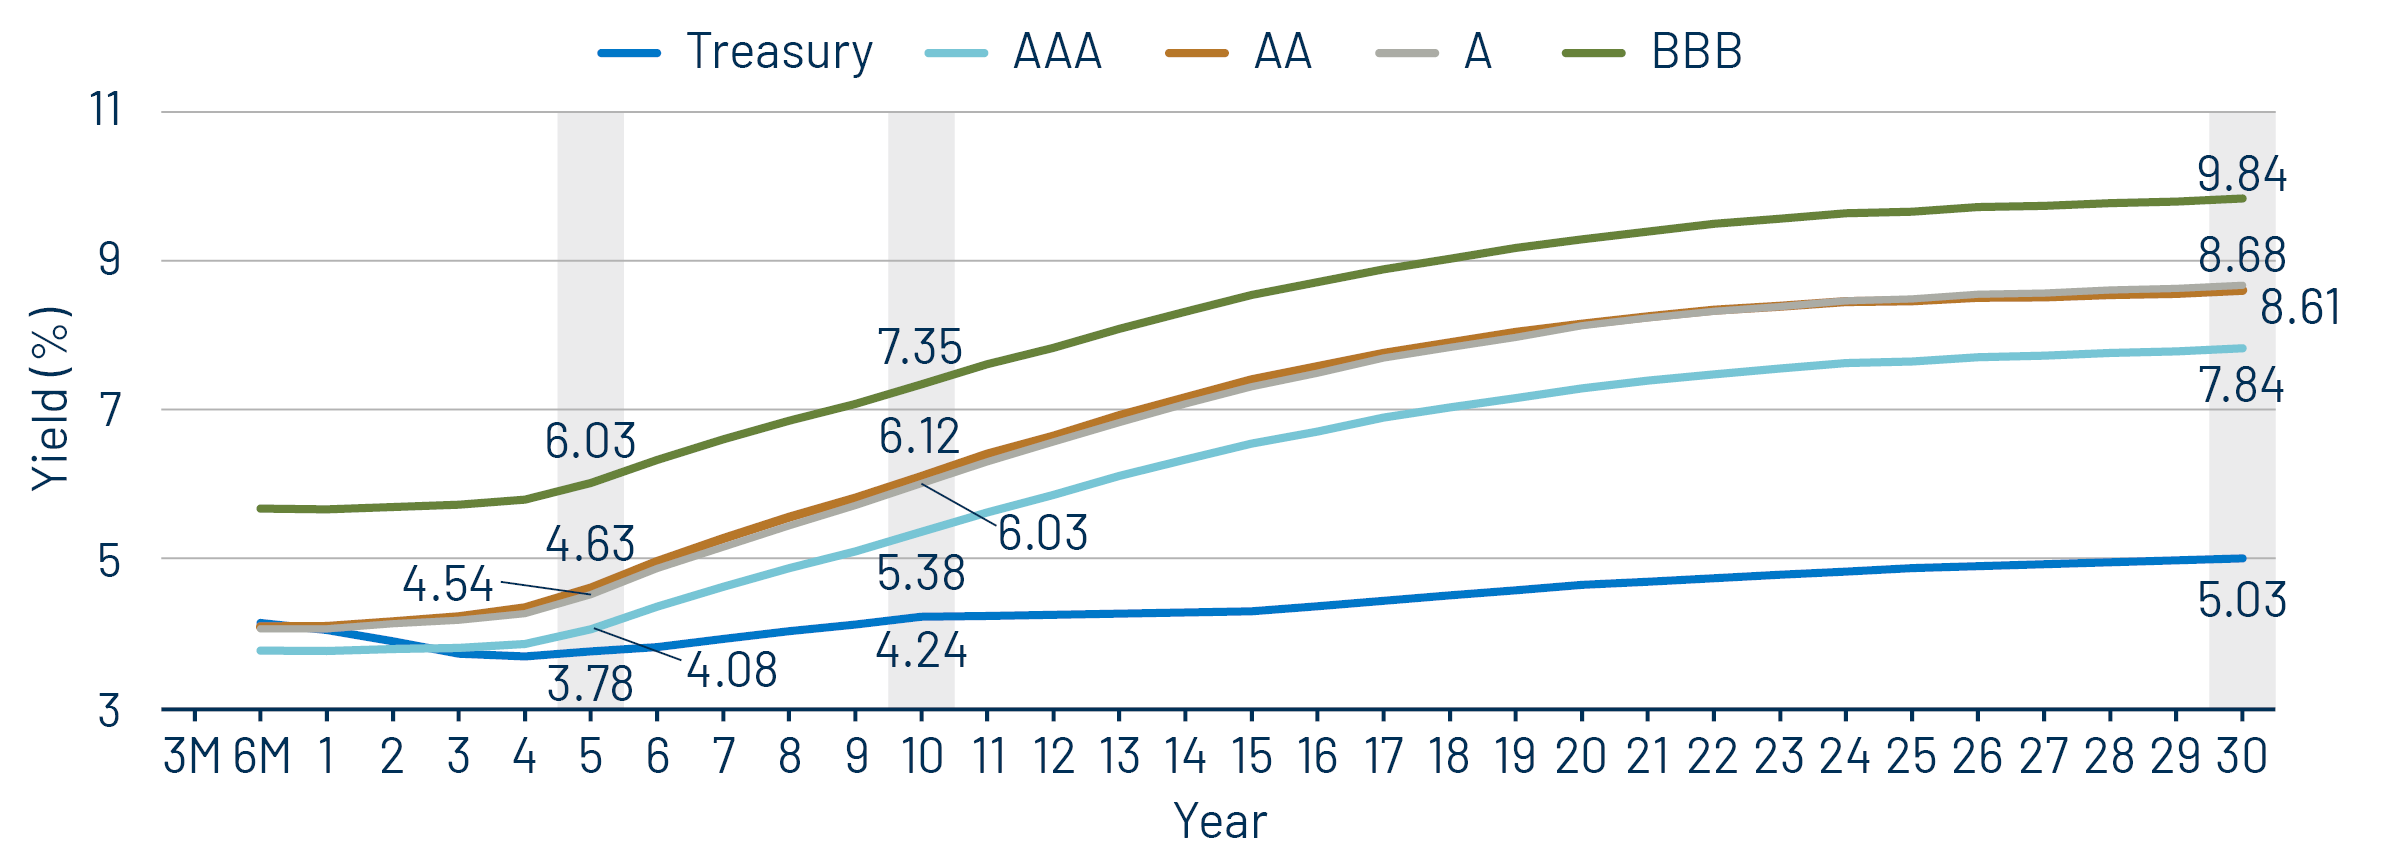
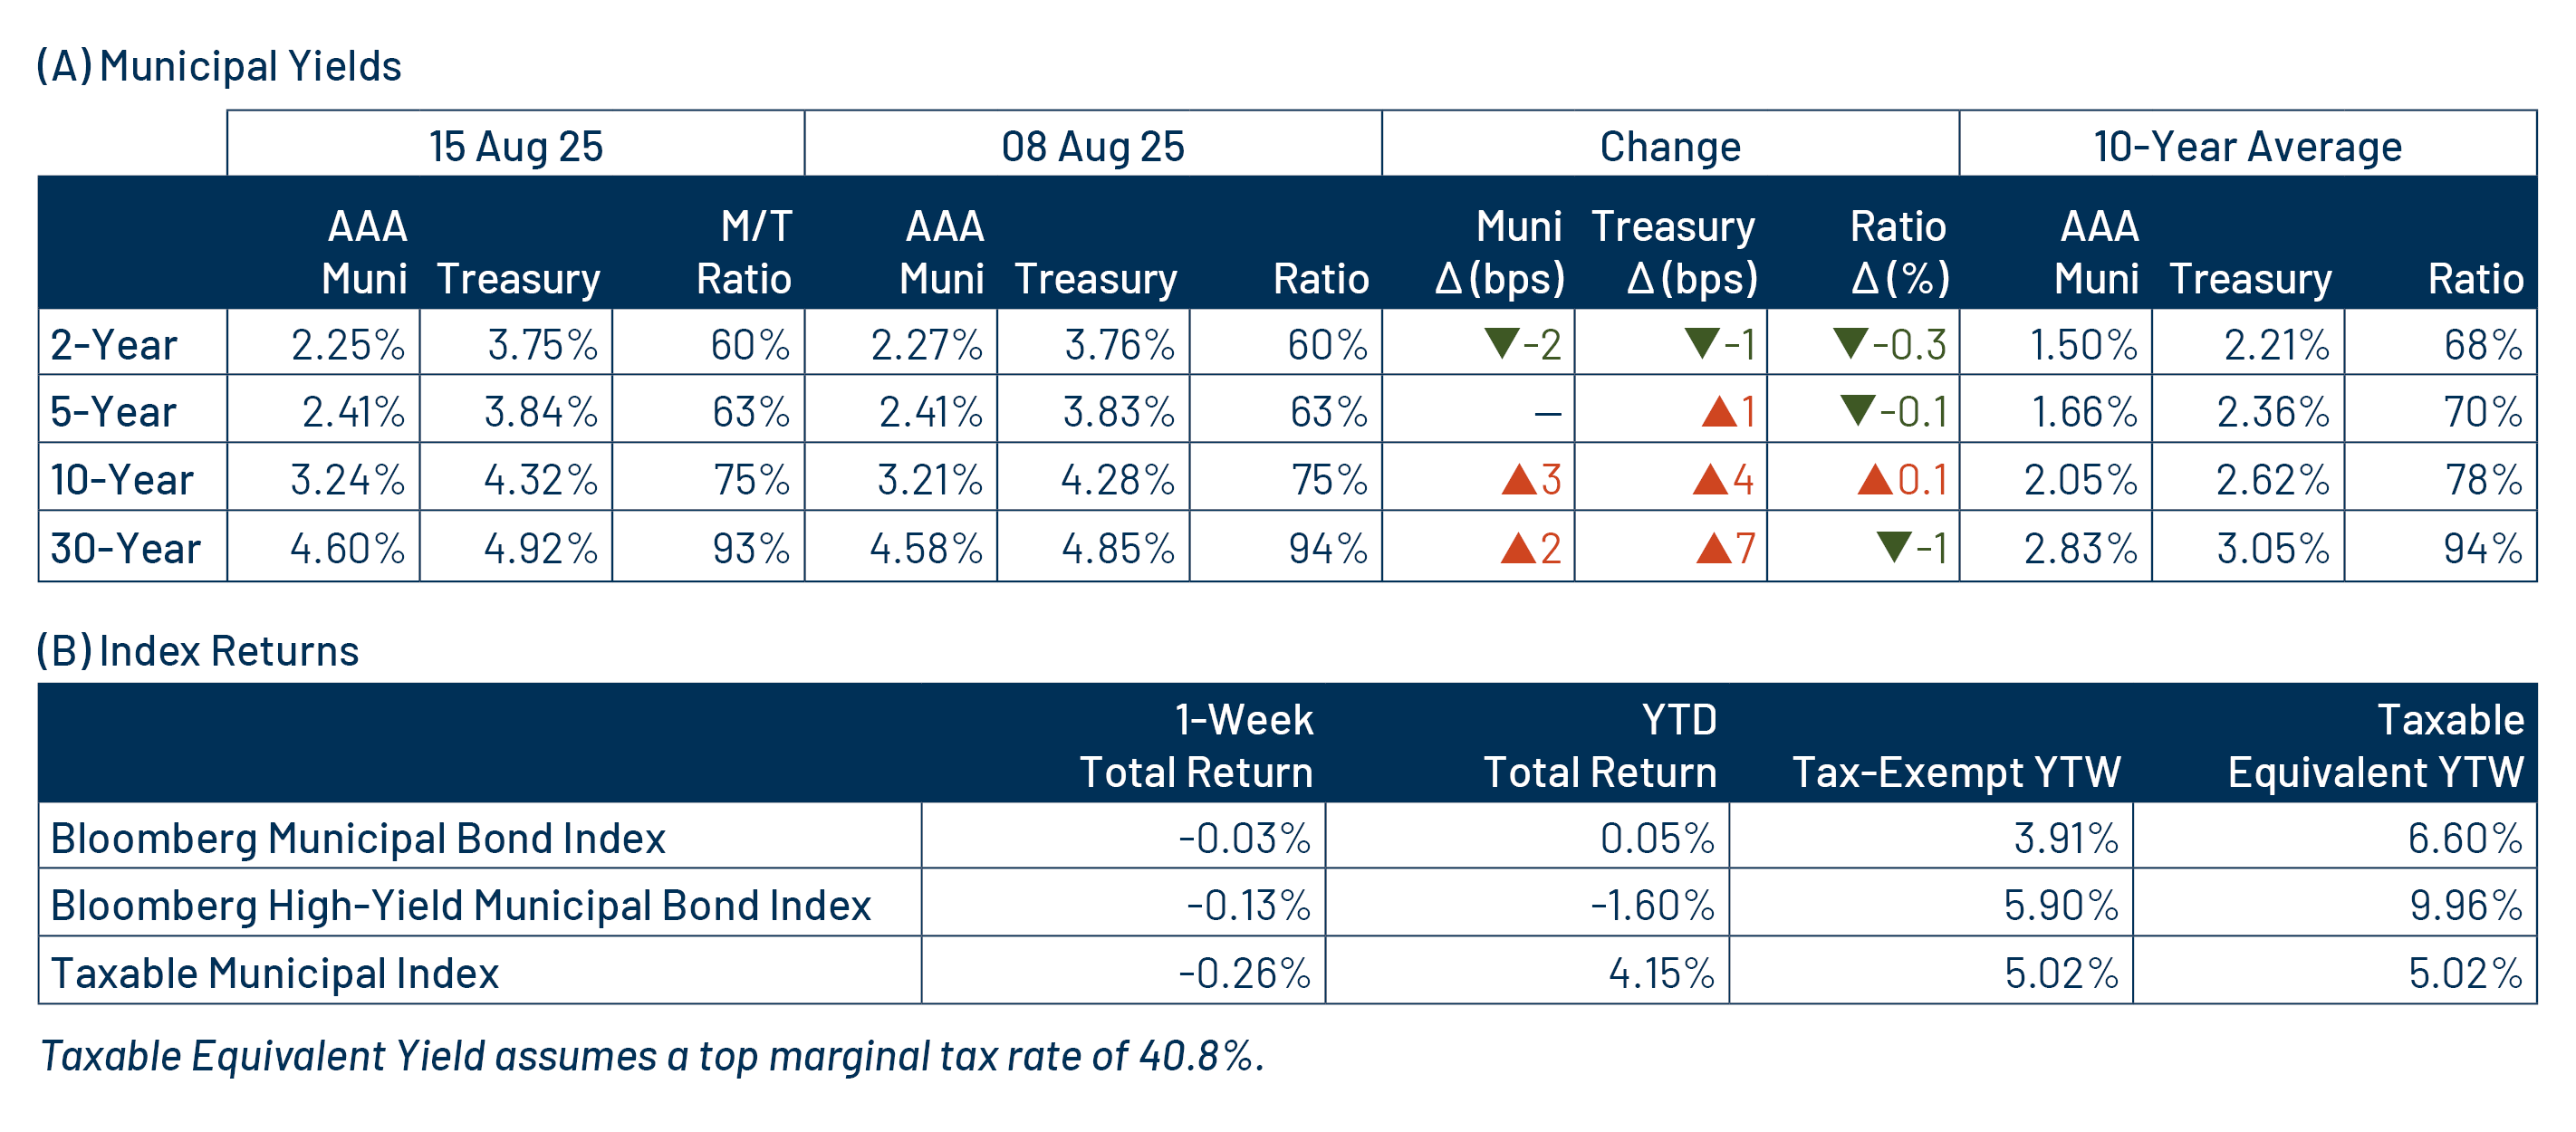
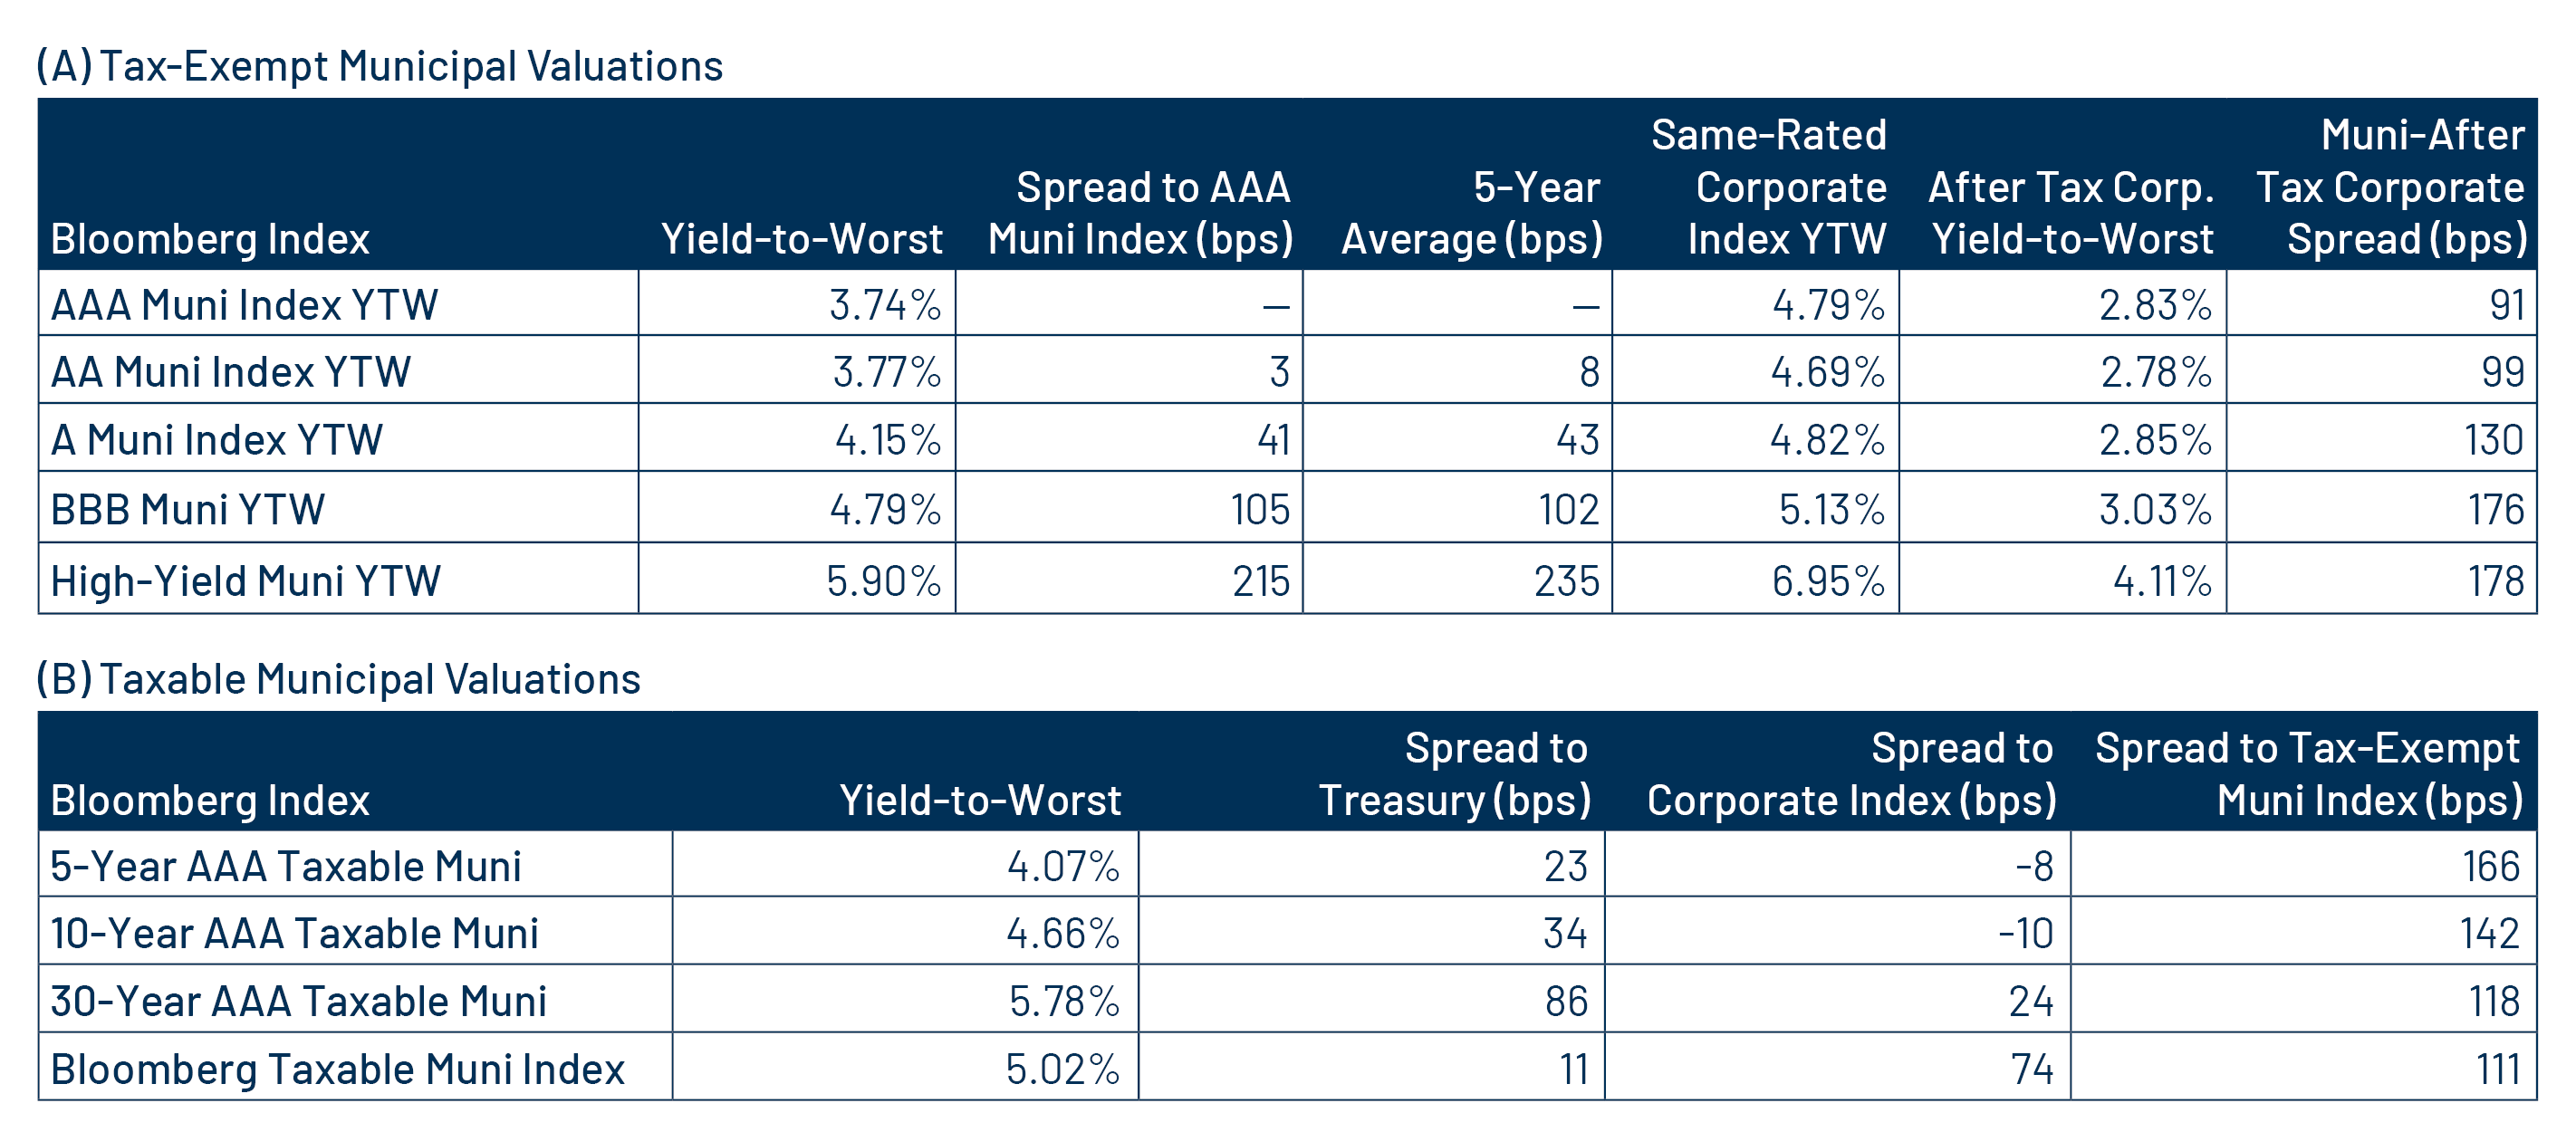
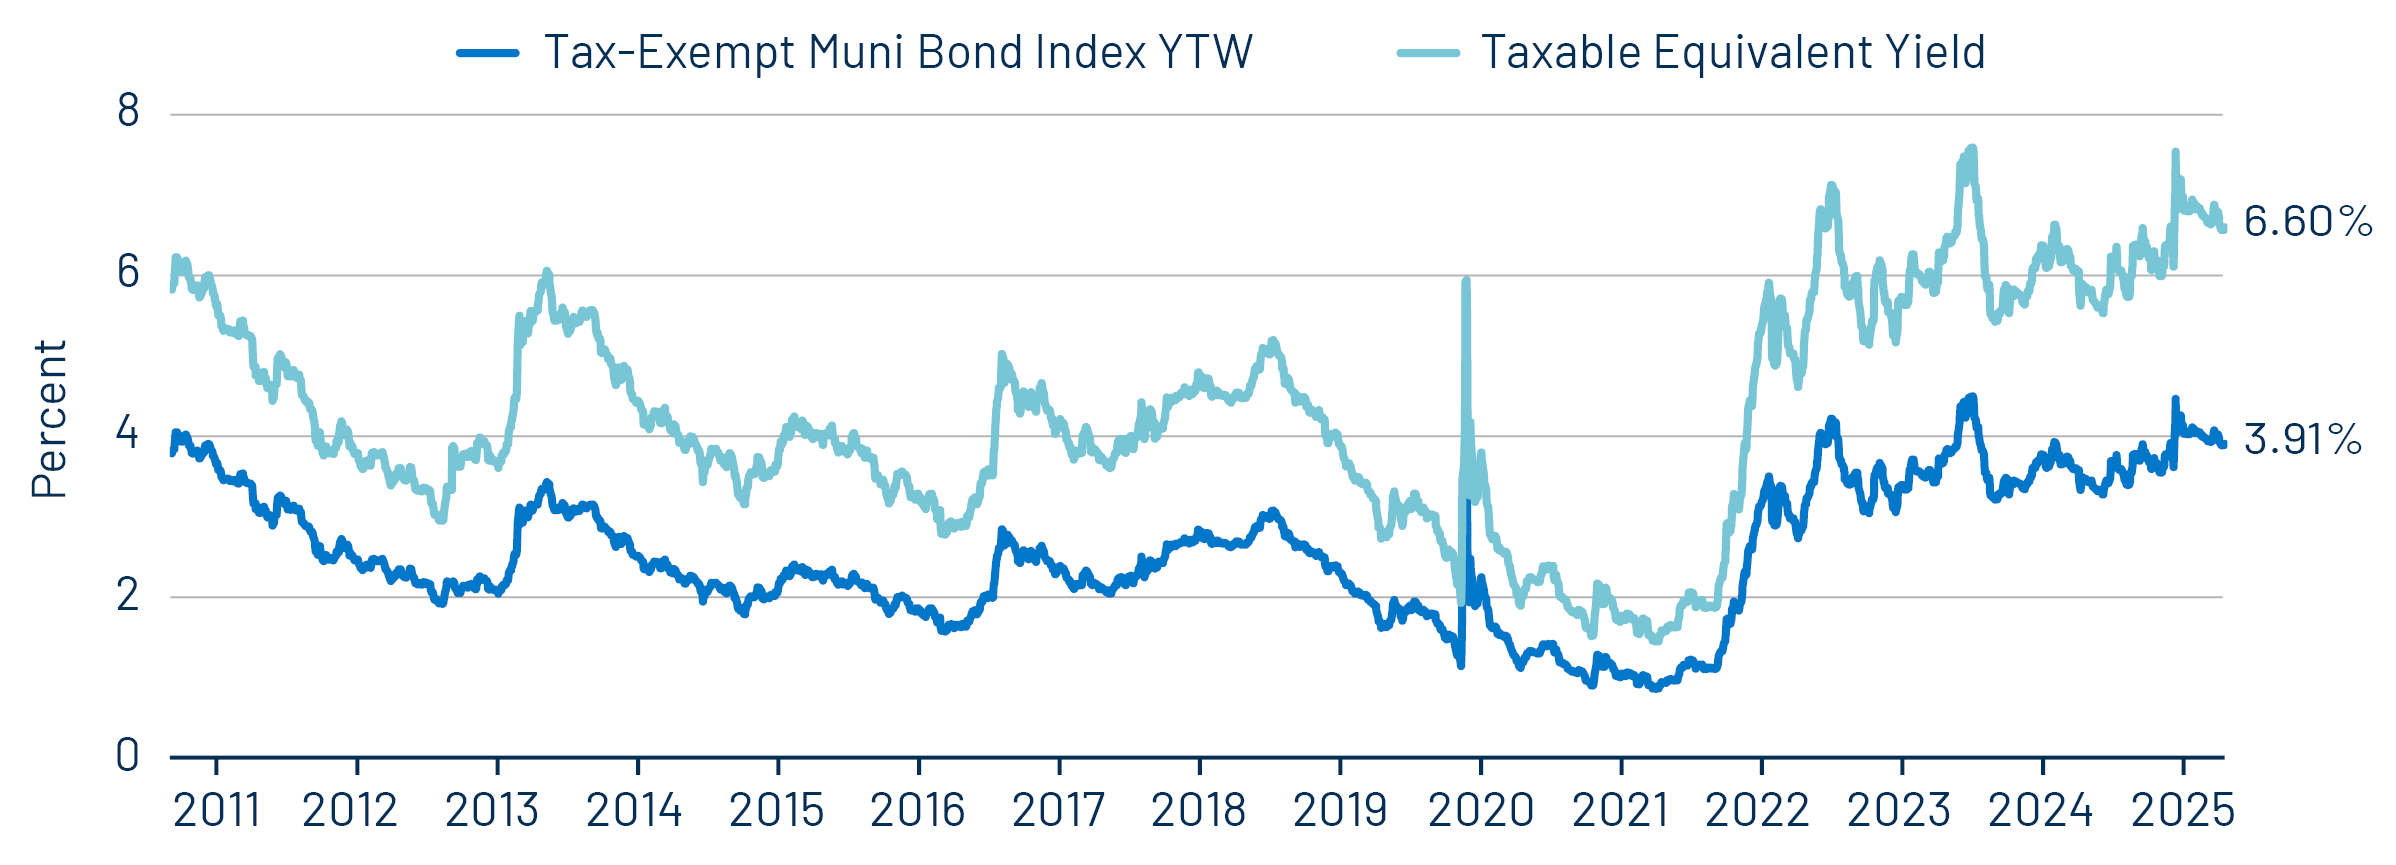
Theme #1: Municipal taxable-equivalent yields and income opportunities remain near decade-high levels.
Theme #2: The AAA muni curve has steepened, offering better value in intermediate and longer maturities.
Theme #3: Munis offer attractive after-tax yield compared to taxable alternatives.


