skip navigation
Western Asset Management Company
Blog

Stay up to date on timely topics and market events. Subscribe to our Blog now.

MARKETS
June 09, 2026

Weekly Municipal Monitor—Strong State and Local Hiring

By Sam Weitzman

Stay up to date on timely topics and market events. Subscribe to our Blog now.

Macros, Markets and Munis

Municipals rallied last week, shrugging off Treasury weakness as the fixed-income market sold off, largely driven by strong economic data. ISM manufacturing and durable goods readings both increased from the prior month and exceeded expectations ahead of Friday’s jobs report, which indicated that employers added 172,000 jobs in May and revised March and April payrolls upward by a combined 93,000. Treasuries sold off broadly, with yields rising 2-14 basis points (bps). Treasury markets are now pricing in a Federal Reserve (Fed) rate hike by the end of the year. Meanwhile, municipals outperformed, with yields falling 4-9 bps across the curve, as robust muni demand absorbed an elevated supply calendar. Following the strong jobs report on Friday, this week we touch on the favorable muni employment gains in May.

Demand Remained Strong Amid Elevated Supply Levels

Fund Flows ($1.4 billion of net inflows): During the week ending June 3, weekly reporting municipal mutual funds recorded $1.4 billion of net inflows, according to Lipper. The long-term category represented the majority of flows, recording $1.3 billion of inflows, followed by the intermediate category that reported $14 million of inflows and the short category that recorded $43 million of inflows. Last week’s inflows bring year-to-date (YTD) inflows to $42 billion.

Supply (YTD supply of $257 billion; up 17% YoY): The muni market recorded $20 billion of new-issue supply last week, the highest level of the year. YTD new-issue supply of $257 billion is 17% higher than the prior record-issuance year, with tax-exempt issuance up 19% year-over-year (YoY) and taxable issuance up 2%. This week’s calendar is expected to remain elevated at $16 billion. Largest deals include $1.2 billion Black Belt Energy and $983 million Commonwealth of Massachusetts transactions.

This Week in Munis: Strong State and Local Hiring

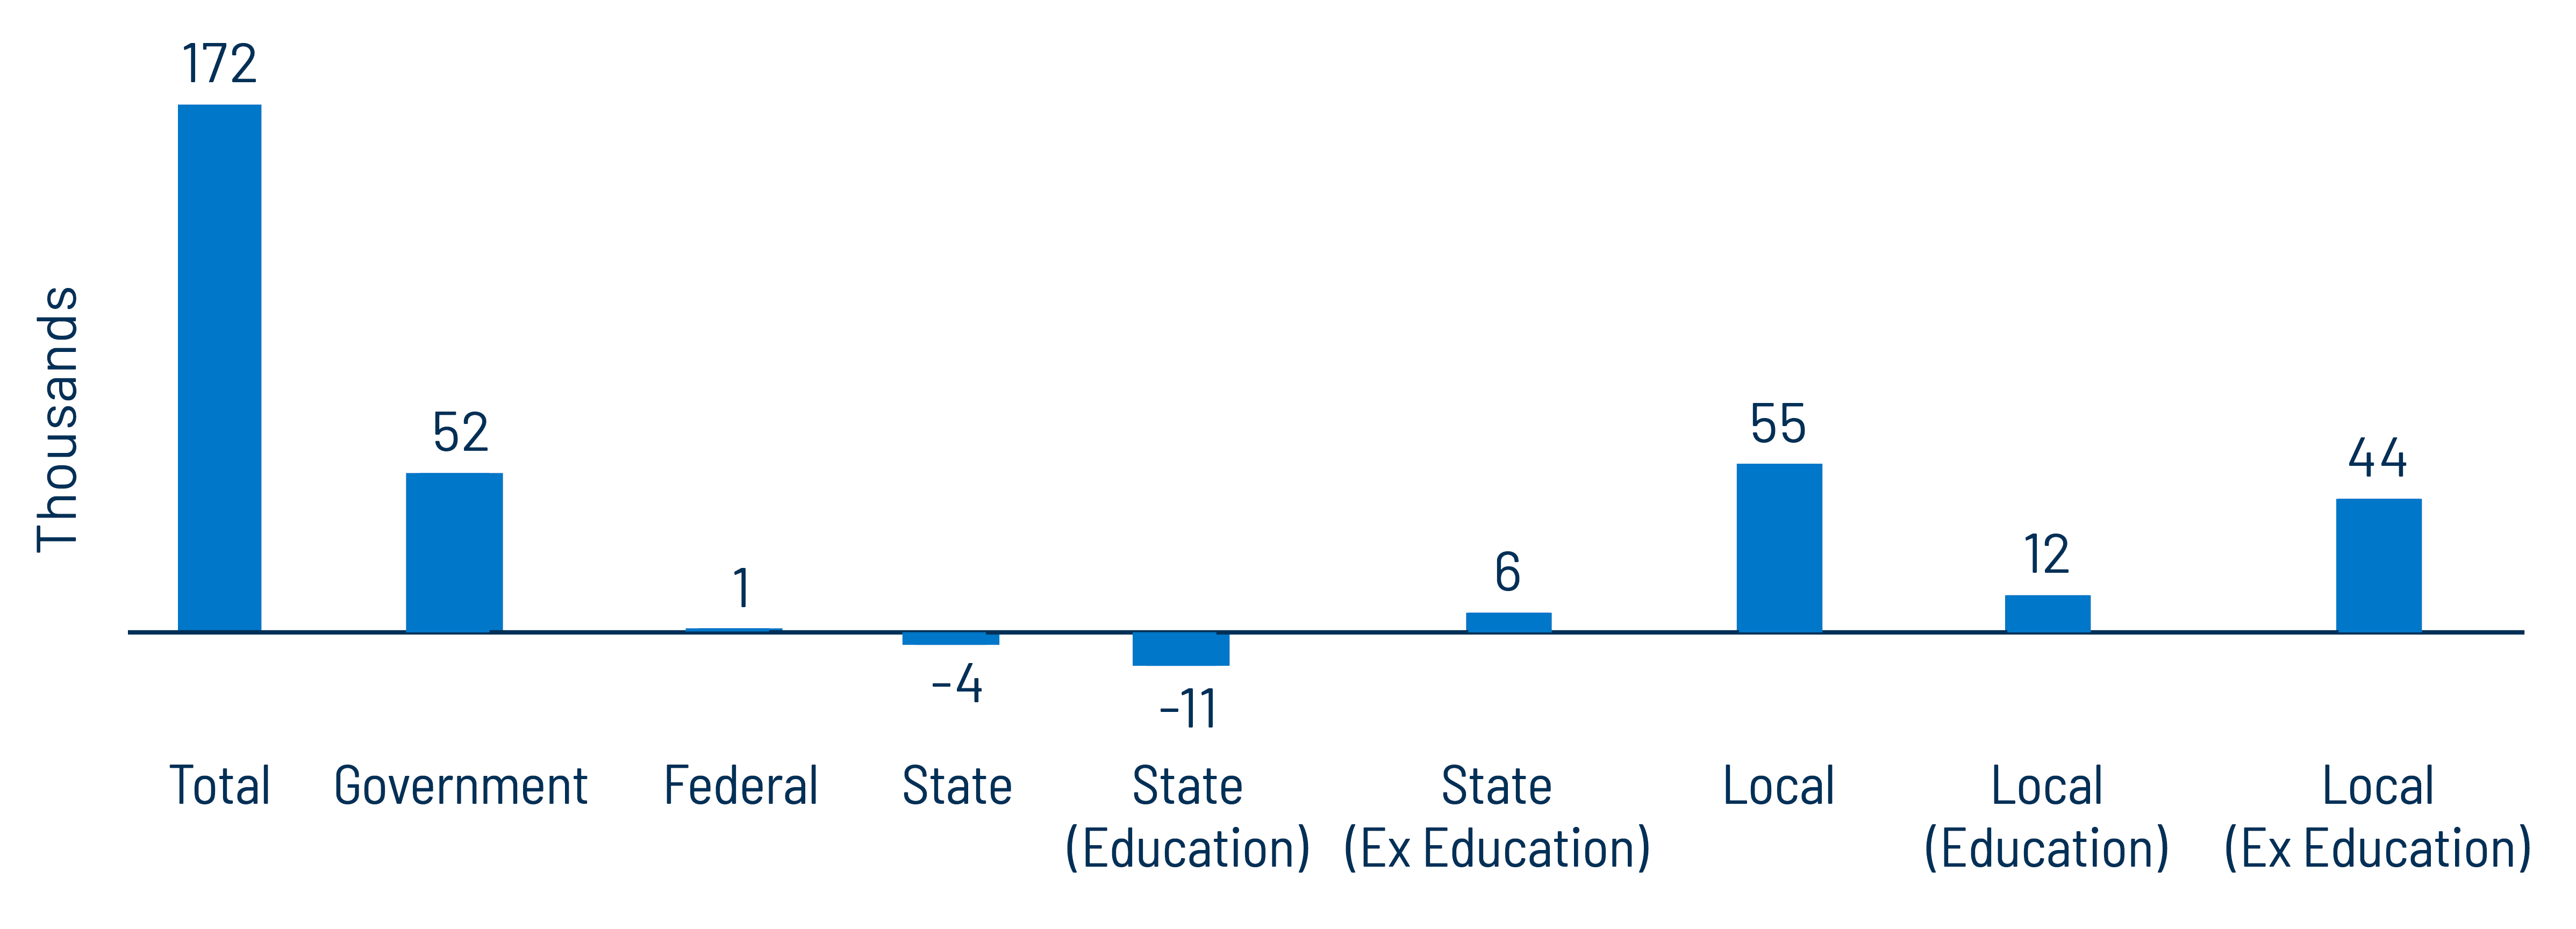
On Friday, the Bureau of Labor Statistics (BLS) reported that US employers added 172,000 jobs in May, well above consensus expectations of 85,000, while March and April payrolls were revised upward by a combined 93,000. Municipal employment was a notable contributor to the May gain in payrolls, led by local government hiring, which added 55,000 jobs. Within the local job growth, local non-education employment contributed 44,000 jobs, while local education added 12,000 jobs.

Exhibit 1: May Public Sector Job Creations
May Public Sector Job Creations
Source: BLS, Bloomberg, Western Asset. As of 05 Jun 26. Select the image to expand the view.

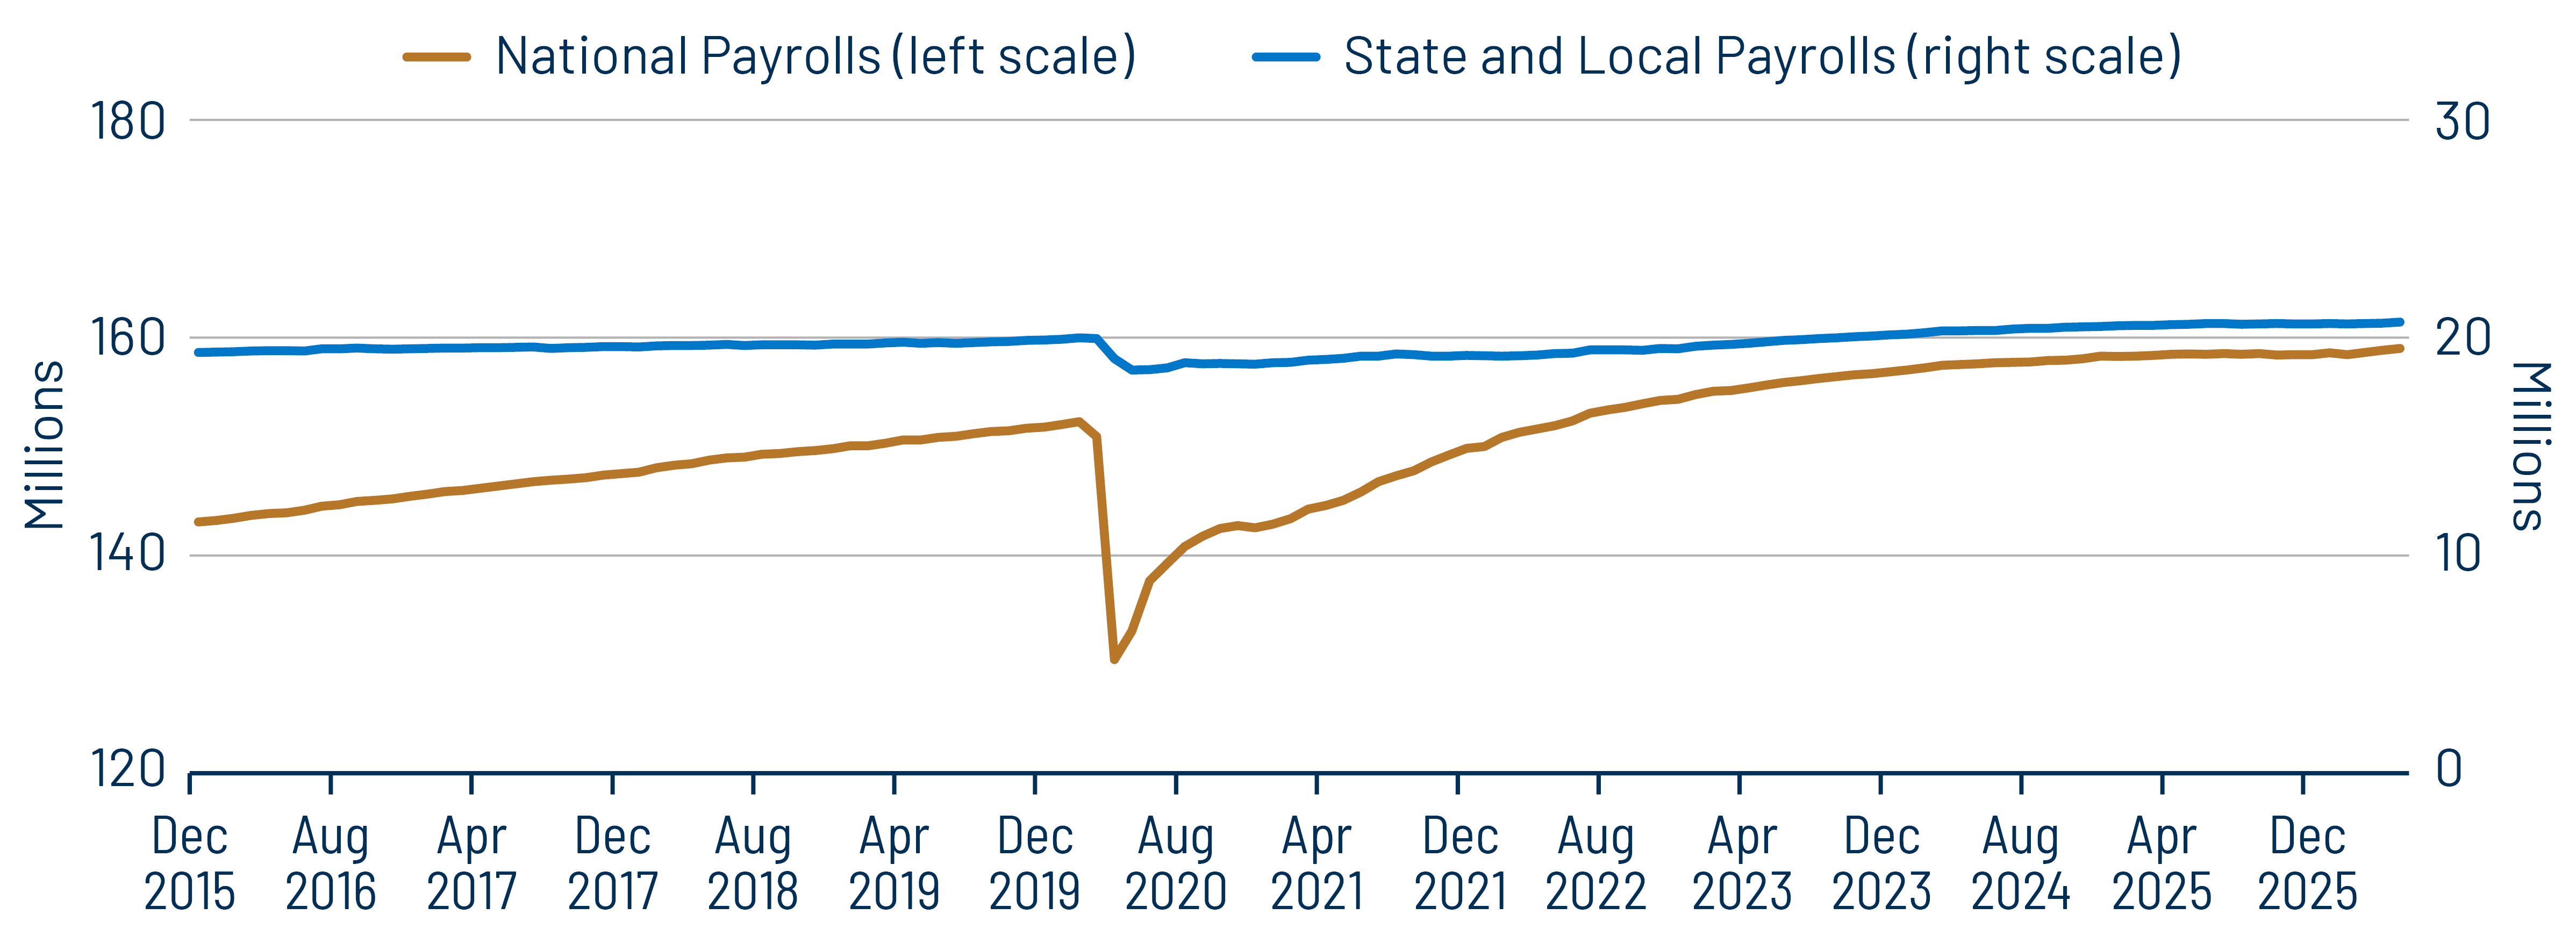
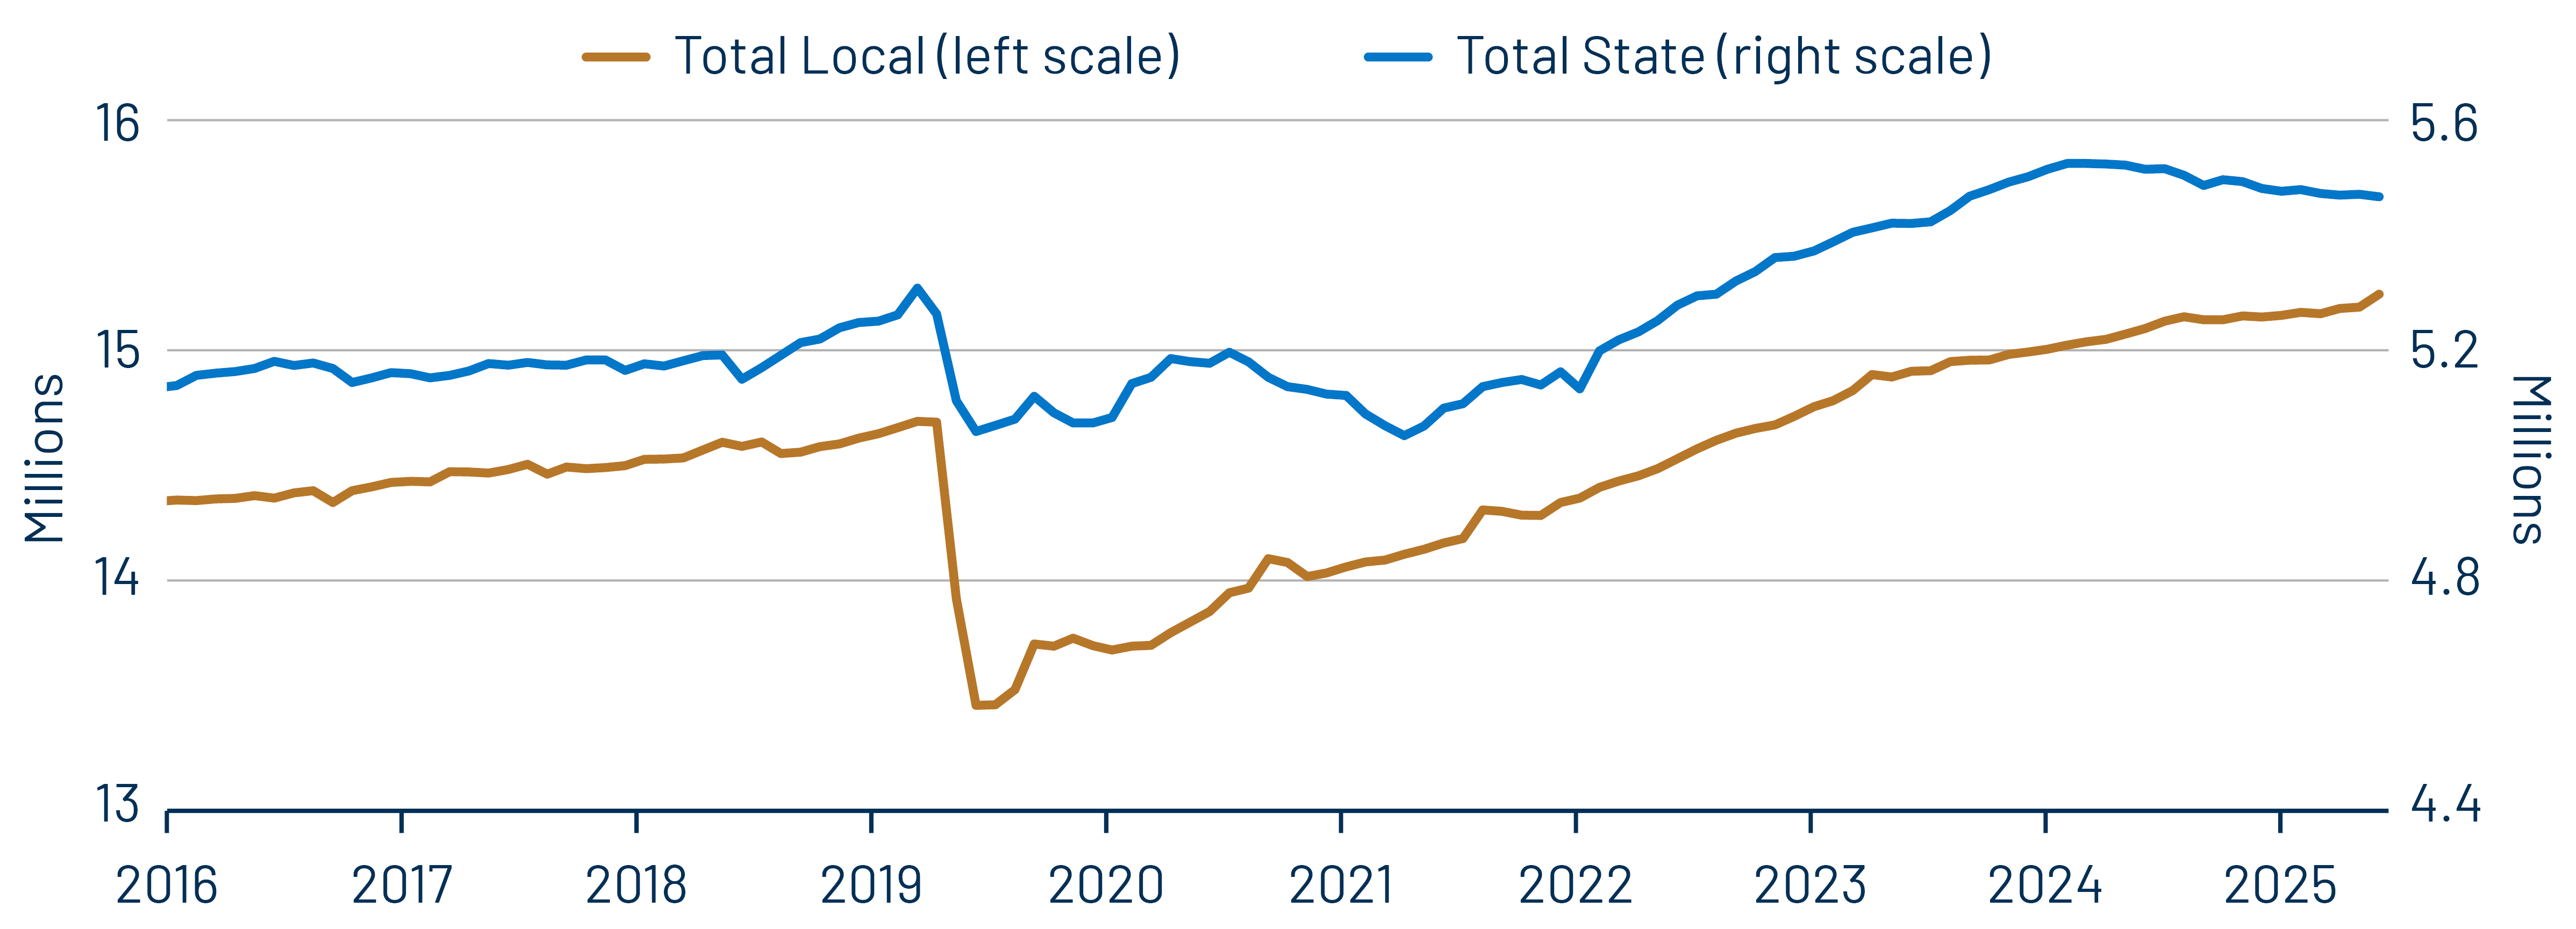
State and local employment was less affected by the pandemic compared with national employment trends, with peak employment drawdowns of 7% versus a 14% drop in total employment in 2020. Since the peak drawdowns, state and local government employment recovered more gradually, rising 9% from its lows to 20.7 million jobs, compared with a 22% rebound in total employment. State and local payrolls now stand 3.6% above pre-pandemic highs, versus 4.4% for national employment. Notably, while local employment has continued to rise throughout the recovery, including last week’s strong jobs report, state employment has steadily declined since 2024, largely driven by declines in state education.

Exhibit 2: National vs. State and Local Payrolls
National vs. State and Local Payrolls
Source: BLS, Bloomberg, Western Asset. As of 05 Jun 26. Select the image to expand the view.
Exhibit 3: State vs Local Employment
State vs Local Employment
Source: BLS, Bloomberg, Western Asset. As of 05 Jun 26. Select the image to expand the view.

We expect strong US employment to support municipal tax collections and credit conditions. While local government job growth in May stands out, the longer-term trend in state and local employment has been more gradual and has lagged the broader national recovery. If the Fed were to reverse course on its recent rate-cutting cycle in response to stronger economic data, a higher-for-longer rate environment could support longer-term returns while potential episodic volatility could create opportunities for active managers to deliver attractive after-tax outcomes.

Municipal Credit Curves and Relative Value

Exhibit 4: Muni Credit Curves
Muni Credit Curves
Source: Bloomberg, Western Asset. As of 05 Jun 26. Bloomberg Valuation Service (BVAL) Municipal Credit Indices (AAA, AA, A, BBB, respectively) and US Sovereign Curves. Taxable-Equivalent Muni Credit Curves consider the top marginal effective tax rate of 40.8%. AA Muni is represented by the US General Obligation AA Muni BVAL Yield Curve. The BVAL curve is populated with pricing from uninsured AA General Obligation bonds. A Muni is represented by the US General Obligation A Muni BVAL Yield Curve. The BVAL curve is populated with pricing from uninsured A General Obligation bonds. BBB Muni is represented by the US General Obligation BBB Muni BVAL Yield Curve. The BVAL curve is populated with pricing from uninsured BBB General Obligation bonds. Indices are unmanaged and one cannot directly invest in them. They do not include fees, expenses or sales charges. Past performance is not an indicator or a guarantee of future results. Select the image to expand the view.
Exhibit 5: Taxable-Equivalent Muni Credit Curves
Taxable-Equivalent Muni Credit Curves
Source: Bloomberg, Western Asset. As of 05 Jun 26. Bloomberg Valuation Service (BVAL) Municipal Credit Indices (AAA, AA, A, BBB, respectively) and US Sovereign Curves. Taxable-Equivalent Muni Credit Curves consider the top marginal effective tax rate of 40.8%. AA Muni is represented by the US General Obligation AA Muni BVAL Yield Curve. The BVAL curve is populated with pricing from uninsured AA General Obligation bonds. A Muni is represented by the US General Obligation A Muni BVAL Yield Curve. The BVAL curve is populated with pricing from uninsured A General Obligation bonds. BBB Muni is represented by the US General Obligation BBB Muni BVAL Yield Curve. The BVAL curve is populated with pricing from uninsured BBB General Obligation bonds. Indices are unmanaged and one cannot directly invest in them. They do not include fees, expenses or sales charges. Past performance is not an indicator or a guarantee of future results. Select the image to expand the view.
Exhibit 6: AAA Munis vs. Treasuries
AAA Munis vs. Treasuries
Source: Muni Yields: Thomson Reuters MMD, Treasury Yields: Bloomberg. As of 05 Jun 26. Past performance is not a guarantee of future results. It is not possible to invest directly in an index. Select the image to expand the view.
Exhibit 7: Tax-Exempt and Taxable Muni Valuations
Tax-Exempt and Taxable Muni Valuations
Source: Bloomberg, Western Asset. As of 05 Jun 26. Yield-to-worst (YTW) is the lowest potential yield that can be received on a bond without the issuer actually defaulting. AAA, AA, A, BBB Corporate Indices; After-Tax Yield assumes a top effective tax rate of 40.8%. Taxable Muni Index Corporate comparable used is the Global Corporate Aggregate (ex. BBB) to better align credit quality and duration. Select the image to expand the view.

Western Asset Key Themes for Muni Investors

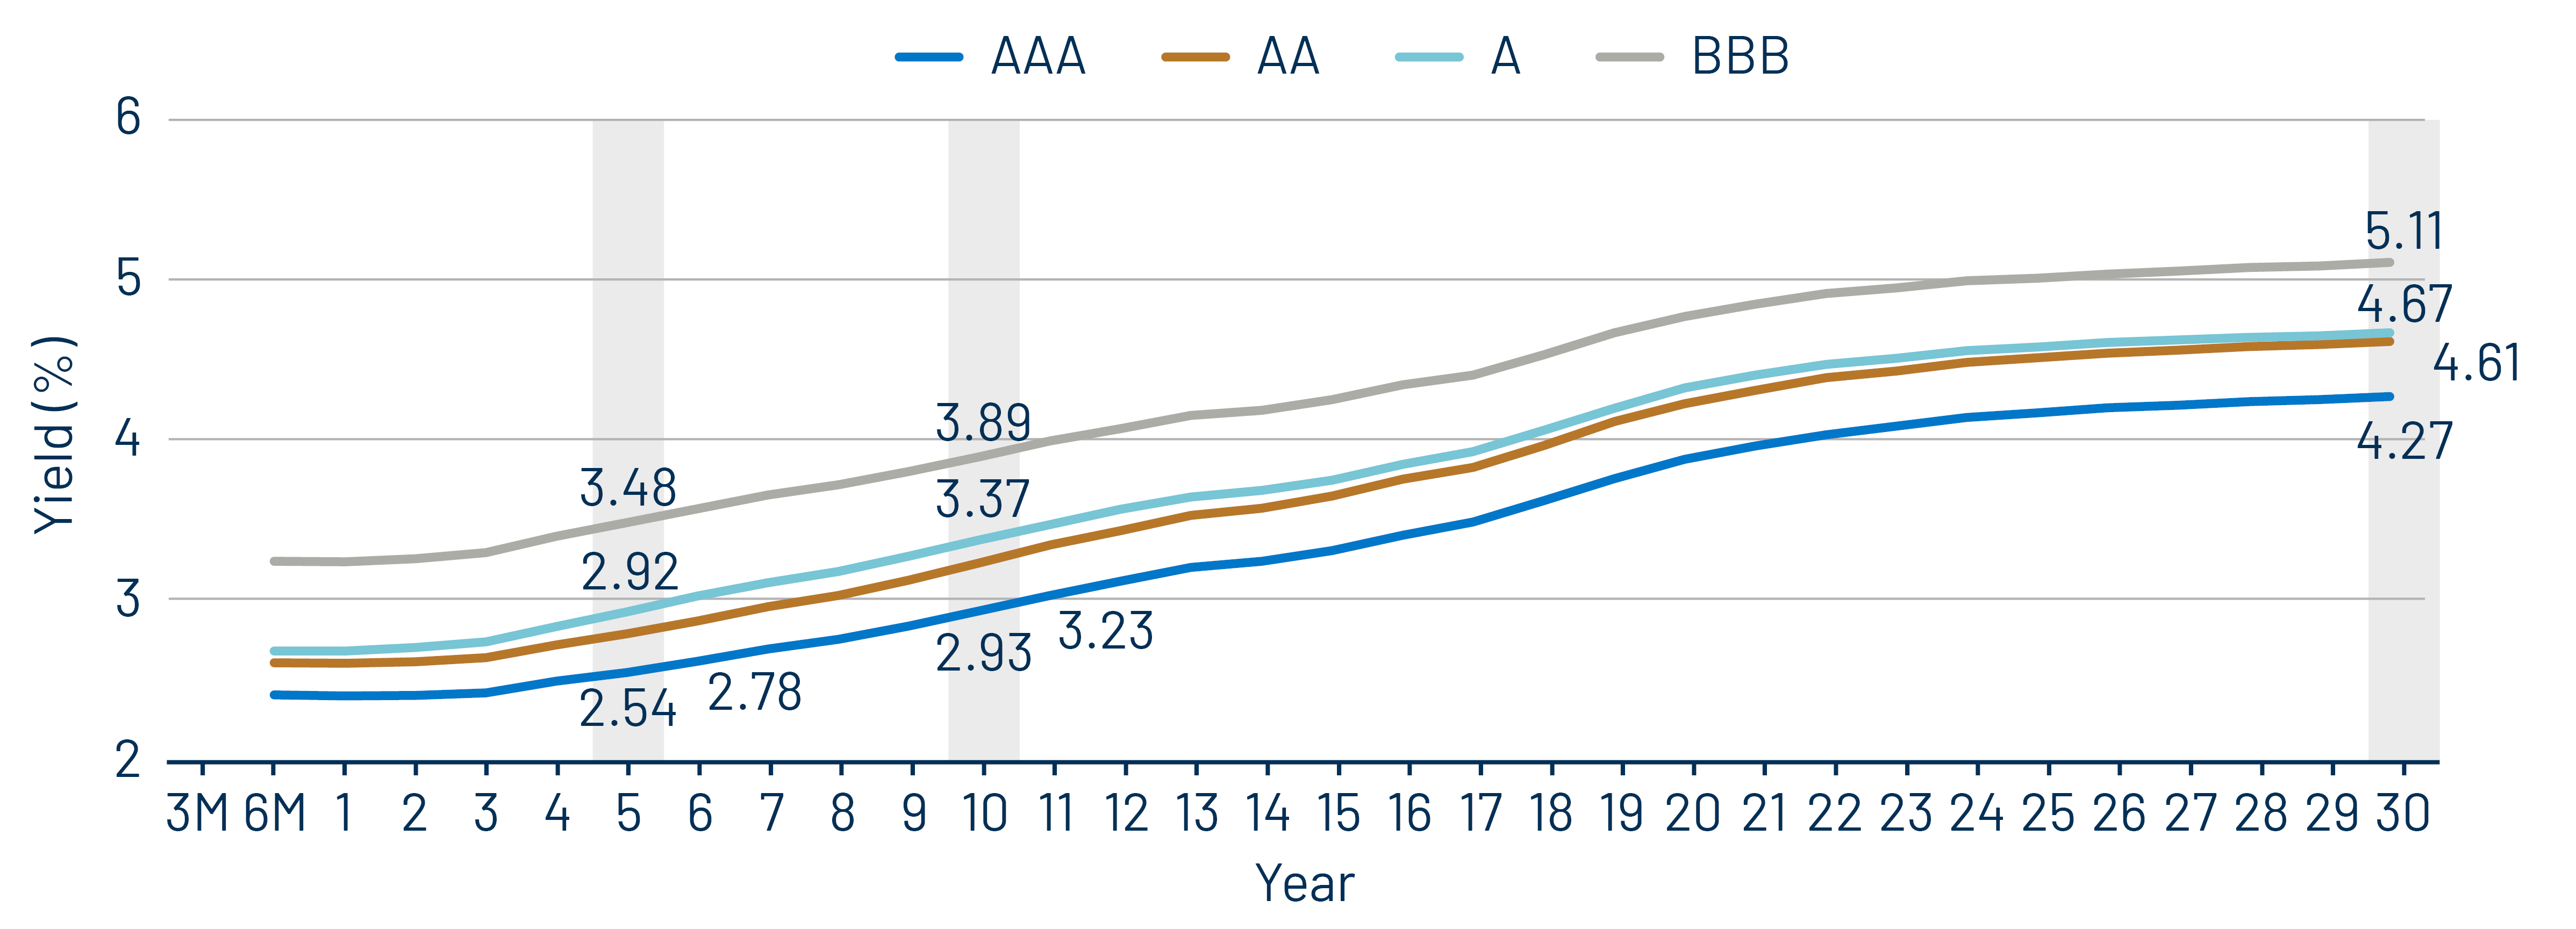
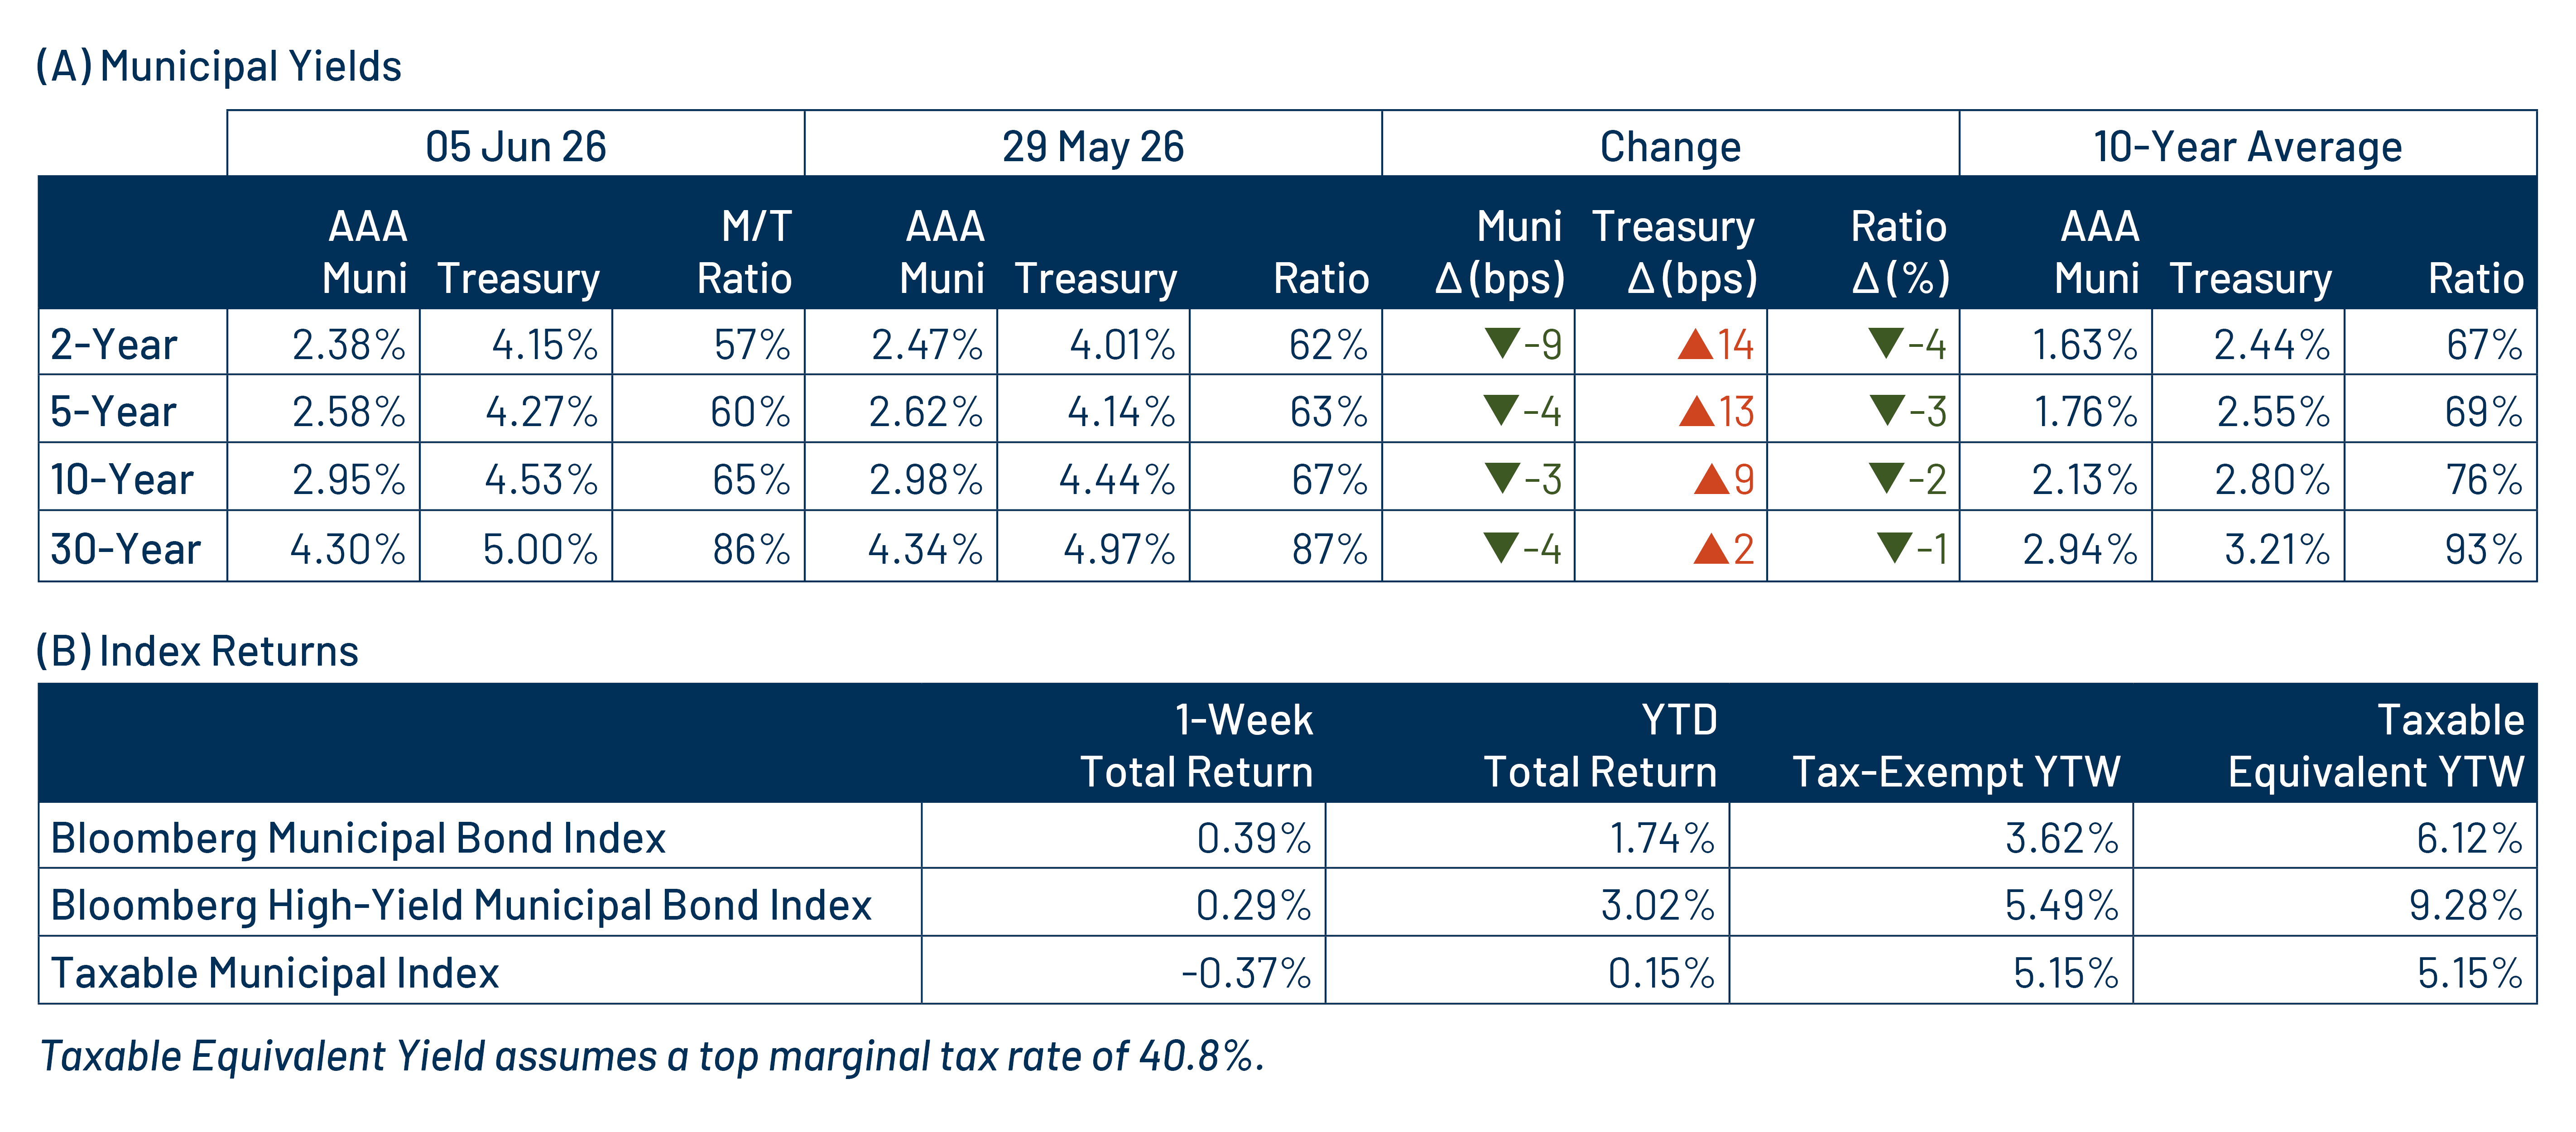
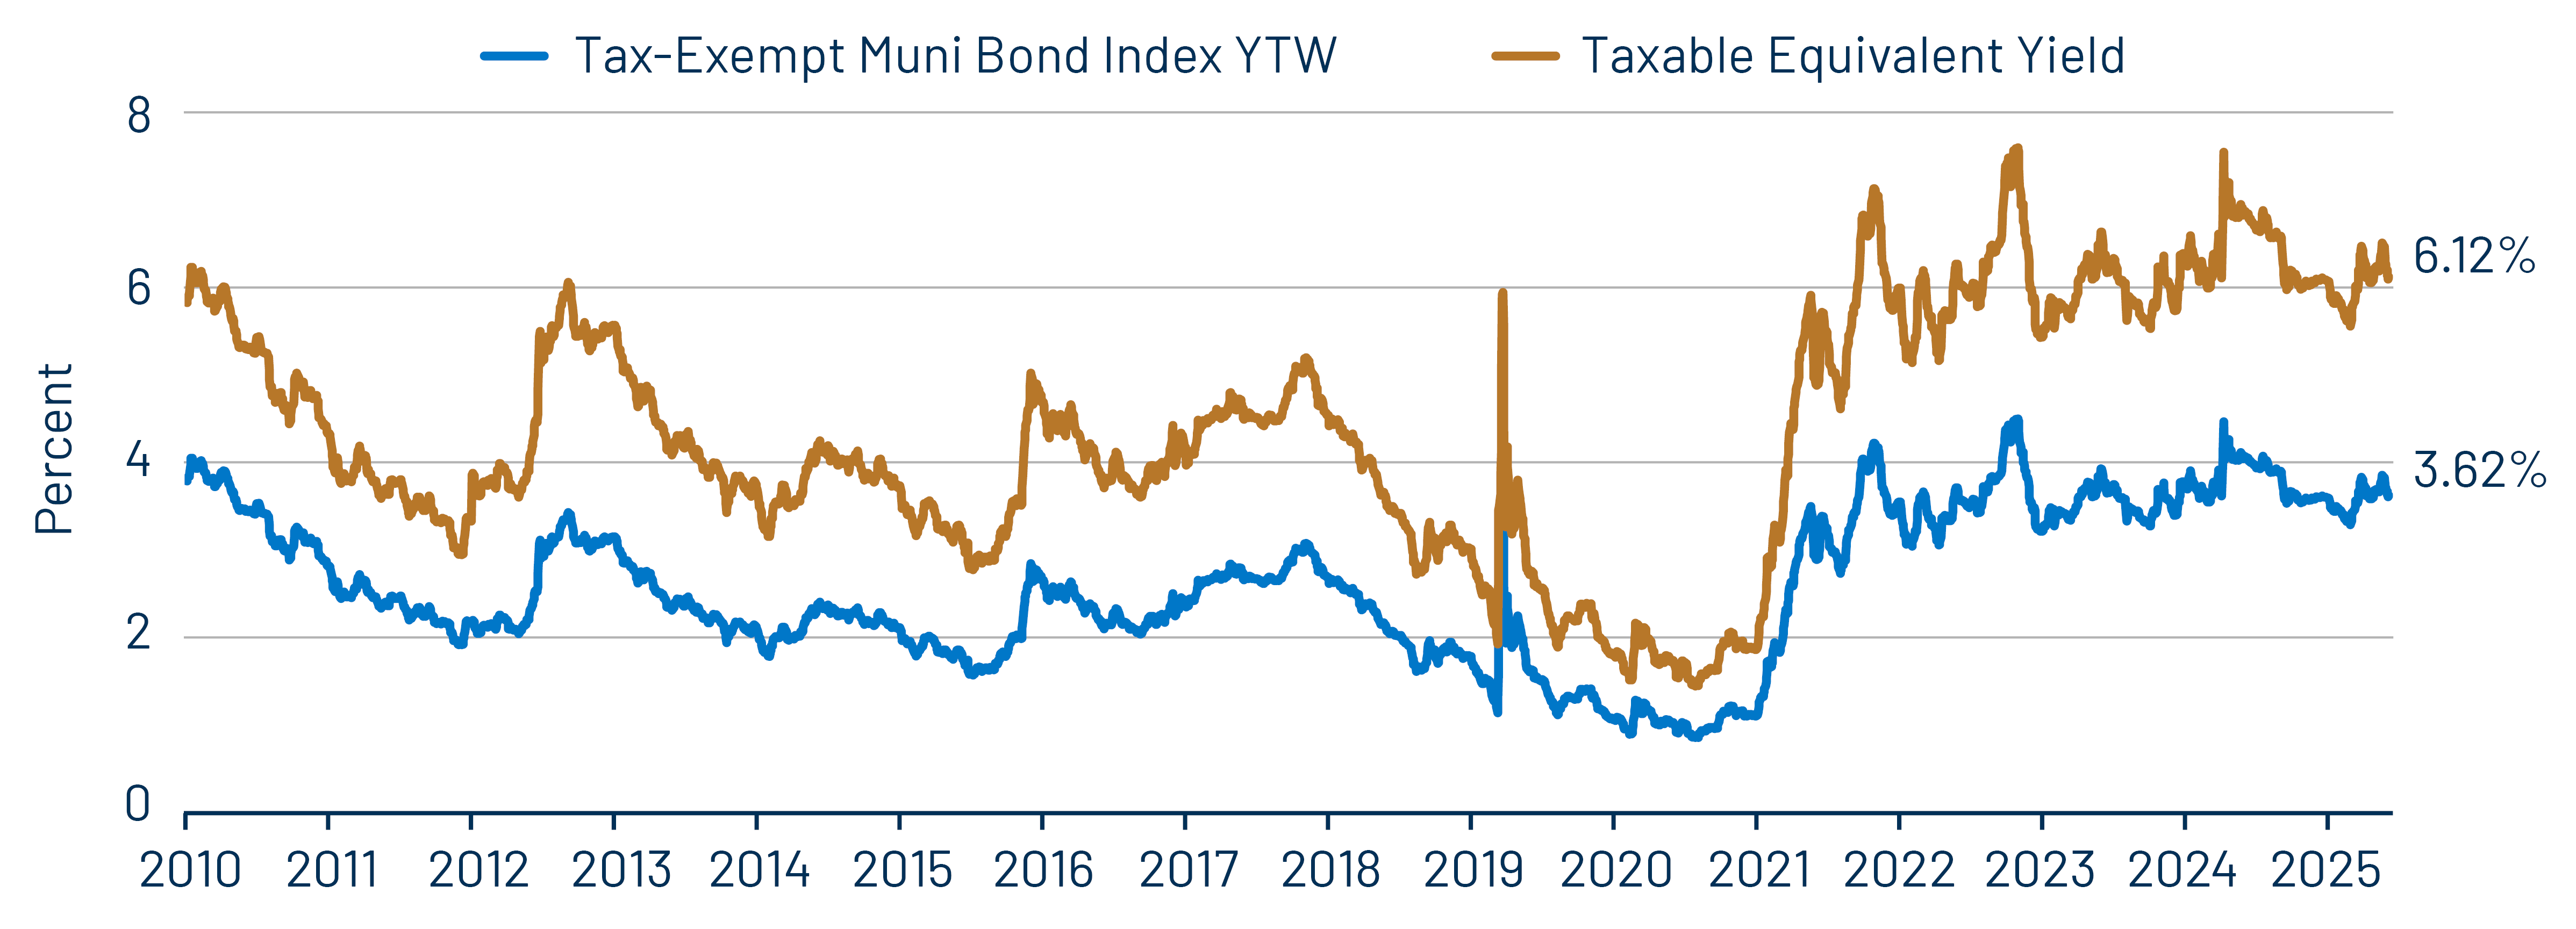
Theme 1: Municipal taxable-equivalent yields moved lower from recent highs, but remain above historical averages.

Exhibit 8: Muni and Taxable-Equivalent Muni Yield-to-Worst
Muni and Taxable-Equivalent Muni Yield-to-Worst
Source: Bloomberg, Western Asset. As of 05 Jun 26. Bloomberg Municipal Bond Index yield considering highest marginal tax rate of 40.8%. Indexes are unmanaged and one cannot directly invest in them. They do not include fees, expenses or sales charges. Past performance is not an indicator or a guarantee of future results. Select the image to expand the view.

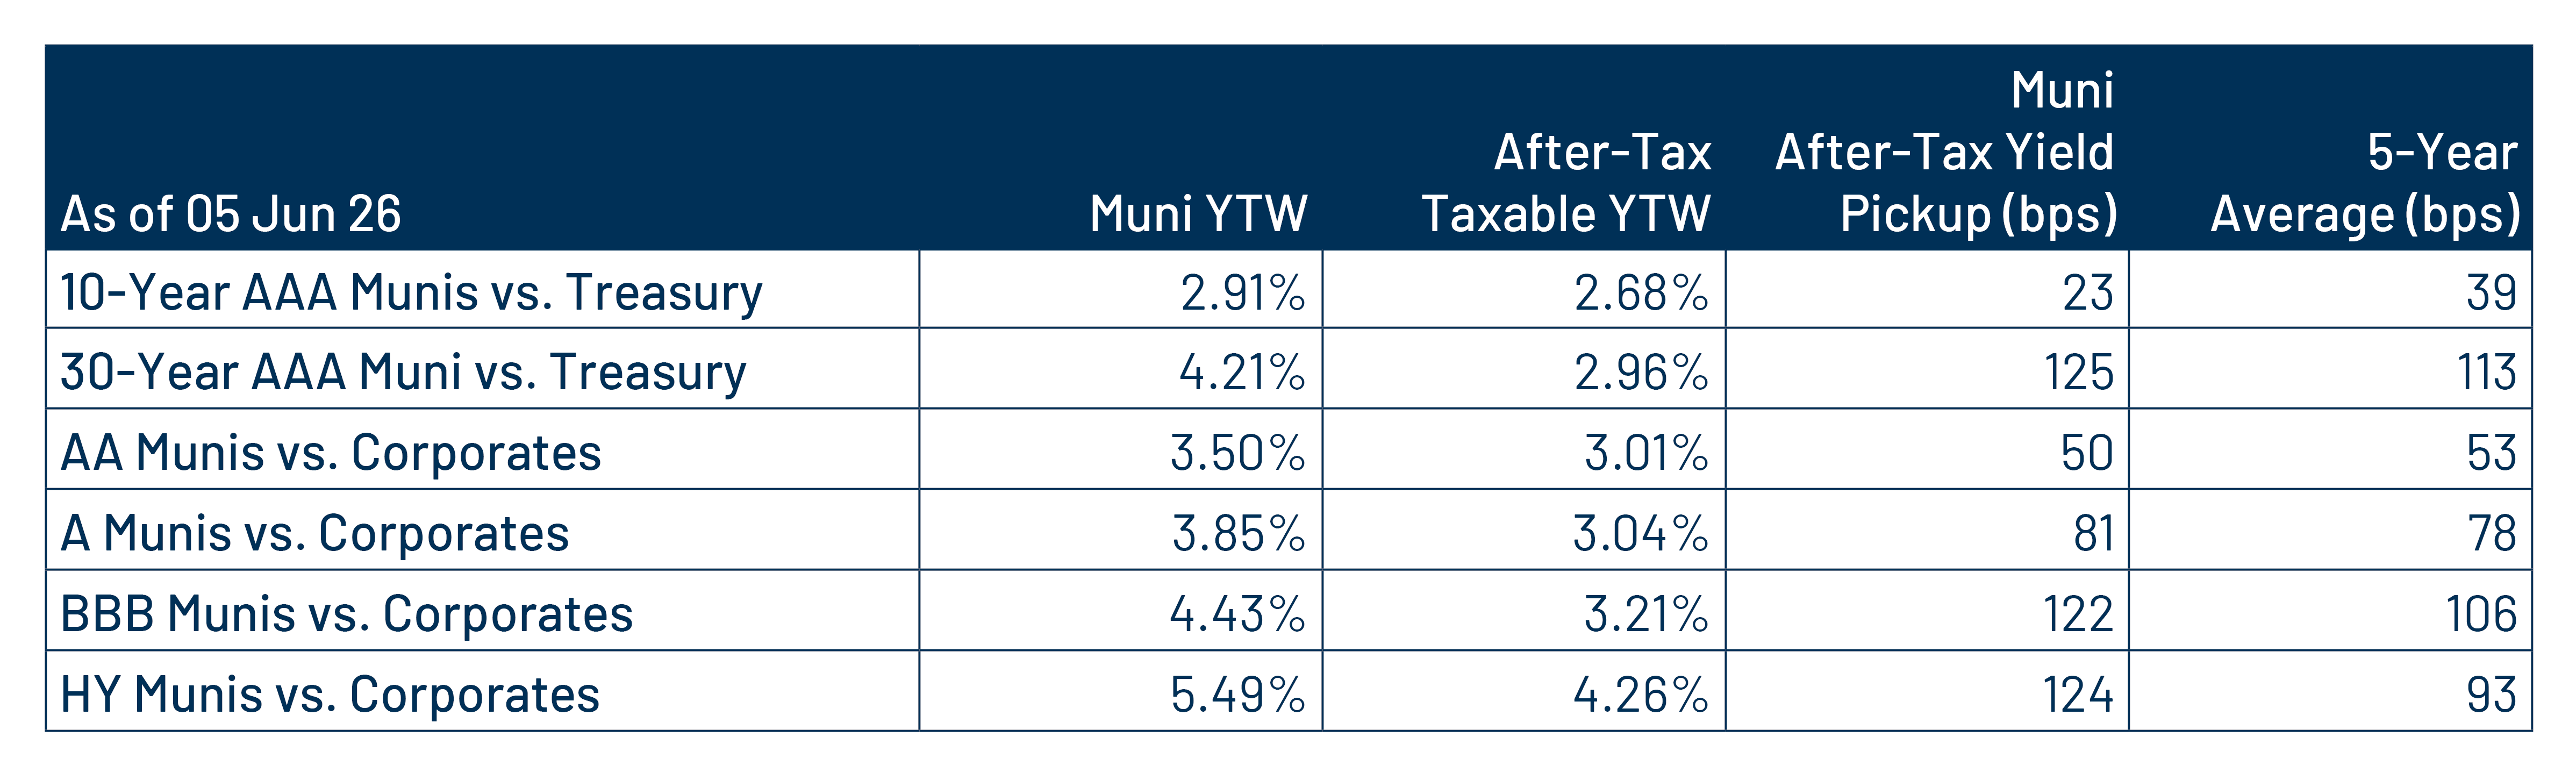
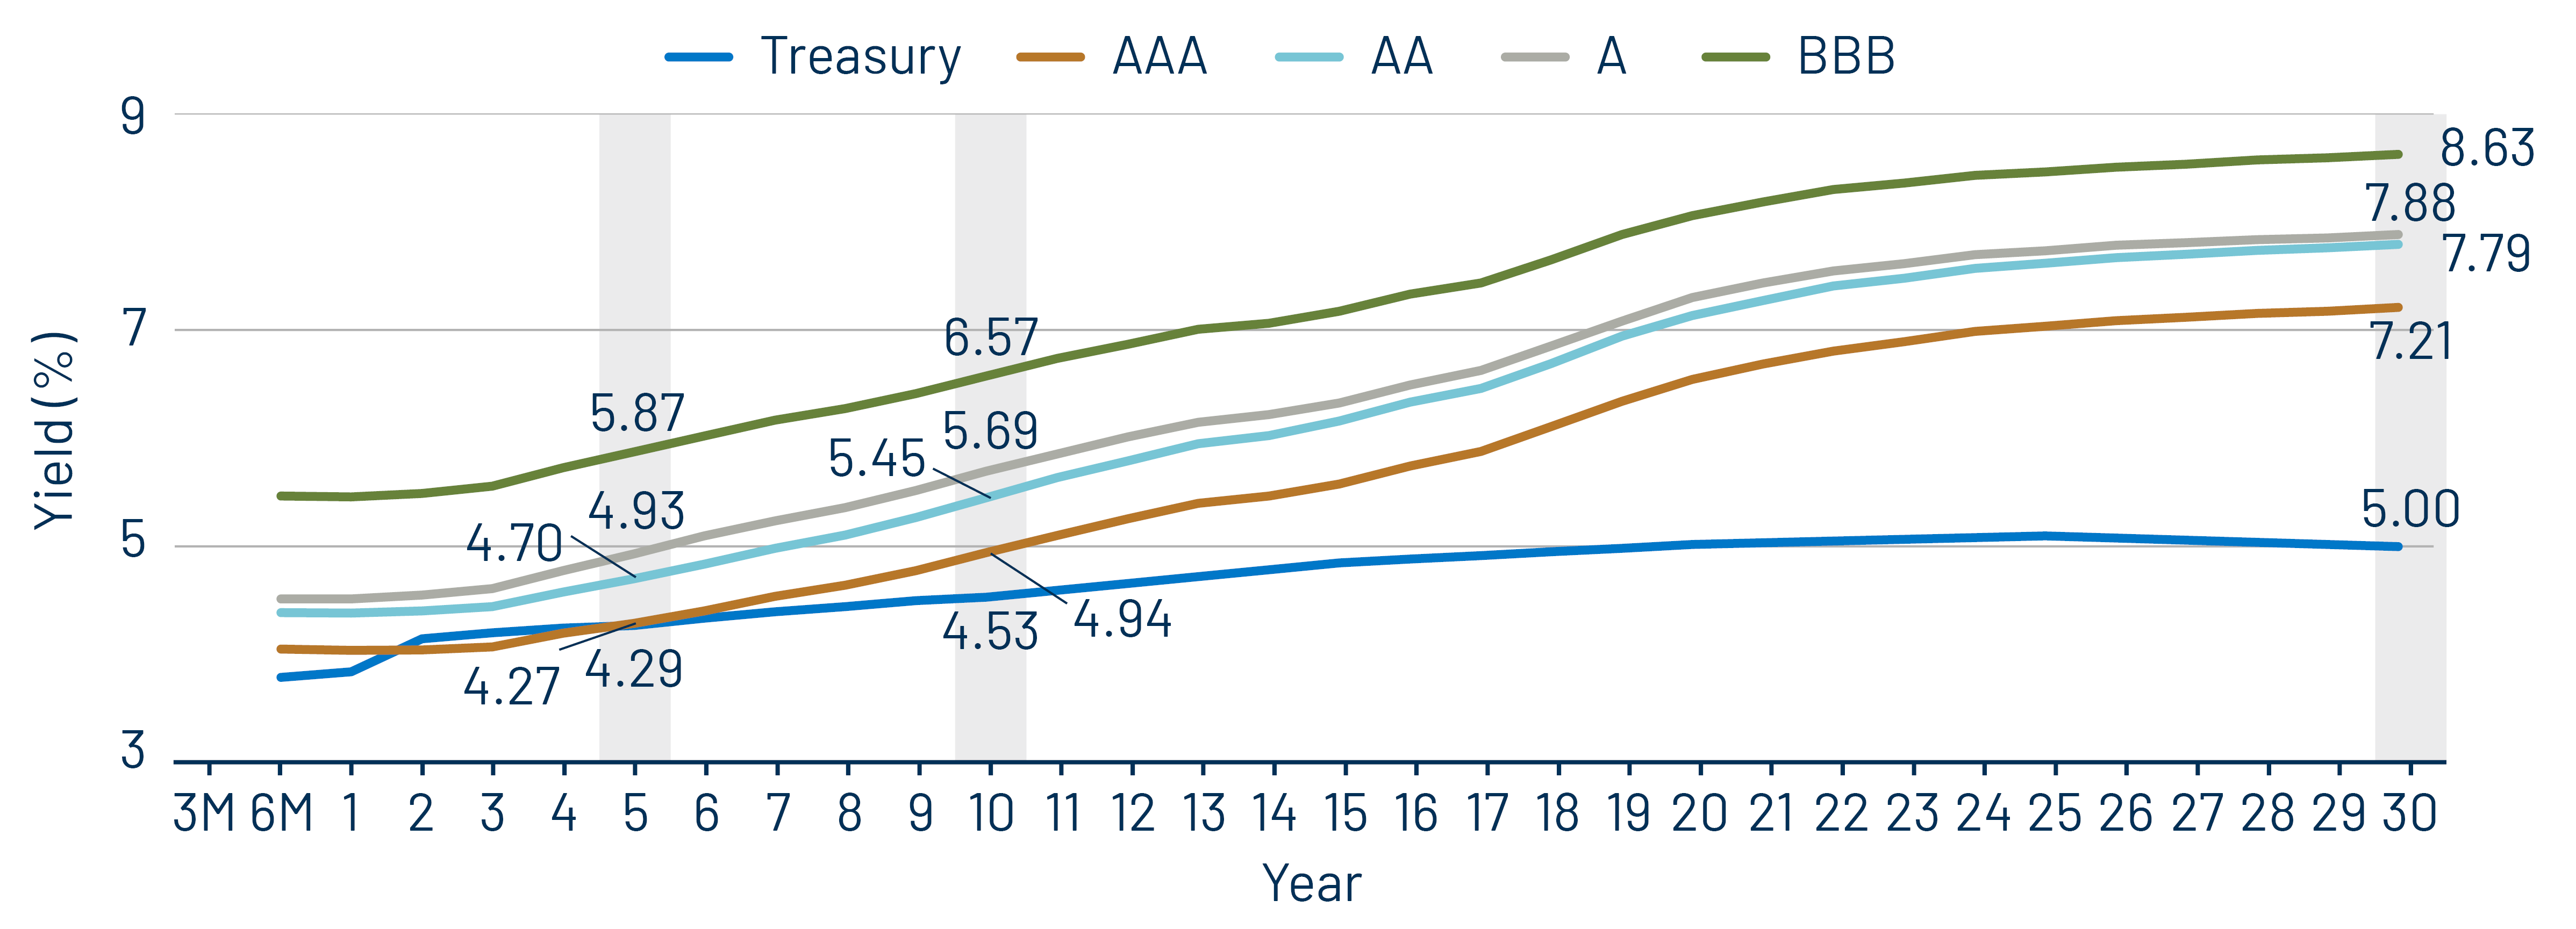
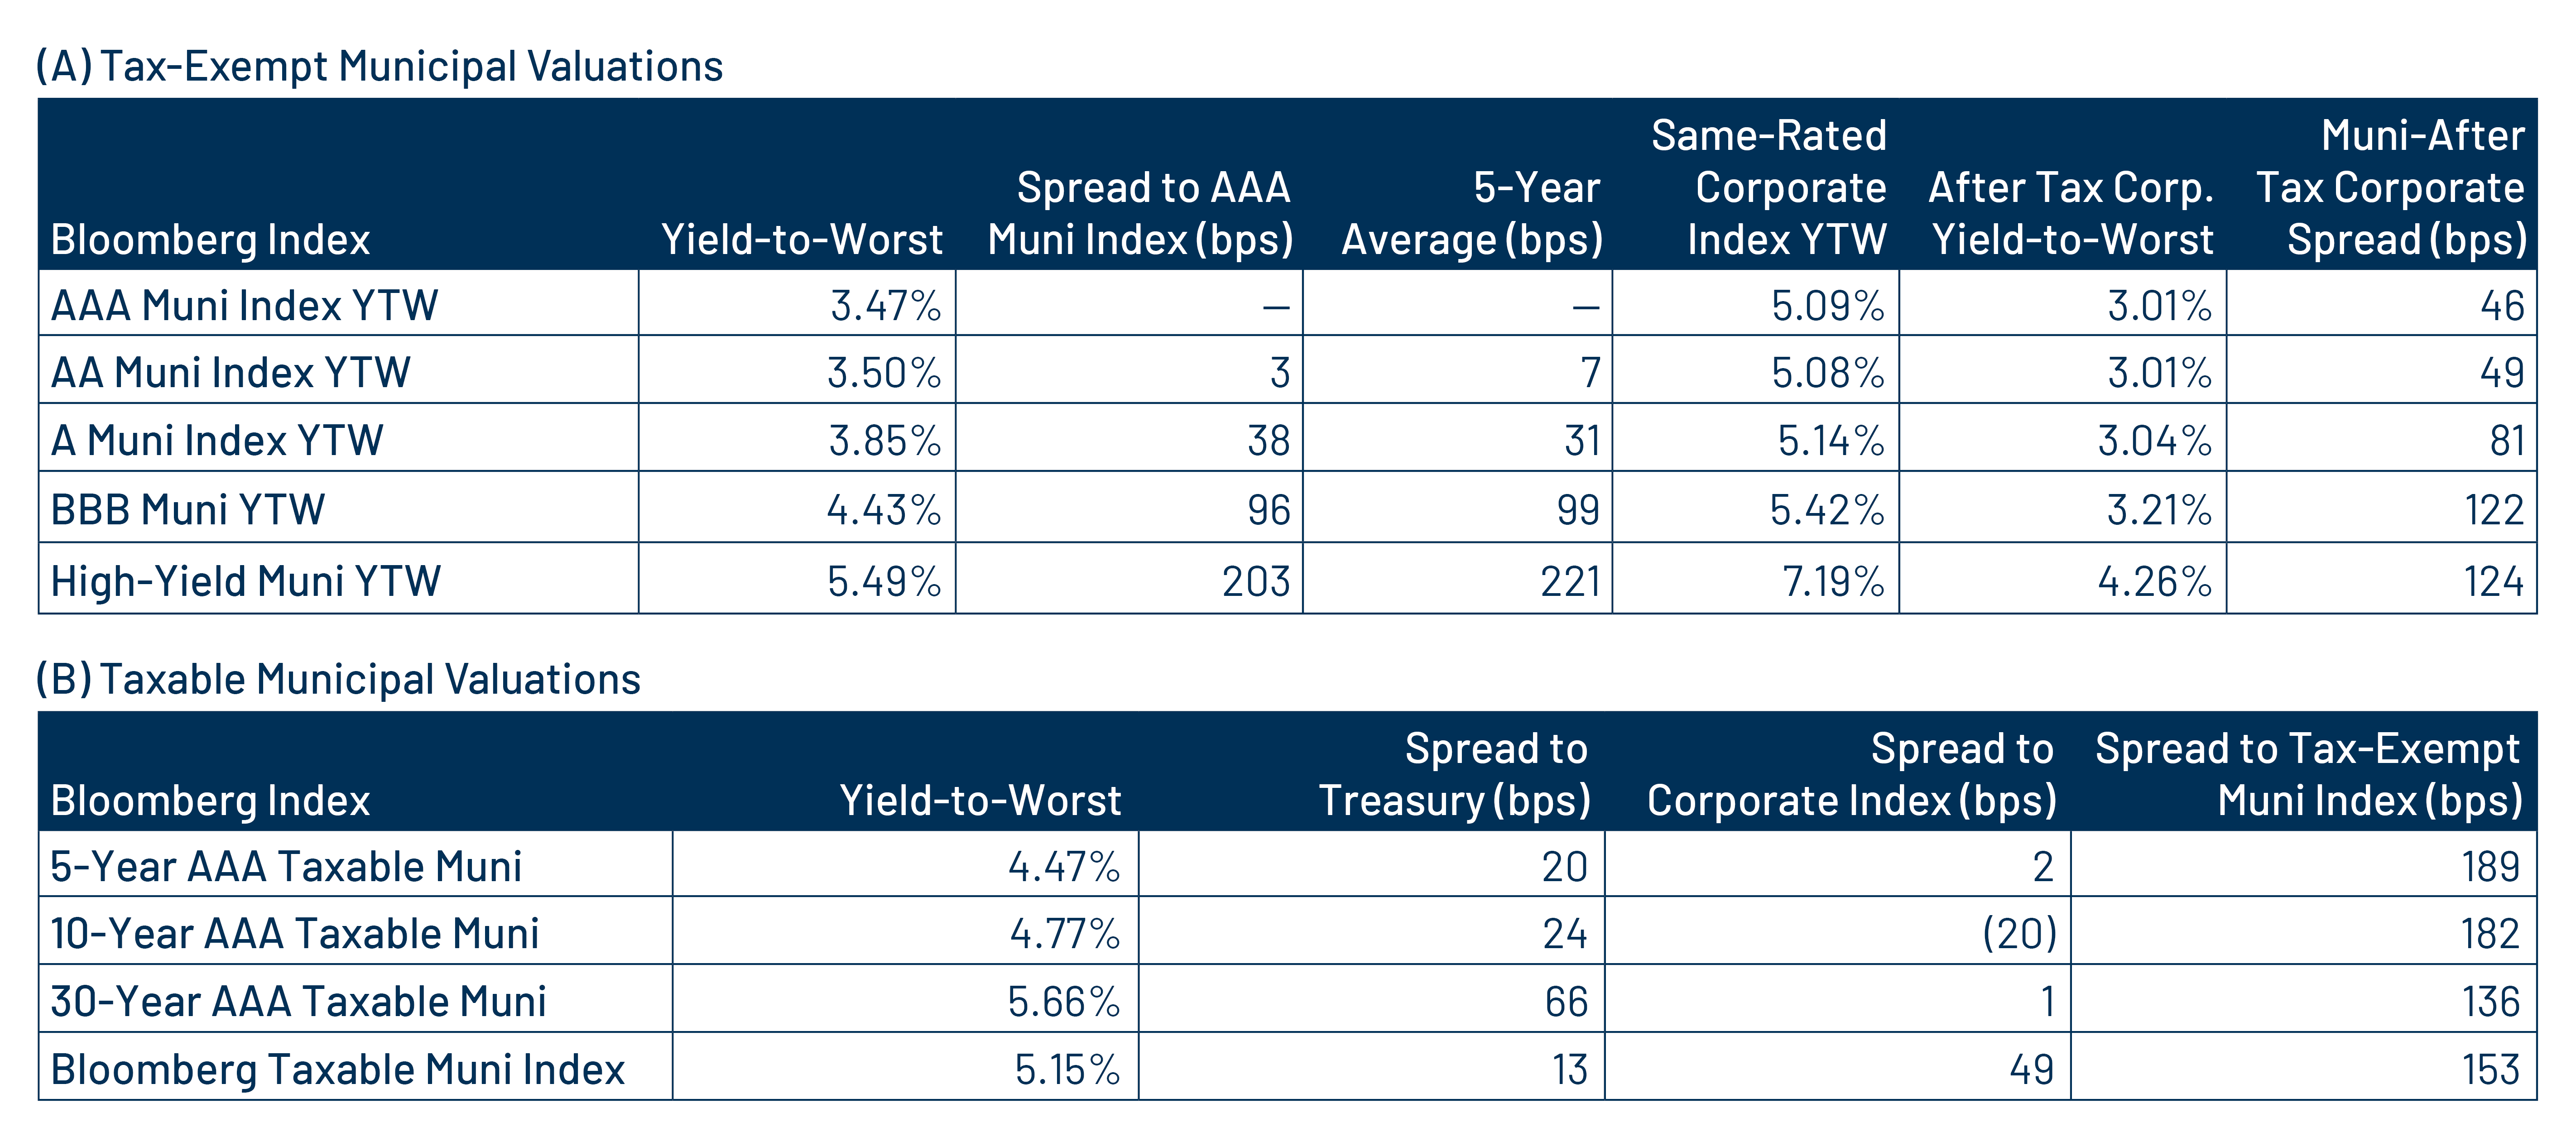
Theme 2: Munis offer attractive after-tax yield pickup vs. longer-duration and lower-quality taxable alternatives.

Exhibit 9: AAA Municipal vs. Treasury Yield Curves
AAA Municipal vs. Treasury Yield Curves
Source: Bloomberg, Western Asset. As of 05 Jun 26. Bloomberg Valuation Service (BVAL) AAA Muni Curve and US On-/Off-the-Run Sovereign Curve. Indexes are unmanaged and one cannot directly invest in them. They do not include fees, expenses or sales charges. Past performance is not an indicator or a guarantee of future results. Select the image to expand the view.

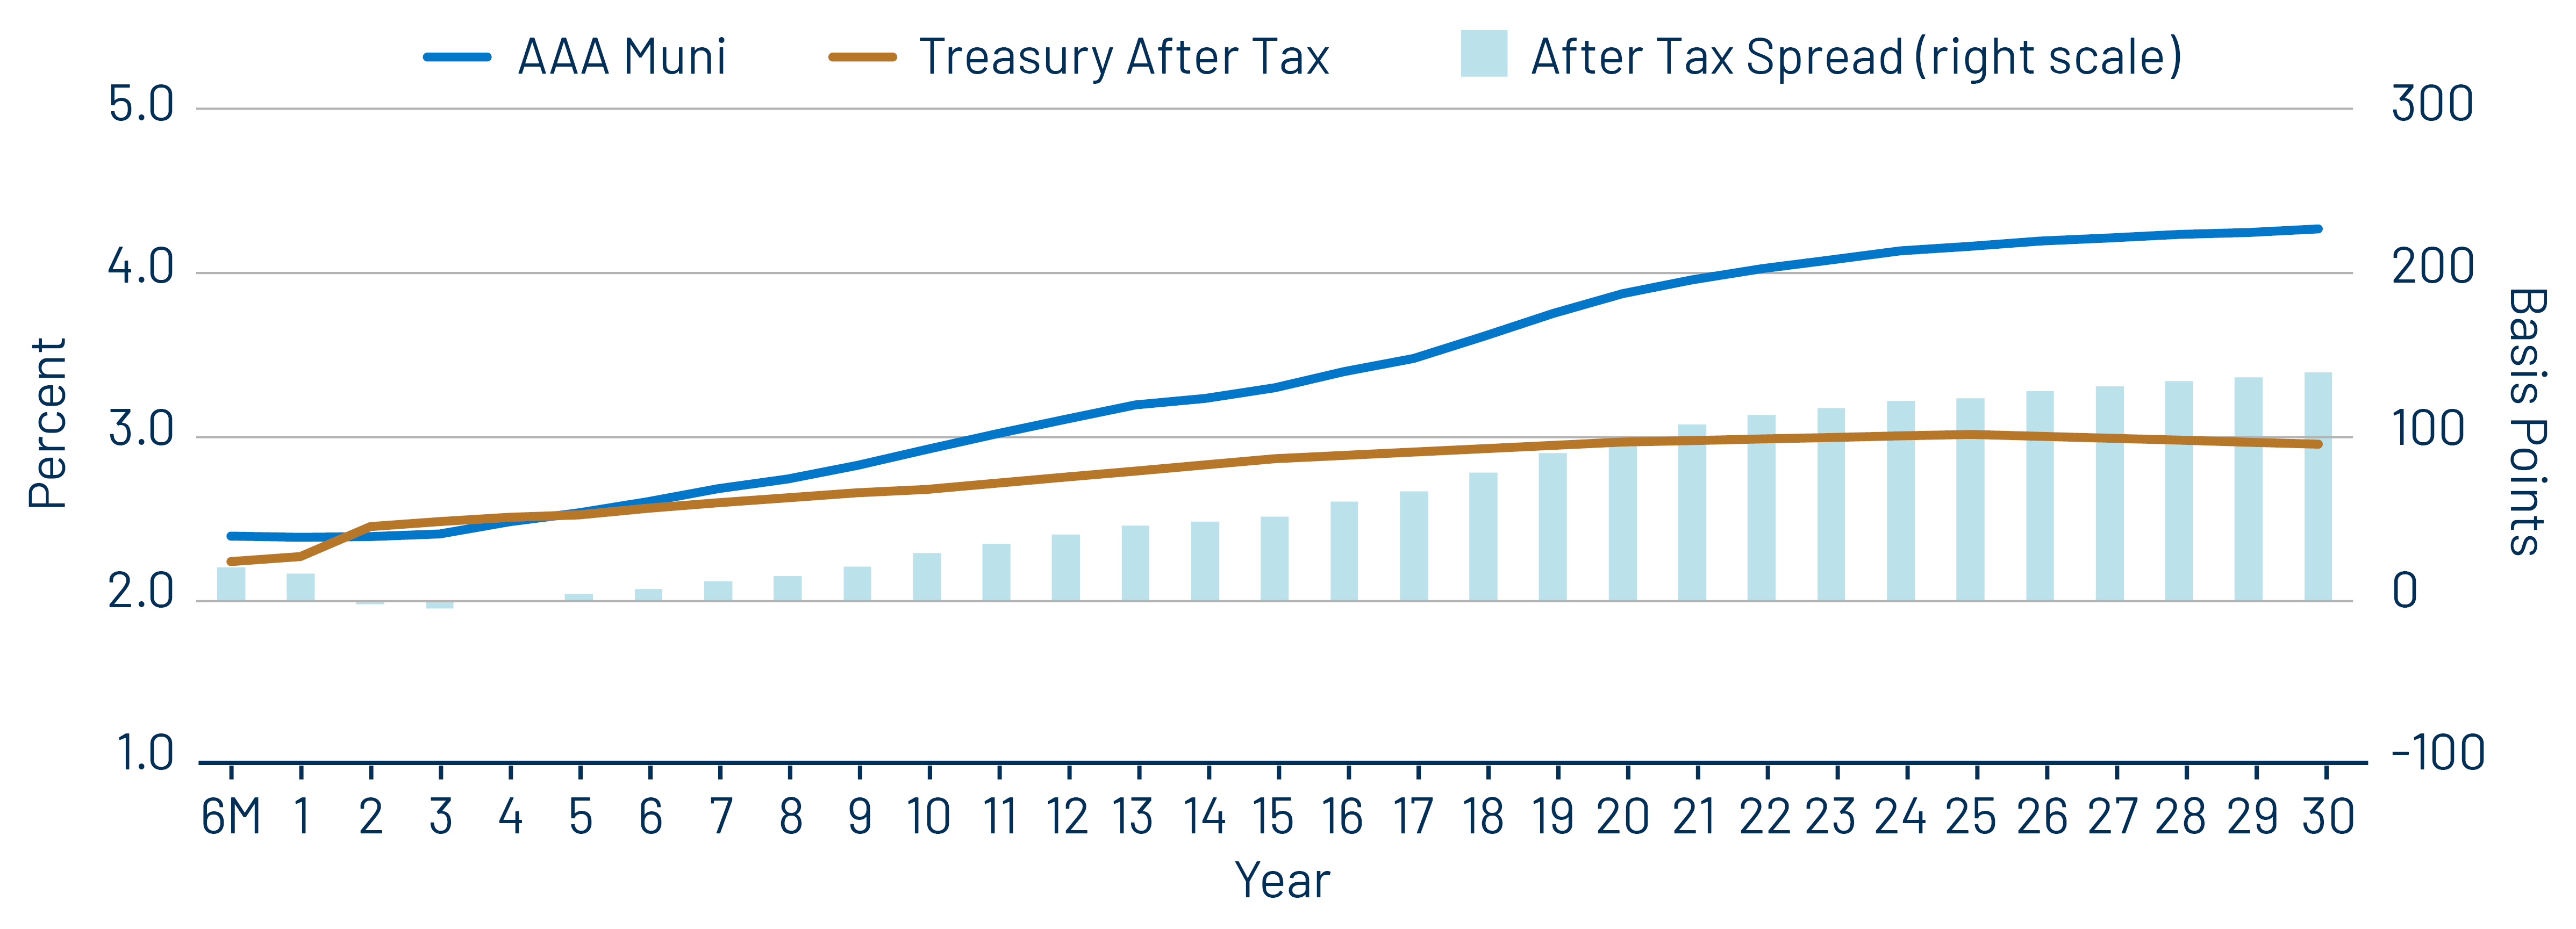
Theme 3: The muni curve remains steep and offers relative value in longer maturities.

Exhibit 10: Municipal vs. Taxable Fixed-Income Yields by Quality
Municipal vs. Taxable Fixed-Income Yields by Quality
Source: Western Asset, Bloomberg. As of 05 Jun 26. 10- and 30-Year comparison reflects Bloomberg Valuation Service (BVAL) AAA Muni Curve and US On-/Off-the-Run Sovereign Curve. AA Muni reflects the Bloomberg AA Muni Bond Index. A Muni reflects the Bloomberg A Muni Bond Index. BBB Muni reflects the Bloomberg BBB Muni Bond Index. HY Muni reflects the Bloomberg High Yield Muni Bond Index. AA Corp reflects the Bloomberg AA Corporate Bond Index. A Corp reflects the Bloomberg A Corporate Bond Index. BBB Corp reflects the Bloomberg BBB Corporate Bond Index. After-tax yield considers the top marginal tax rate of 40.8%. Indexes are unmanaged and one cannot directly invest in them. They do not include fees, expenses or sales charges. Past performance is not an indicator or a guarantee of future results. Select the image to expand the view.

© Western Asset Management Company, LLC 2026. The information contained in these materials ("the materials") is intended for the exclusive use of the designated recipient ("the recipient"). This information is proprietary and confidential and may contain commercially sensitive information, and may not be copied, reproduced or republished, in whole or in part, without the prior written consent of Western Asset Management Company ("Western Asset").
Past performance does not predict future returns. These materials should not be deemed to be a prediction or projection of future performance. These materials are intended for investment professionals including professional clients, eligible counterparties, and qualified investors only.
For the Franklin Templeton global-non product disclosures, please click here.
These materials have been produced for illustrative and informational purposes only. These materials contain Western Asset's opinions and beliefs as of the date designated on the materials; these views are subject to change and may not reflect real-time market developments and investment views.
Third party data may be used throughout the materials, and this data is believed to be accurate to the best of Western Asset's knowledge at the time of publication, but cannot be guaranteed. These materials may also contain strategy or product awards or rankings from independent third parties or industry publications which are based on unbiased quantitative and/or qualitative information determined independently by each third party or publication. In some cases, Western Asset may subscribe to these third party's standard industry services or publications. These standard subscriptions and services are available to all asset managers and do not influence rankings or awards in any way.
Investment strategies or products discussed herein may involve a high degree of risk, including the loss of some or all capital. Investments in any products or strategies described in these materials may be volatile, and investors should have the financial ability and willingness to accept such risks.
Unless otherwise noted, investment performance contained in these materials is reflective of a strategy composite. All other strategy data and information included in these materials reflects a representative portfolio which is an account in the composite that Western Asset believes most closely reflects the current portfolio management style of the strategy. Performance is not a consideration in the selection of the representative portfolio. The characteristics of the representative portfolio shown may differ from other accounts in the composite. Information regarding the representative portfolio and the other accounts in the composite are available upon request. Statements in these materials should not be considered investment advice. References, either general or specific, to securities and/or issuers in the materials are for illustrative purposes only and are not intended to be, and should not be interpreted as, recommendation to purchase or sell such securities. Employees and/or clients of Western Asset may have a position in the securities or issuers mentioned.
These materials are not intended to provide, and should not be relied on for, accounting, legal, tax, investment or other advice. The recipient should consult its own counsel, accountant, investment, tax, and any other advisers for this advice, including economic risks and merits, related to making an investment with Western Asset. The recipient is responsible for observing the applicable laws and regulations of their country of residence.
Founded in 1971, Western Asset Management Company is a global fixed-income investment manager with offices in Pasadena, New York, London, Singapore, Tokyo, Melbourne, São Paulo, Hong Kong, and Zürich. Western Asset is a wholly owned subsidiary of Franklin Resources, Inc. but operates autonomously. Western Asset is comprised of six legal entities across the globe, each with distinct regional registrations: Western Asset Management Company, LLC, a registered Investment Adviser with the Securities and Exchange Commission; Western Asset Management Company Ltda. is regulated by Comissão de Valores Mobiliários; Western Asset Management Company Pty Ltd ABN 41 117 767 923 is the holder of the Australian Financial Services License 303160; Western Asset Management Company Pte. Ltd. Co. Reg. No. 200007692R is a holder of a Capital Markets Services License for fund management and regulated by the Monetary Authority of Singapore; Western Asset Management Company Ltd, a registered Financial Instruments Business Operator and regulated by the Financial Services Agency of Japan; and Western Asset Management Company Limited is authorised and regulated by the Financial Conduct Authority ("FCA") (FRN 145930). This communication is intended for distribution to Professional Clients only if deemed to be a financial promotion in the UK as defined by the FCA. This communication may also be intended for certain EEA countries where Western Asset has been granted permission to do so. For the current list of the approved EEA countries please contact Western Asset at +44 (0)20 7422 3000.