Macros, Markets and Munis
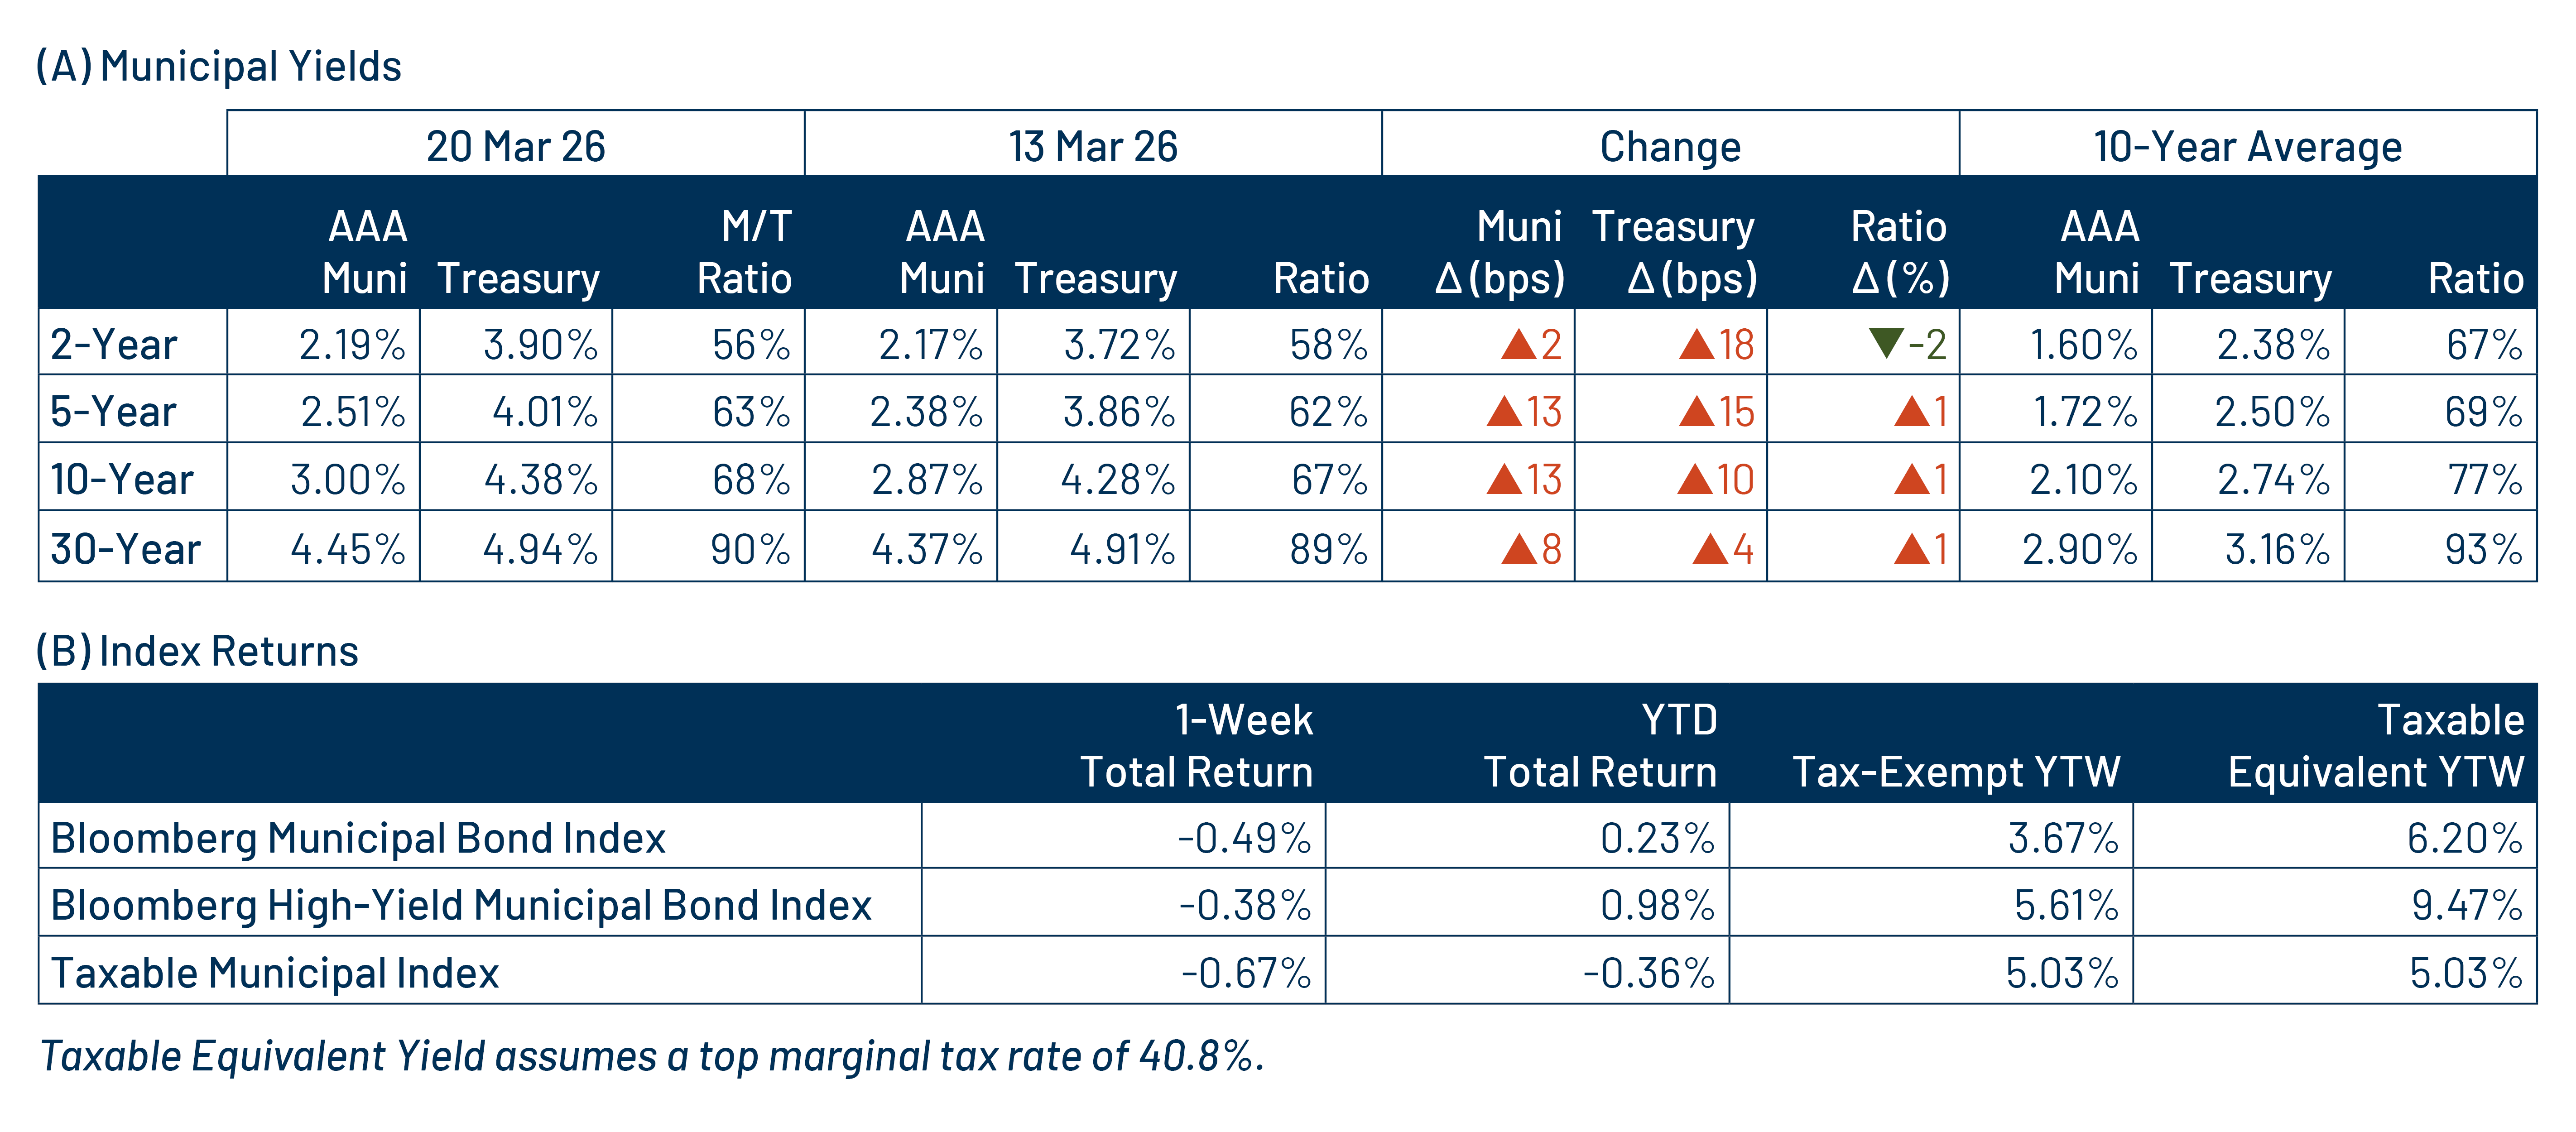
Municipals posted negative returns in sympathy with Treasuries last week as markets remained focused on geopolitical developments. On the economic front, producer price index (PPI) data came in above expectations, while the Federal Reserve (Fed) held its policy rate range steady at 3.50%-3.75%. Fed Chair Powell reiterated a “wait-and-see” approach on inflation before considering rate cuts. Overall, the Treasury curve shifted higher by 4-18 basis points (bps) across maturities. High-grade municipal yields moved in tandem with Treasuries, rising 2-13 bps across the curve. Meanwhile, demand remained strong in light of overall market volatility. This week we touch on recent state and local government revenue released by the Census.
Muni Mutual Funds Sustain Strong Demand
Fund Flows ($1.8 billion of net inflows): During the week ending March 18, weekly reporting municipal mutual funds recorded $1.8 billion of net inflows, according to Lipper. Long-term, intermediate and short-term categories recorded $1.5 billion, $264 million and $138 million of inflows, respectively. Last week’s inflows marked the 17th consecutive week of positive flows, bringing year-to-date (YTD) inflows to $25 billion.
Supply (YTD supply of $114 billion; up 14% YoY): The muni market recorded $11 billion of new-issue supply last week, down 22% from the prior week. YTD new-issue supply of $114 billion is 14% higher than the prior year, with tax-exempt issuance up 15% year-over-year (YoY) and taxable issuance down 8%, respectively. This week’s calendar is expected to jump to $17 billion, the highest level of the year. The largest deals include $2.2 billion New York City General Obligation and $1.3 billion state of Illinois transactions.
This Week in Munis: Strengthened State and Local Revenue Collections
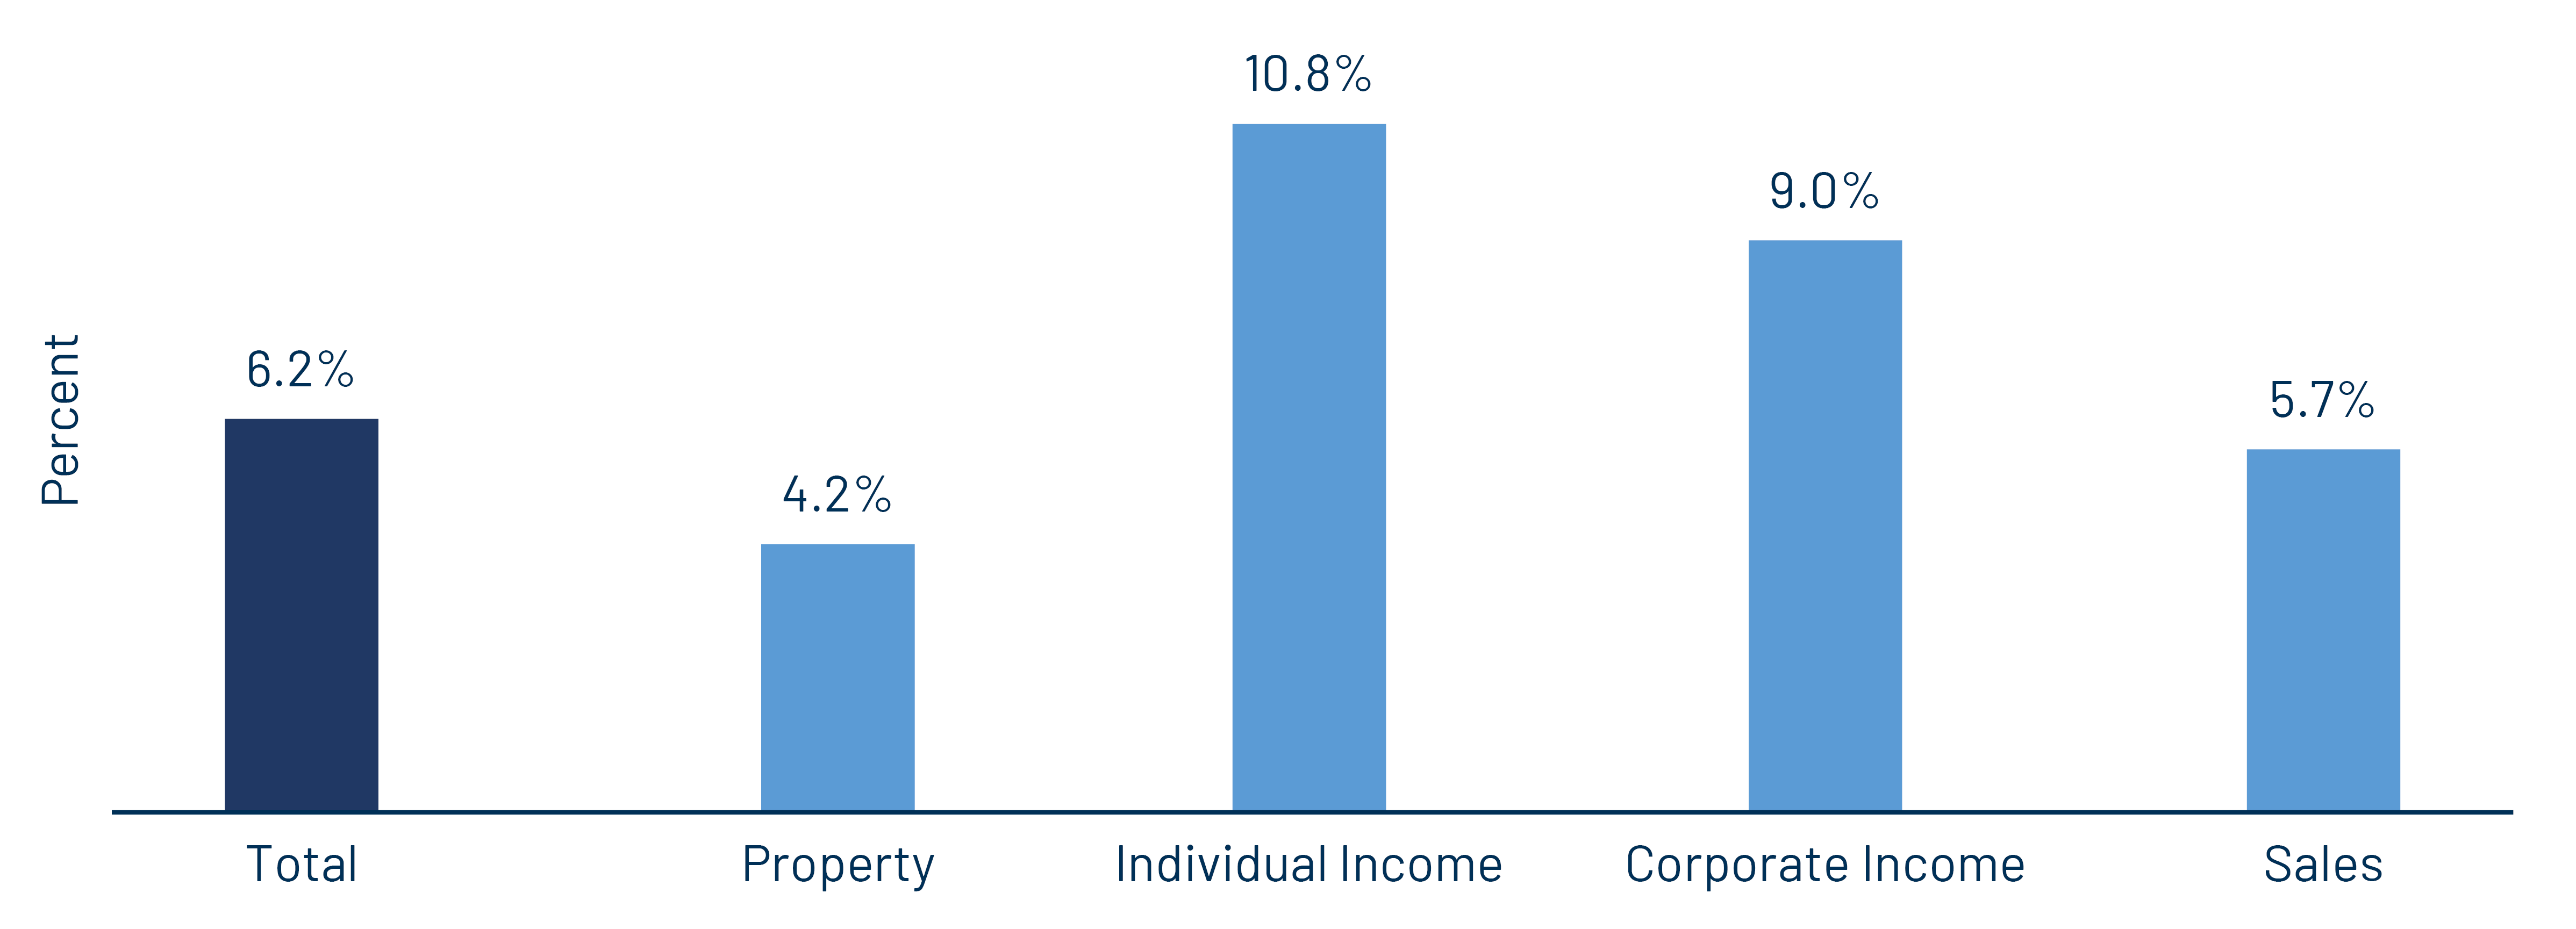
Earlier this month, the US Census Bureau released its 4Q25 state and local tax collection estimates, effectively closing out full-year 2025 data. In the fourth quarter, total state and local tax collections reached $671 billion, representing a 6.2% increase compared to 4Q24. Among major revenue sources, individual income tax collections led growth, rising 10.8% YoY, followed by corporate income tax collections which increased 9.0% and sales tax collections which increased 5.7%. Property tax collections, the primary revenue source for local governments, grew 4.2% YoY.
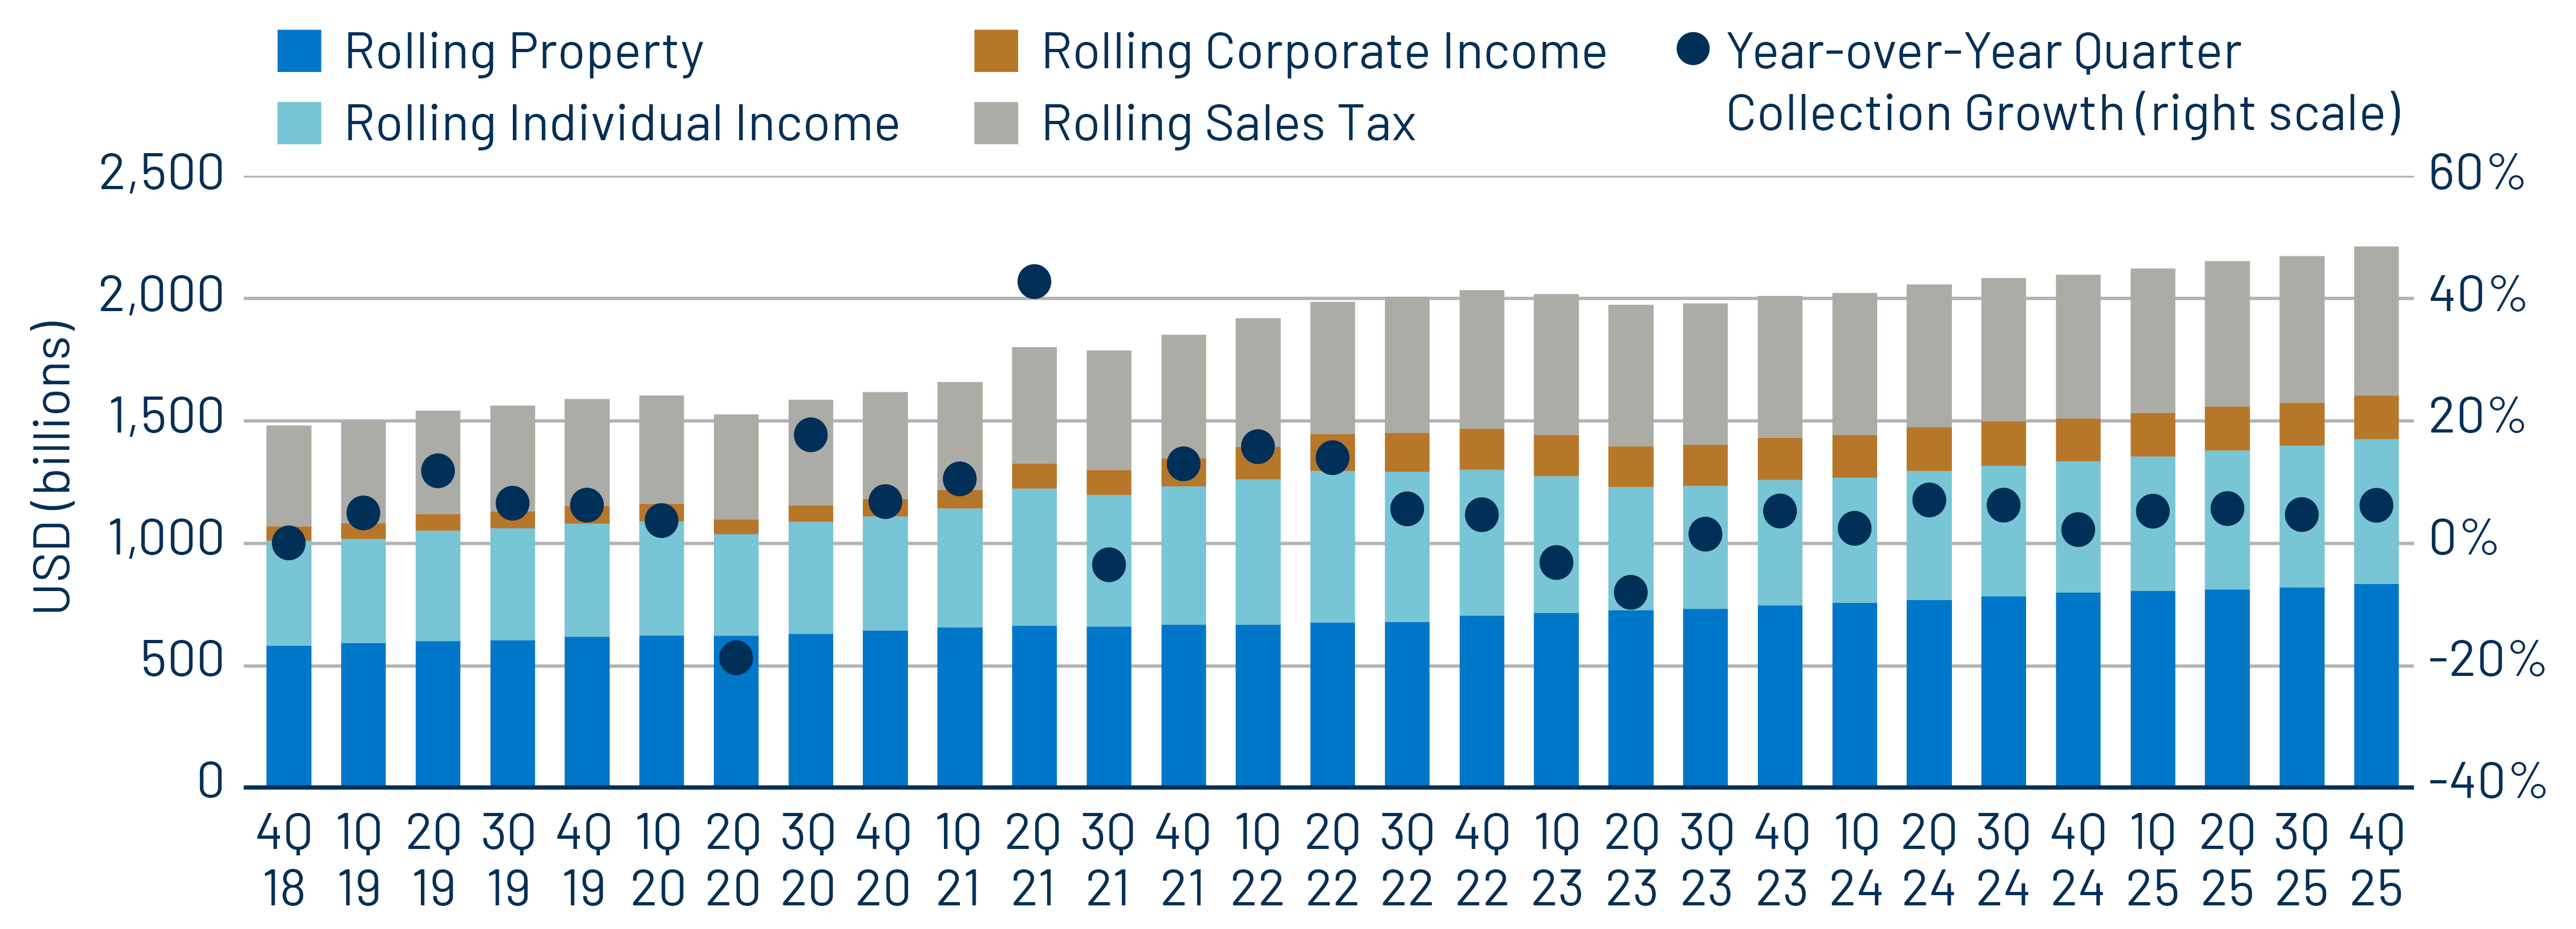
On a trailing 12-month basis through the 2025 calendar year, total collections rose 5.5% to a record $2.21 trillion, according to Census data. Individual income taxes also drove growth, increasing 10.7% YoY, while corporate income taxes rose 2.1% and sales tax collections increased 3.4%. Rolling 12-month property tax collections grew 4.3%.
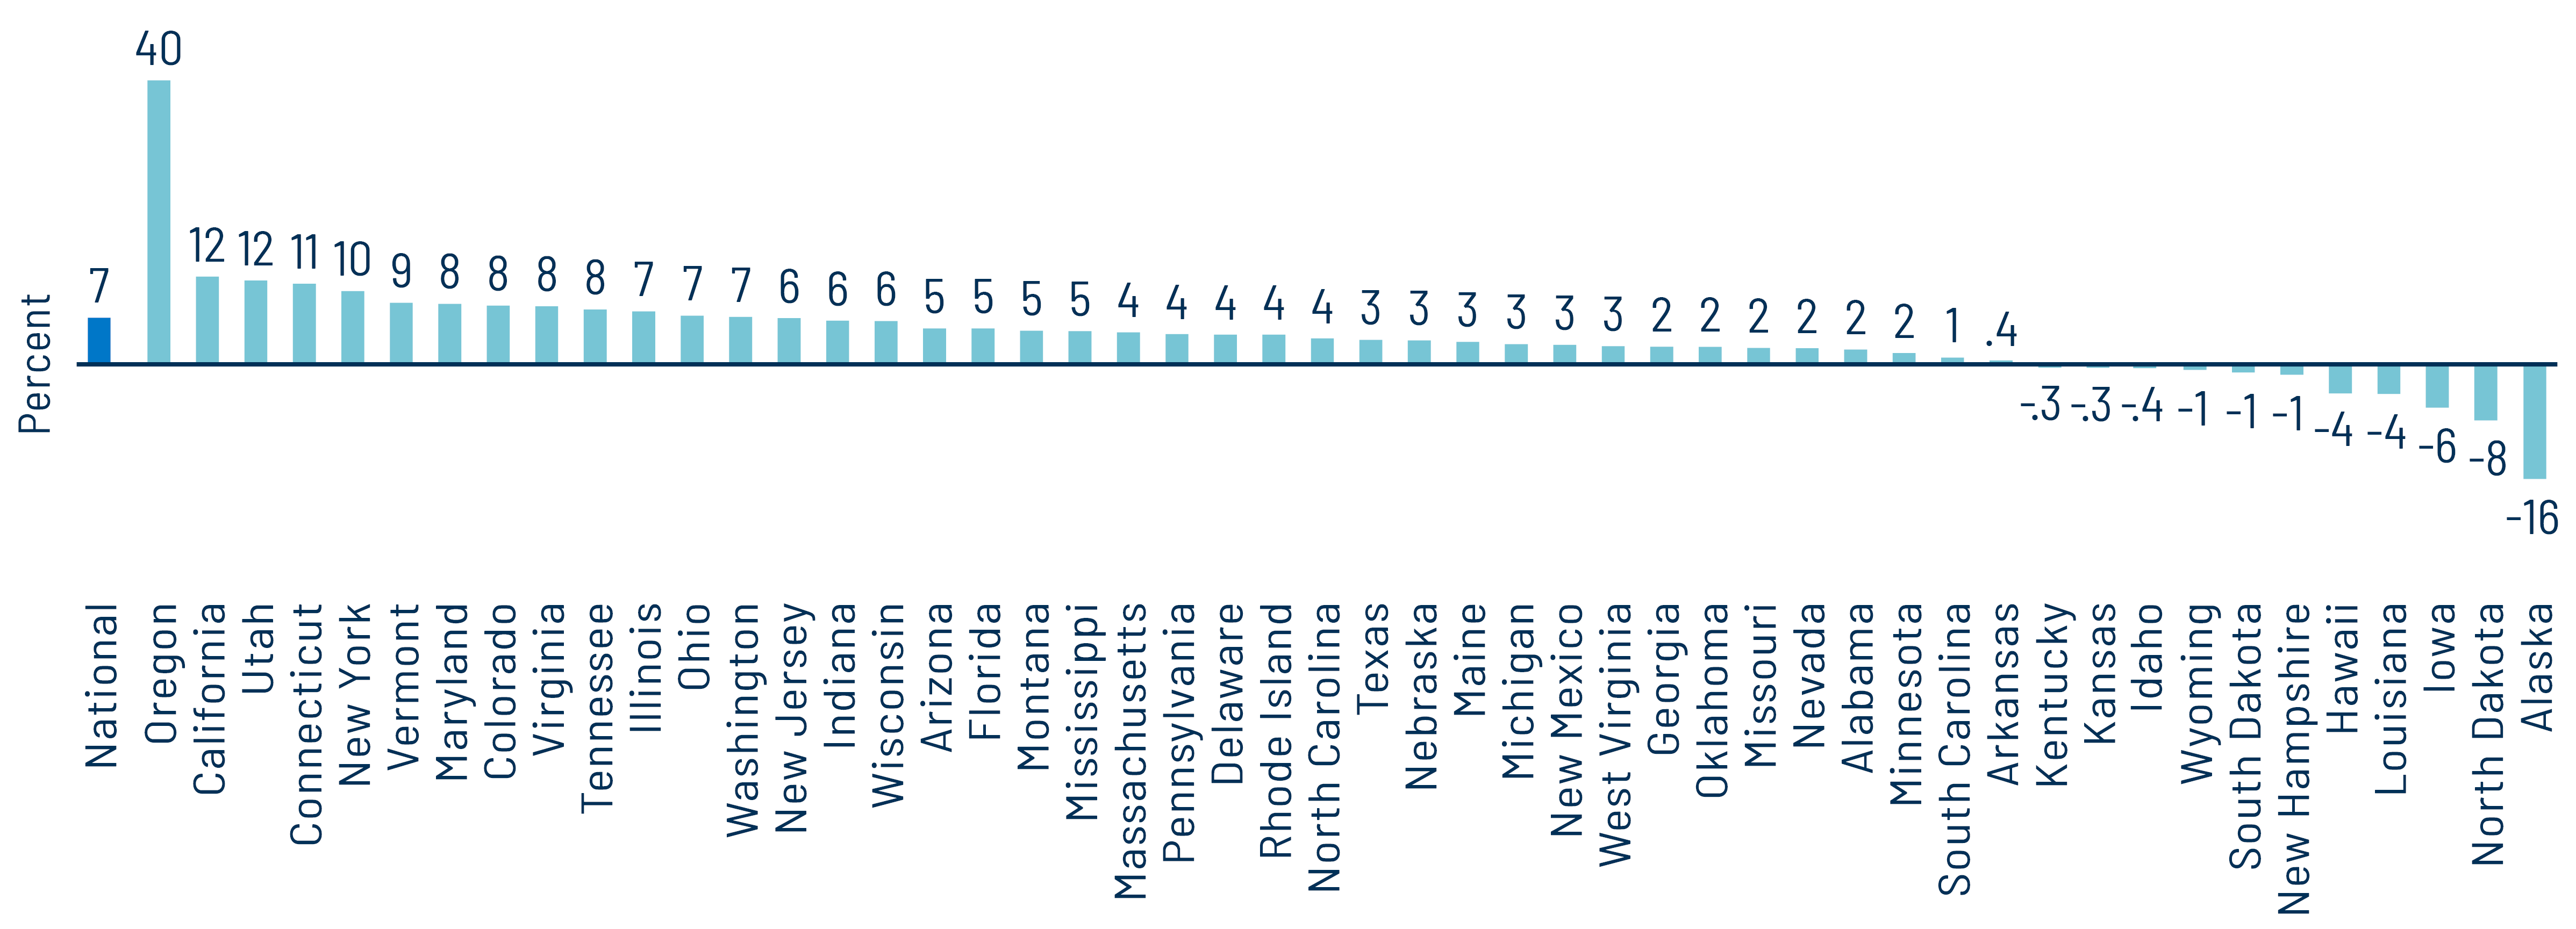
At the state level, most states experienced revenue gains during 2025, with total state tax collections increasing 6.5% YoY. Oregon (+40%), California (+12%) and Utah (+12%) posted the strongest growth. Conversely, Alaska (-16%), North Dakota (-8%) and Iowa (-6%) recorded the largest declines in trailing 12-month revenues.
The strong tax collections, which continue to grow off record-high levels, underscore the resilience of state and local credit and their ability to manage potential budgetary pressures. As the municipal market navigates budget season and with upgrades still outpacing downgrades at a slower pace than in recent years, Western Asset expects these strong revenue trends to support overall credit stability and the historically high quality of the asset class.
Municipal Credit Curves and Relative Value
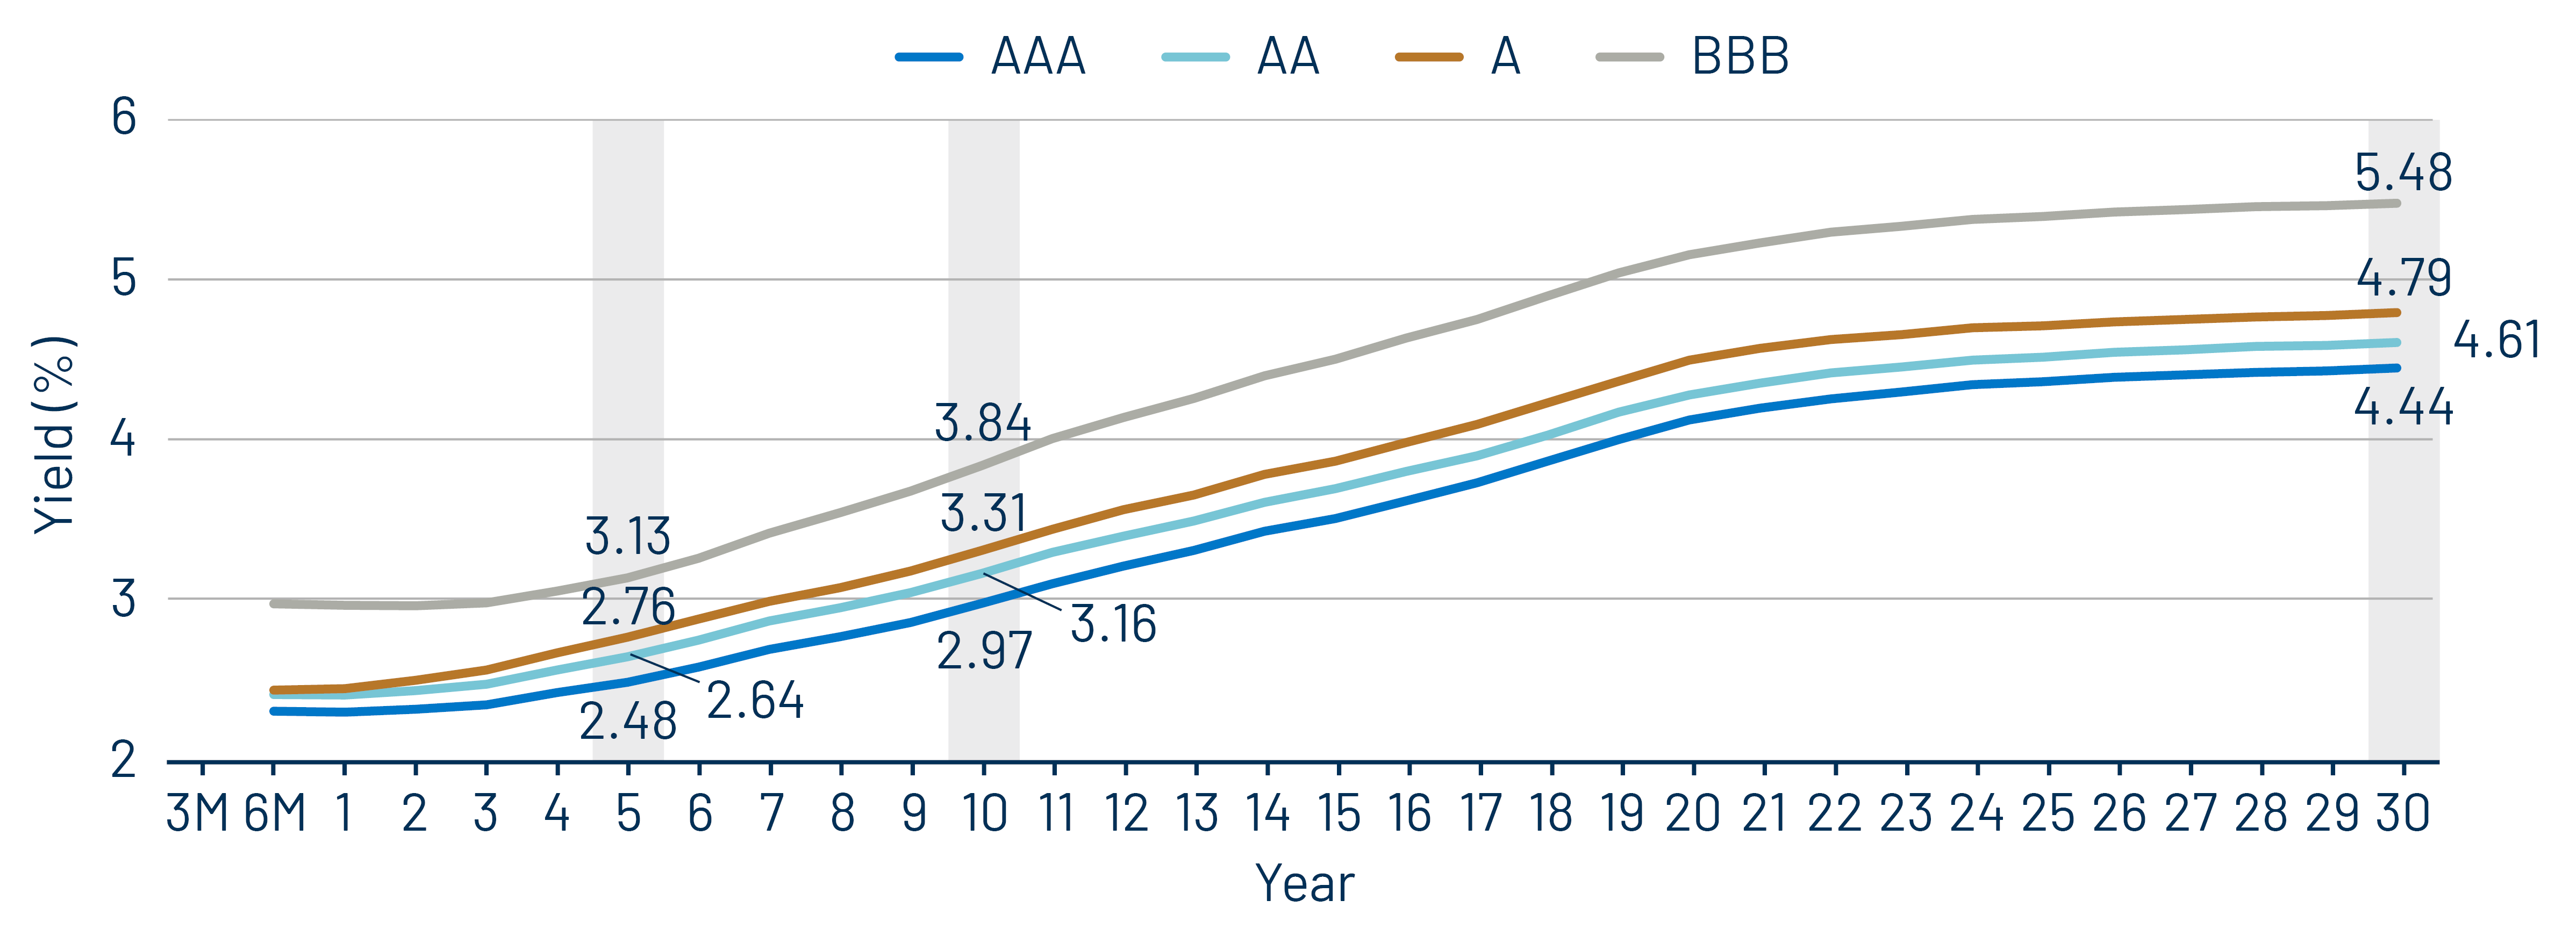
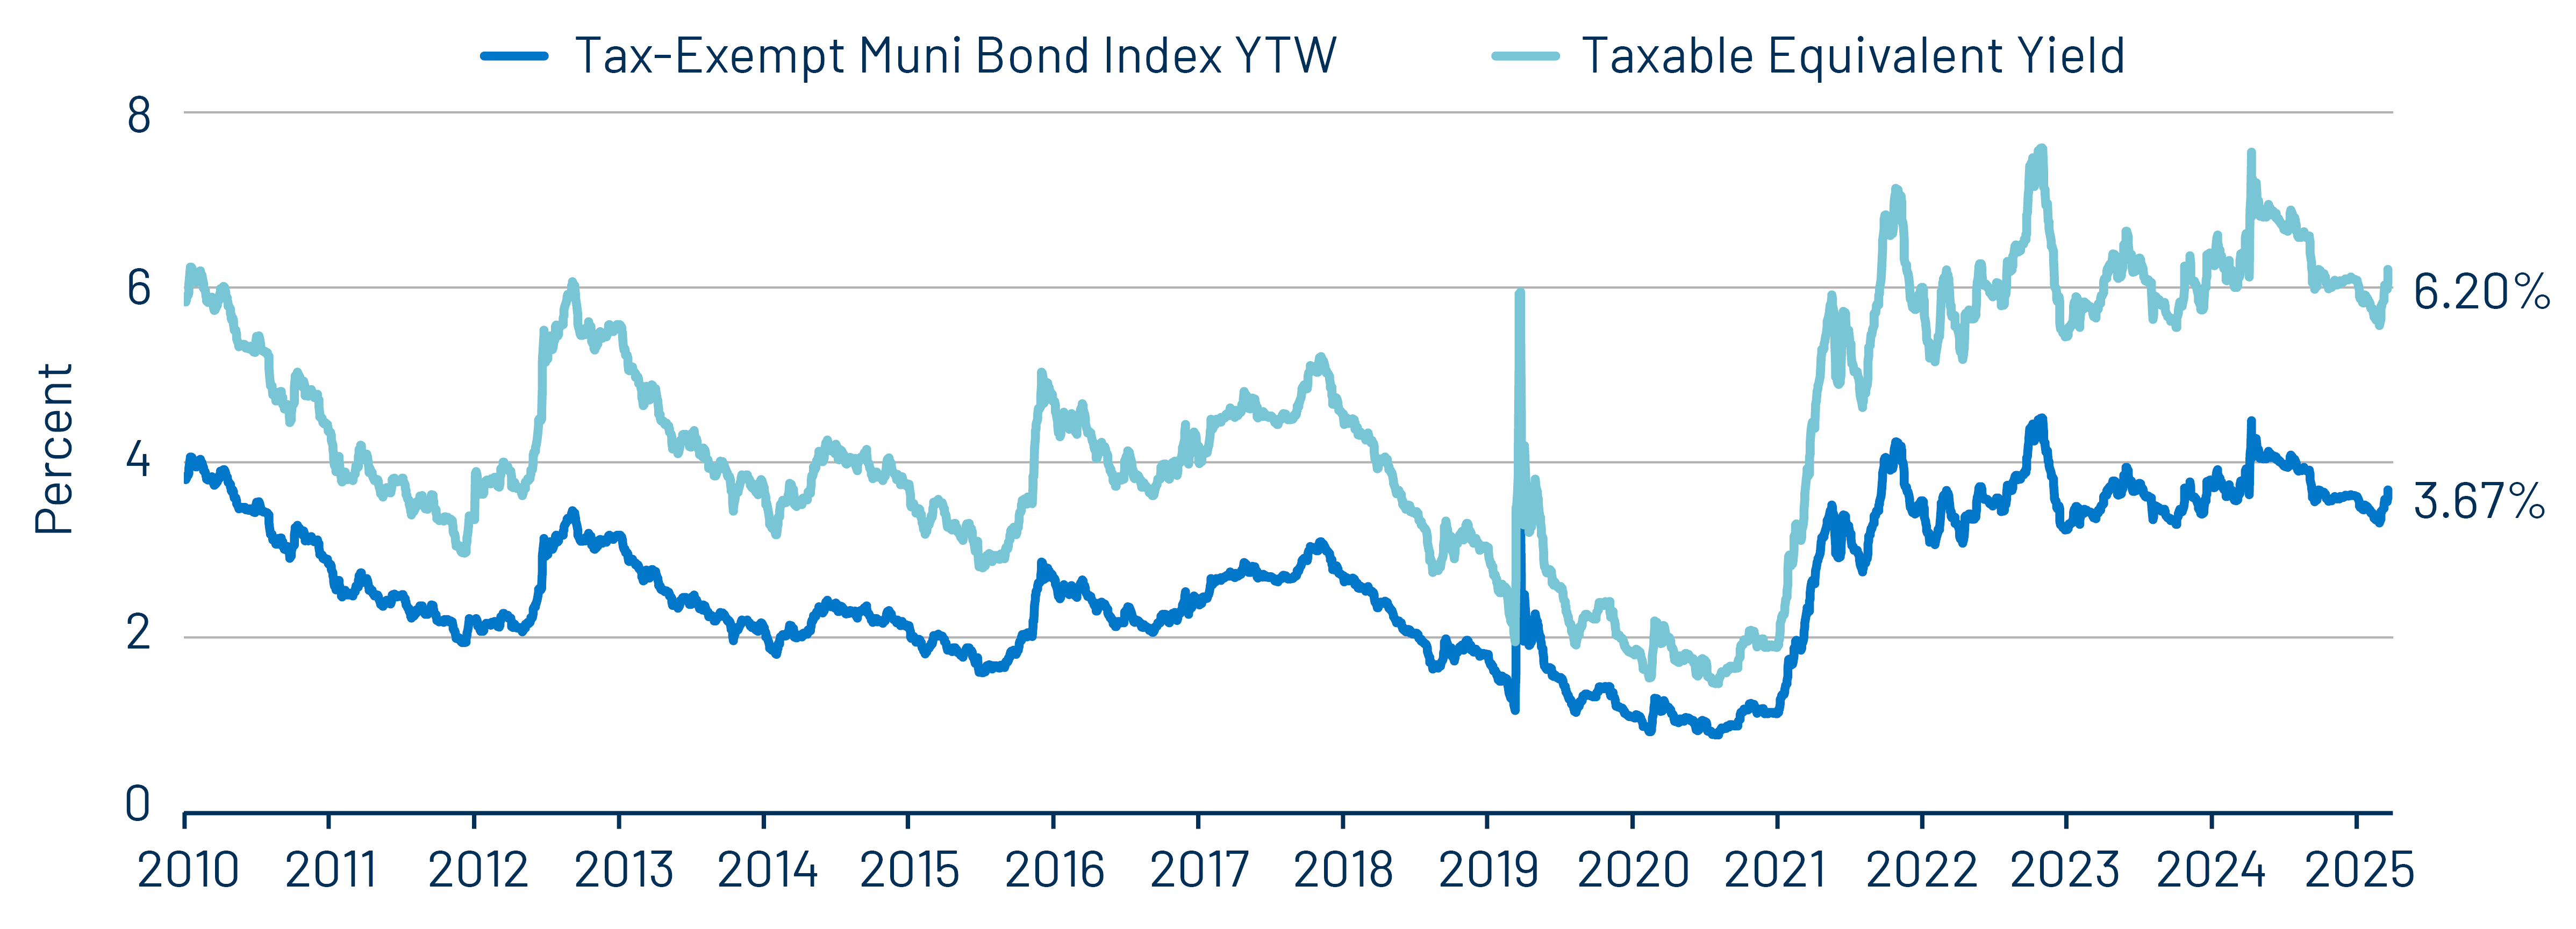
Theme 1: Municipal taxable-equivalent yields moved lower from recent highs but remain above historical averages.
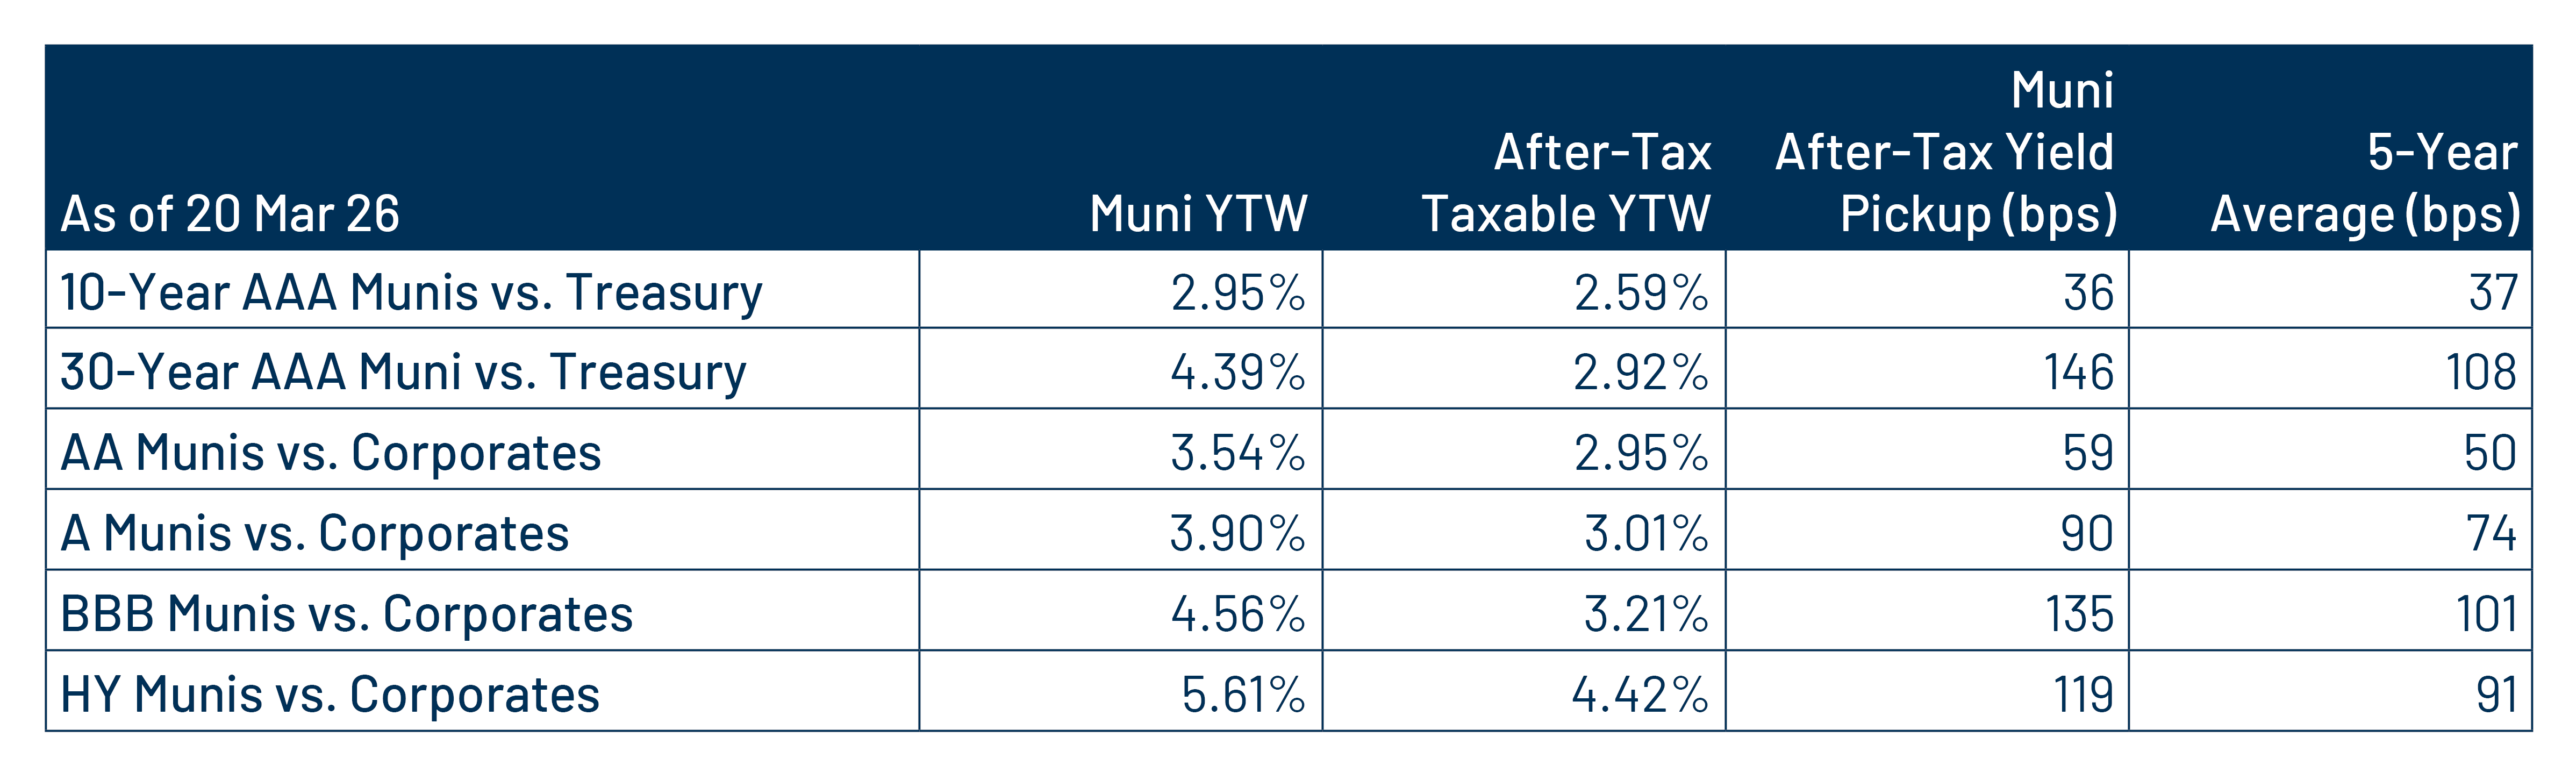
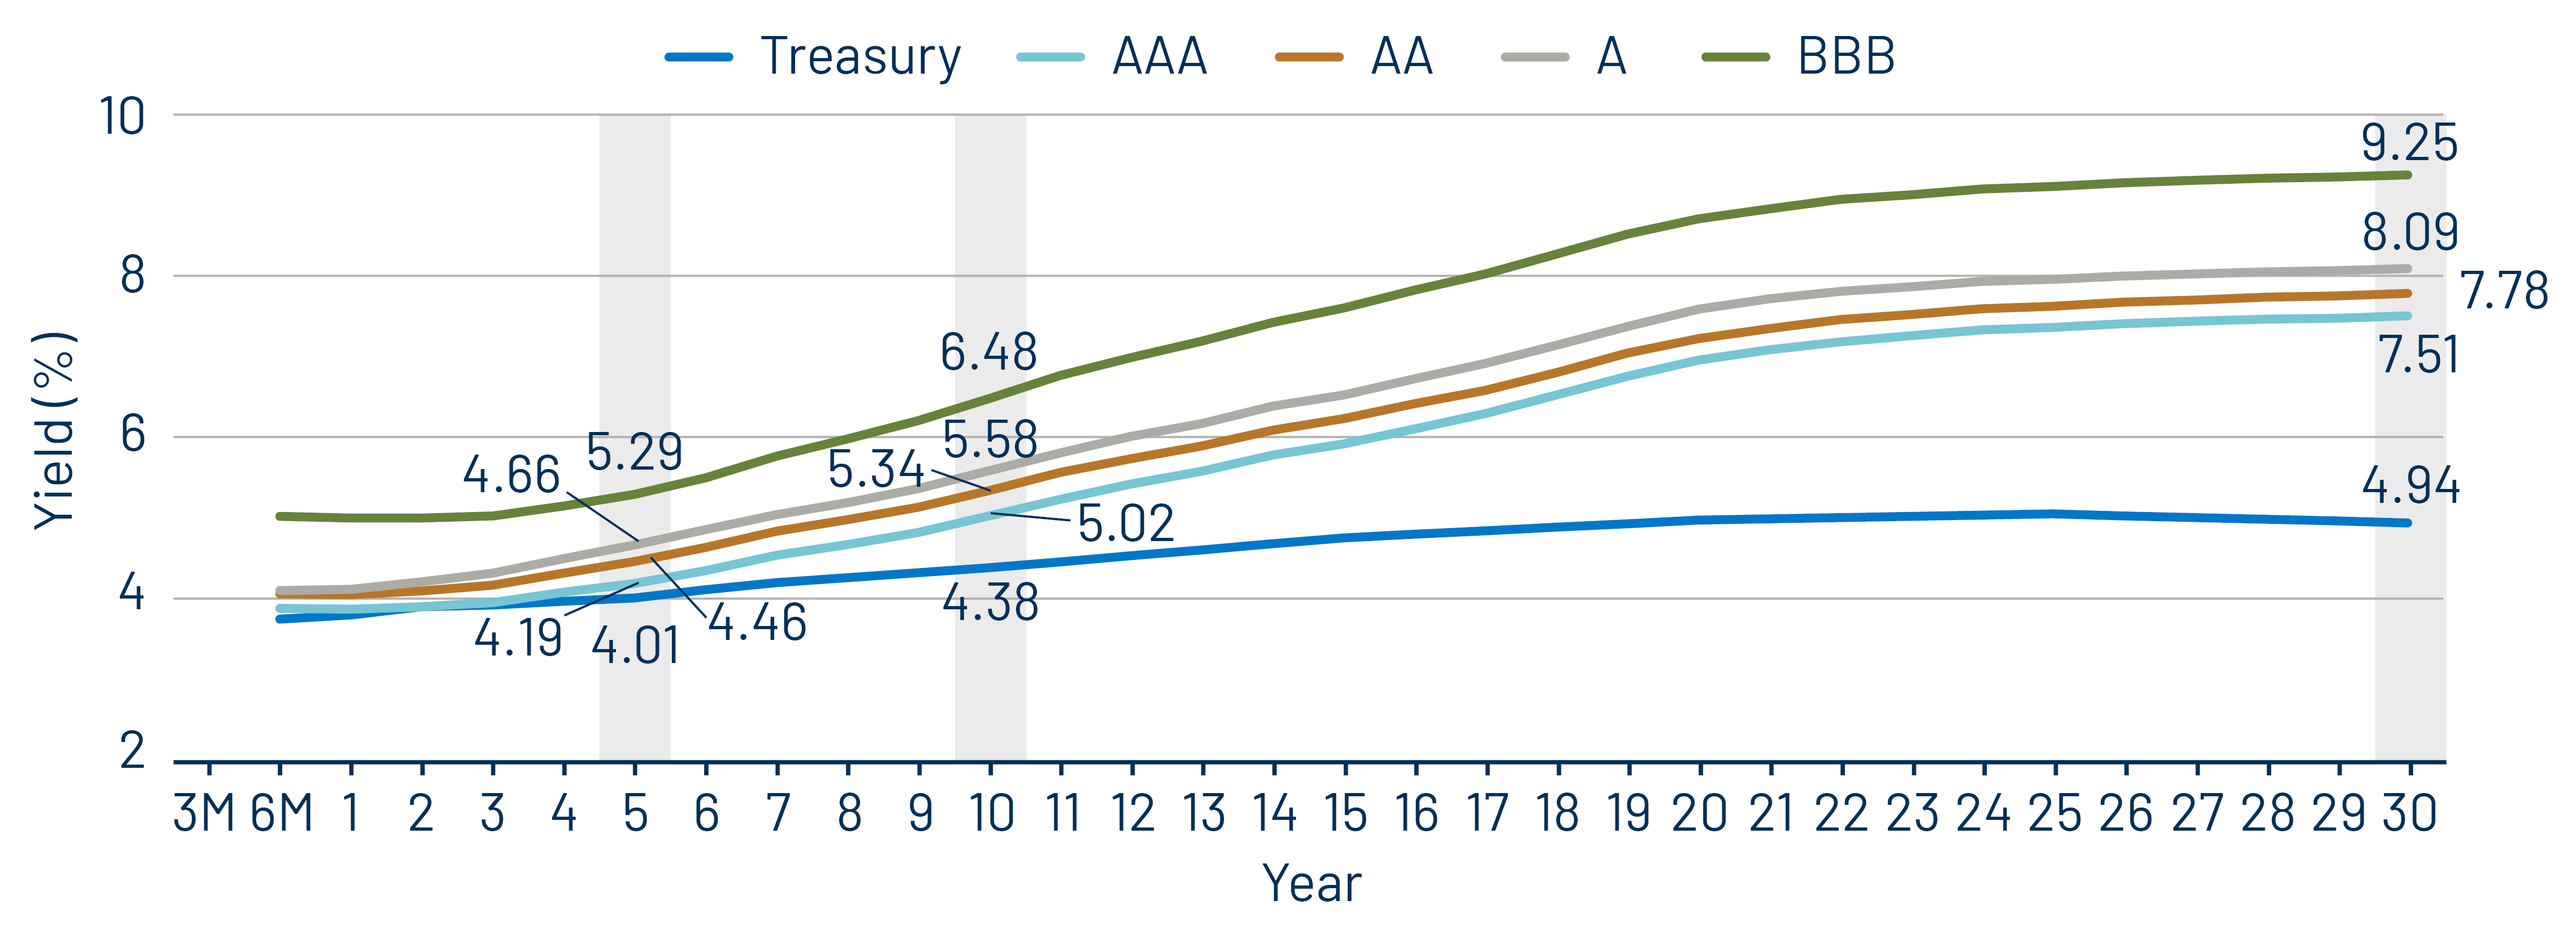
Theme 2: Munis offer attractive after-tax yield pickup vs. longer-duration and lower-quality taxable alternatives.
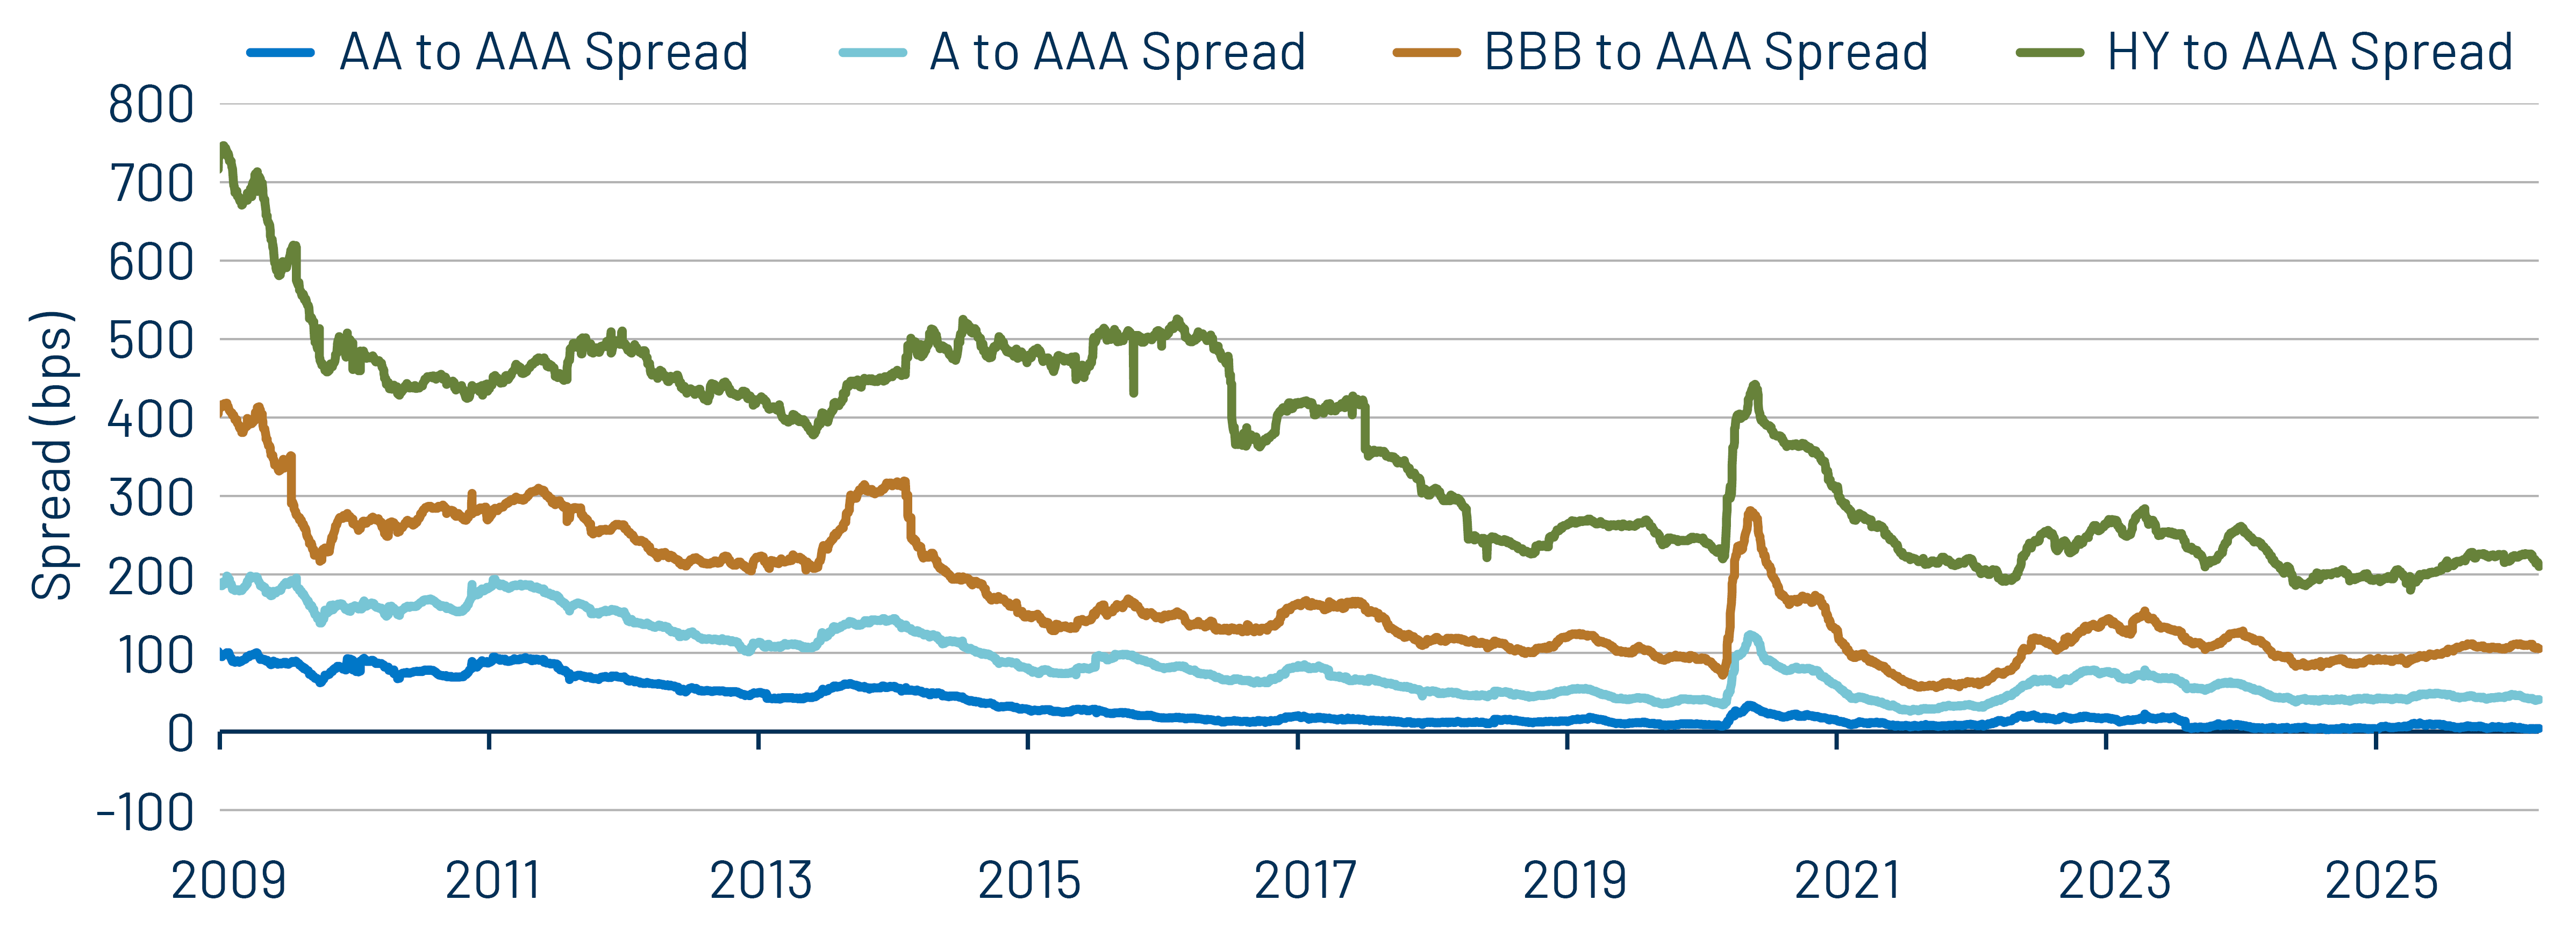
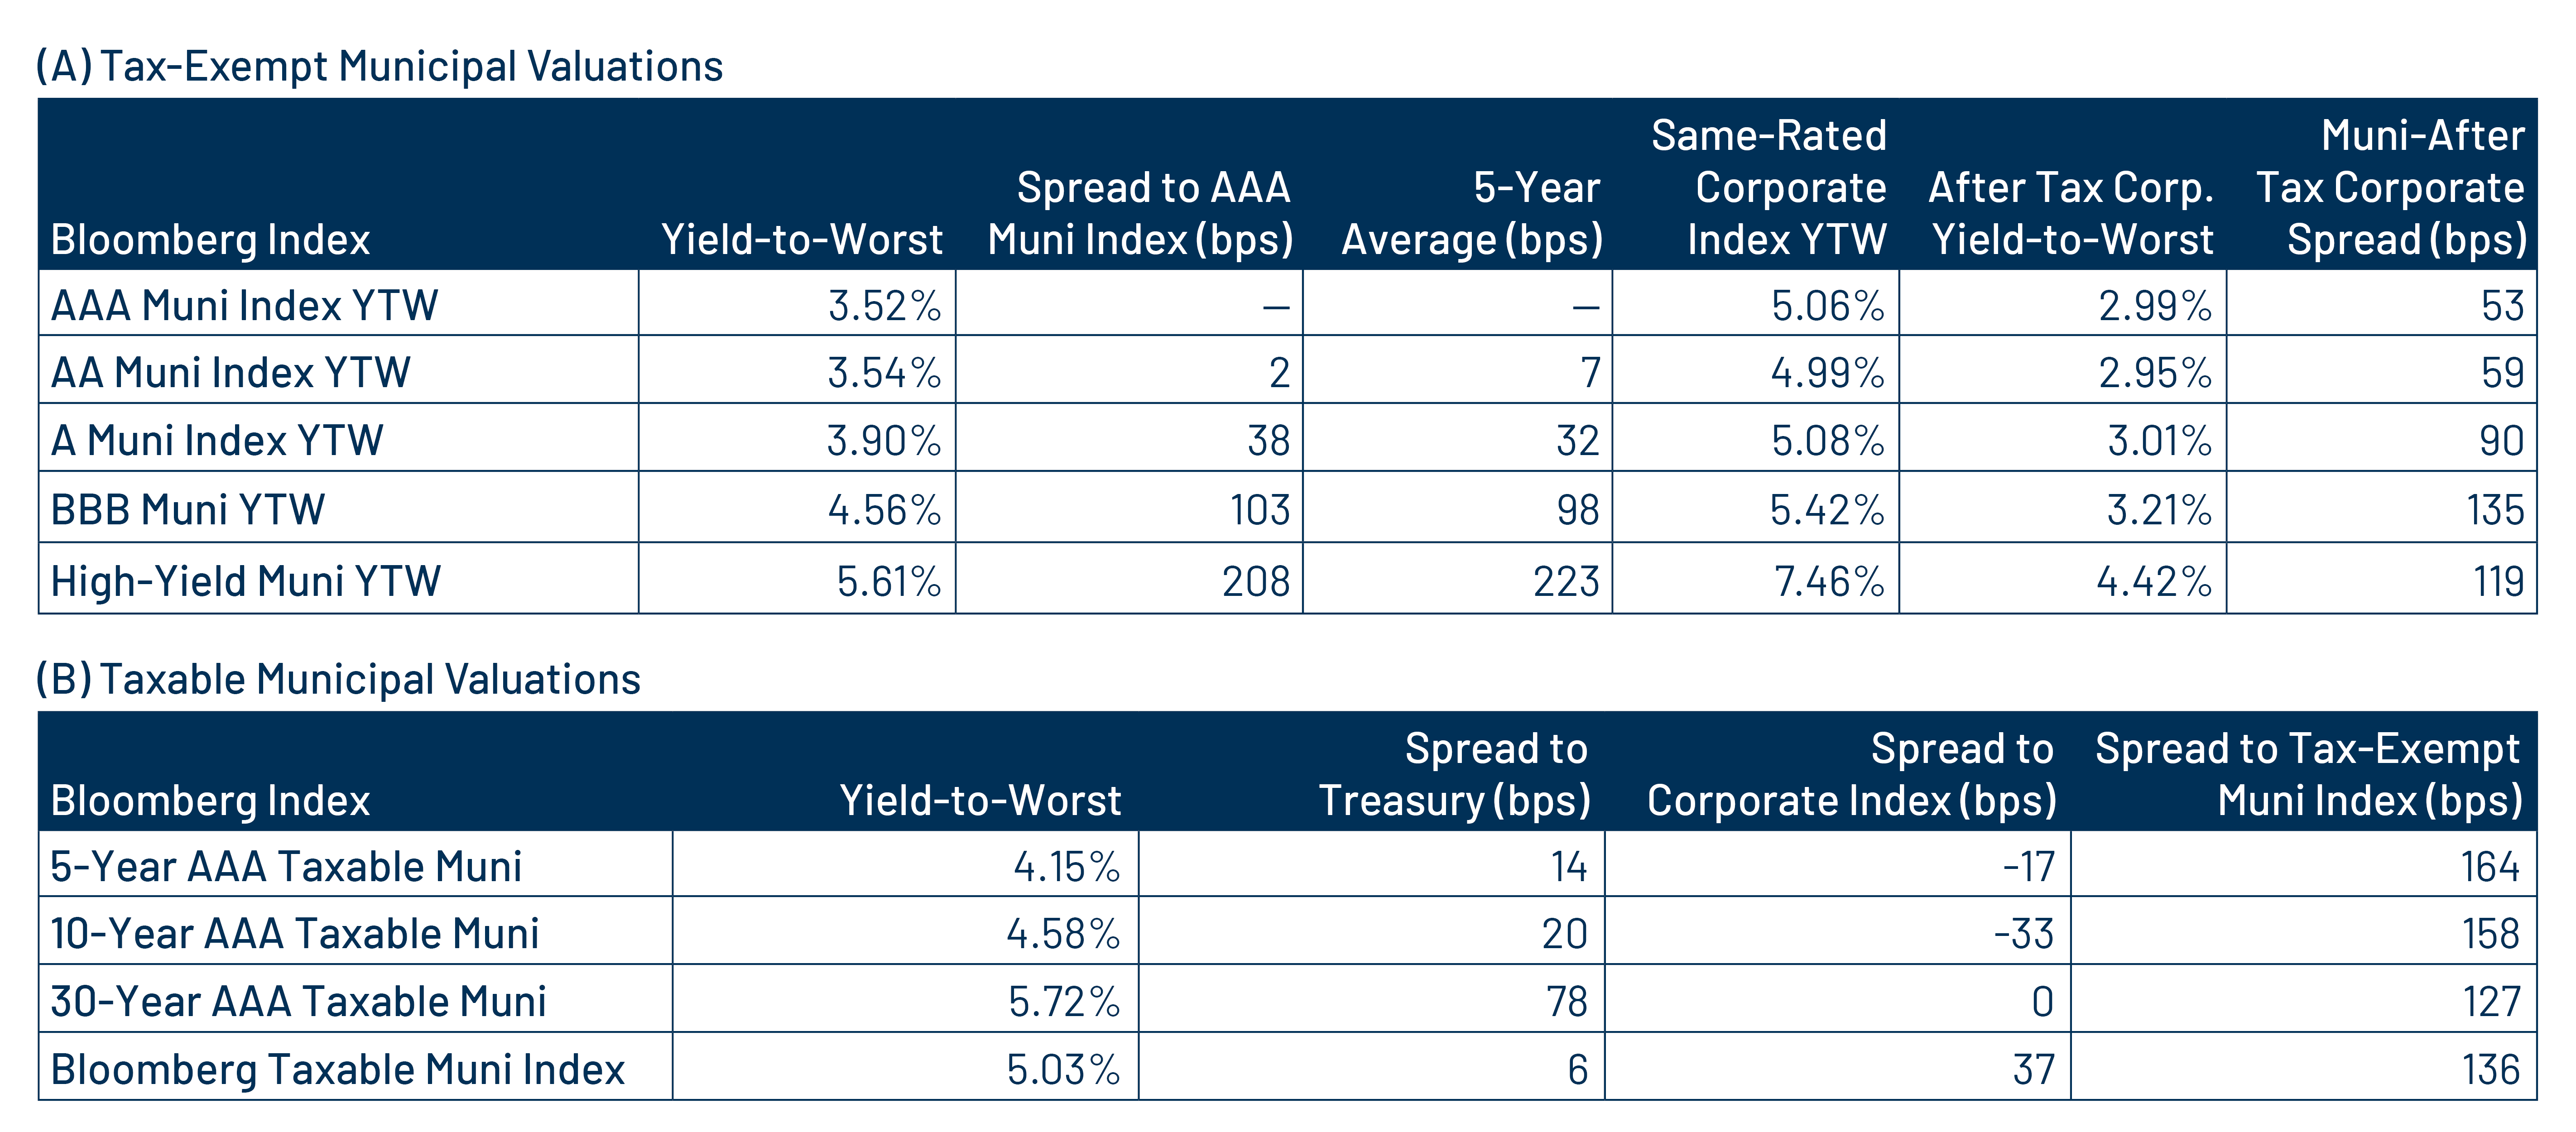
Theme 3: Historically tight municipal credit spreads underscore the importance of credit selection.