Macros, markets and munis
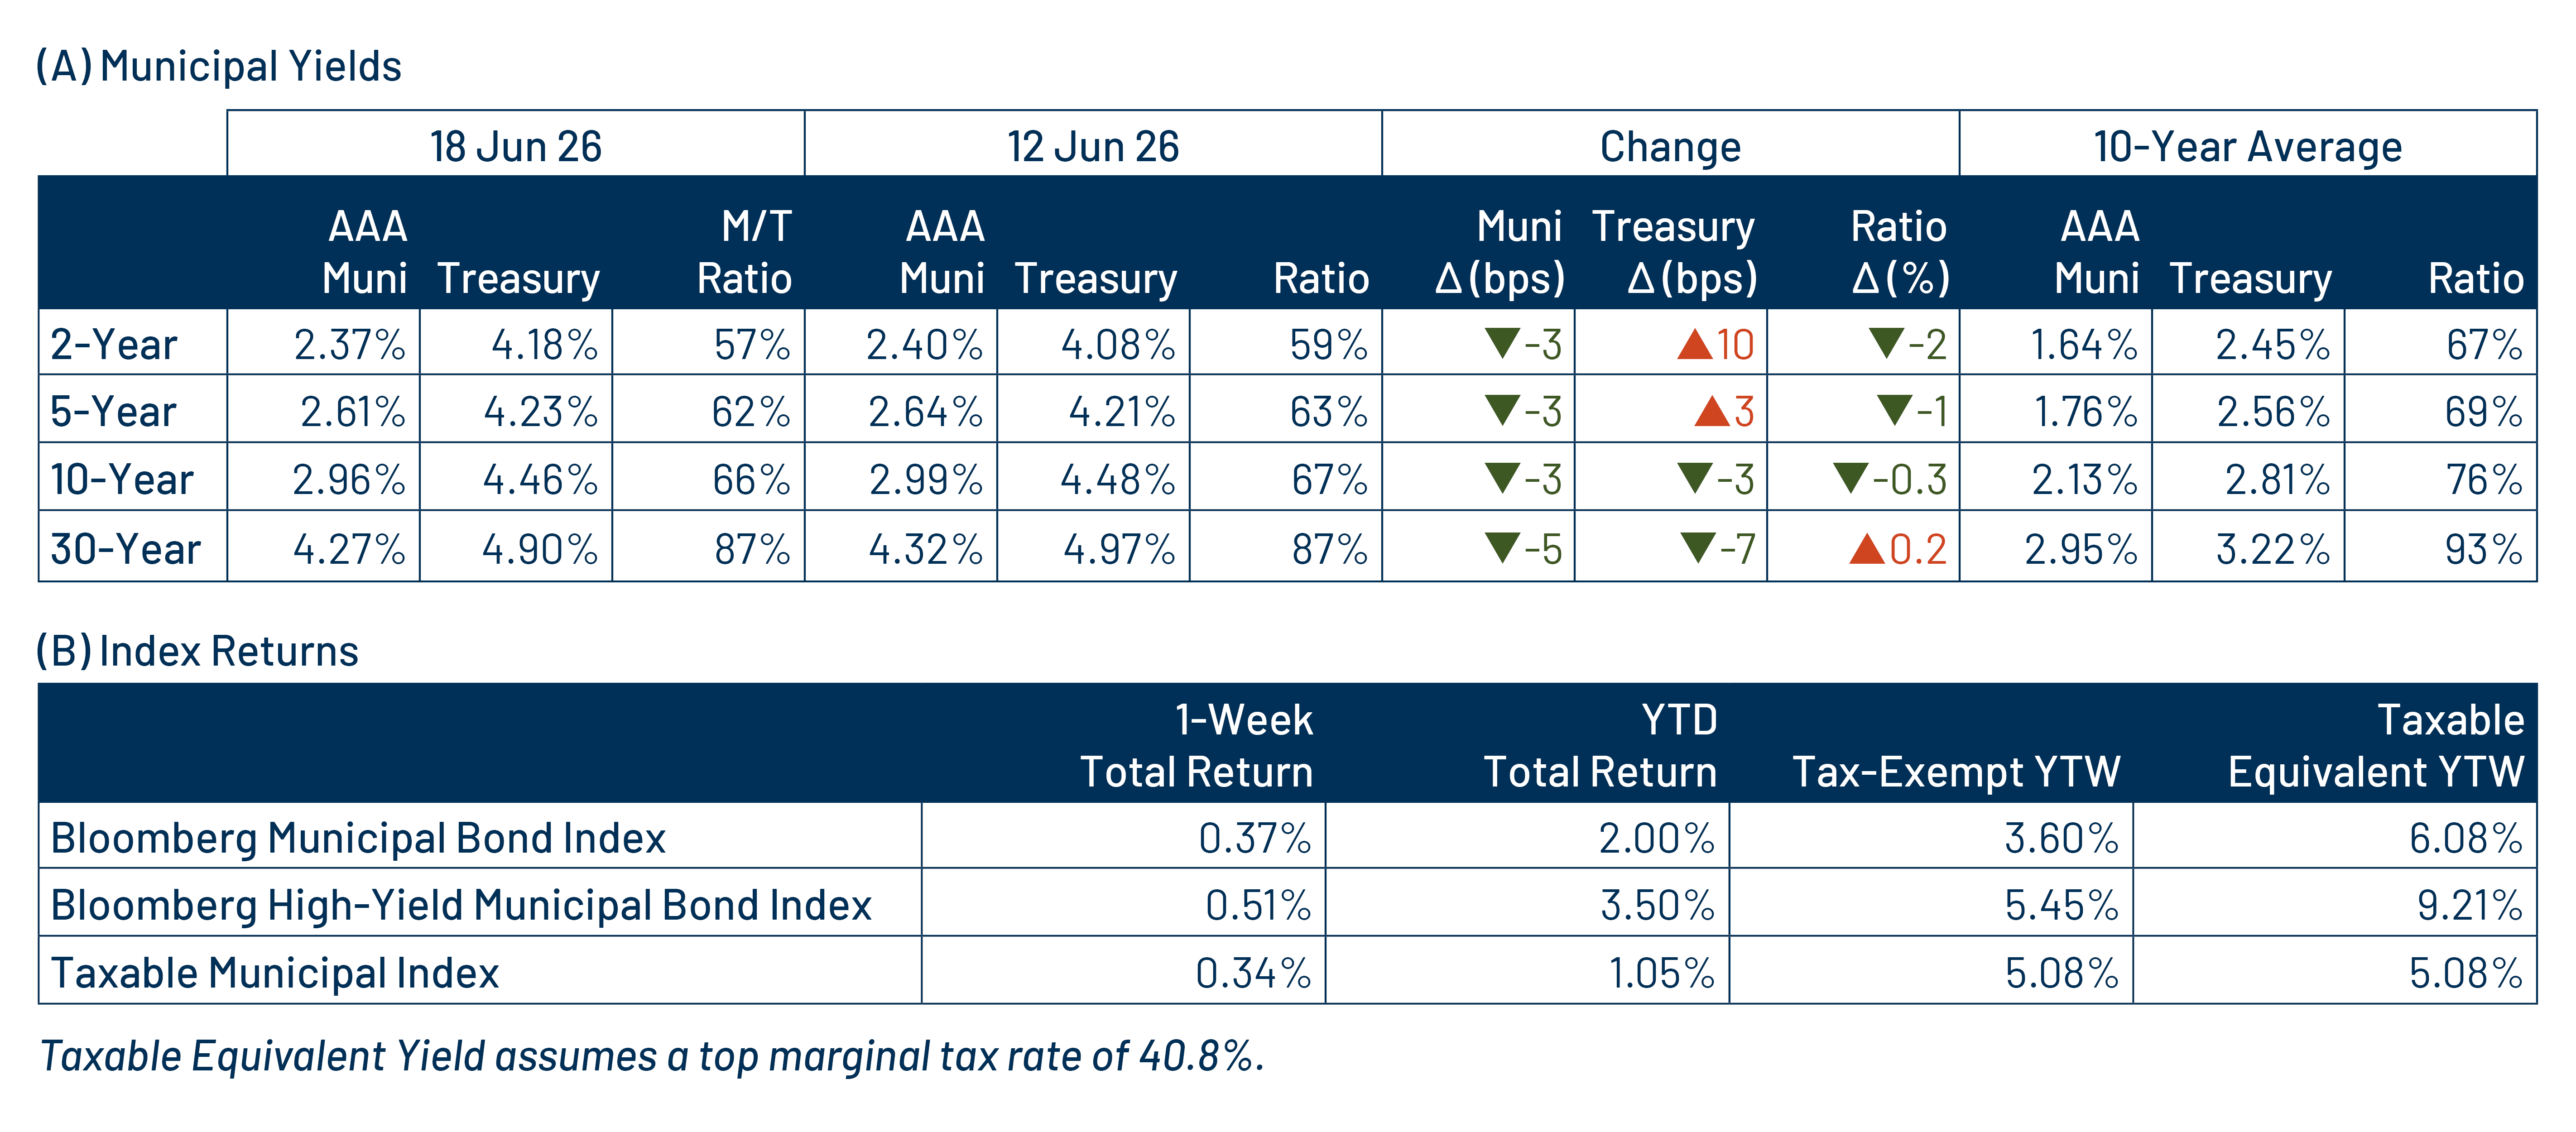
Municipals posted positive returns last week and outperformed Treasuries as oil prices continued to decline after President Trump announced that a peace deal with Iran had been signed. Meanwhile, the first Federal Open Market Committee meeting under new Chair Kevin Warsh kept the range for the fed funds rate steady at 3.50%-3.75%. The updated dot plot signaled a hawkish shift, with about half of participants expecting at least one rate hike in 2026, reinforcing the “higher-for-longer” narrative. The Treasury yield curve flattened, with shorter maturities rising 3 to 10 basis points (bps) and longer maturities declining 3 to 7 bps. Municipals saw robust demand that absorbed elevated supply. This week we highlight strong state and local revenue collections.
Demand remained strong amid elevated supply levels
Fund Flows ($1.2 billion of net inflows): During the week ending June 17, weekly reporting municipal mutual funds recorded $1.2 billion of net inflows, according to Lipper. From a vehicle perspective, ETFs garnered the vast majority of net inflows at $1.1 billion. The long-term category recorded $741 million of inflows, the intermediate category reported $444 million of inflows and the short category recorded $2 million of inflows. Last week’s inflows bring year-to-date (YTD) inflows to $49 billion.
Supply (YTD supply of $285 billion; up 11% YoY): The muni market recorded $11 billion of new-issue supply last week, down 37% from the prior week’s level. The YTD new-issue supply of $285 billion is 11% higher than the prior record-issuance year, with tax-exempt issuance up 11% year-over-year (YoY) and taxable issuance up 3%. This week’s calendar is expected to remain elevated at $16 billion. Largest deals include $1.4 billion Los Angeles Revenue Anticipation Notes and $850 million State of Idaho transactions.
This week in munis: State and local tax collections shine
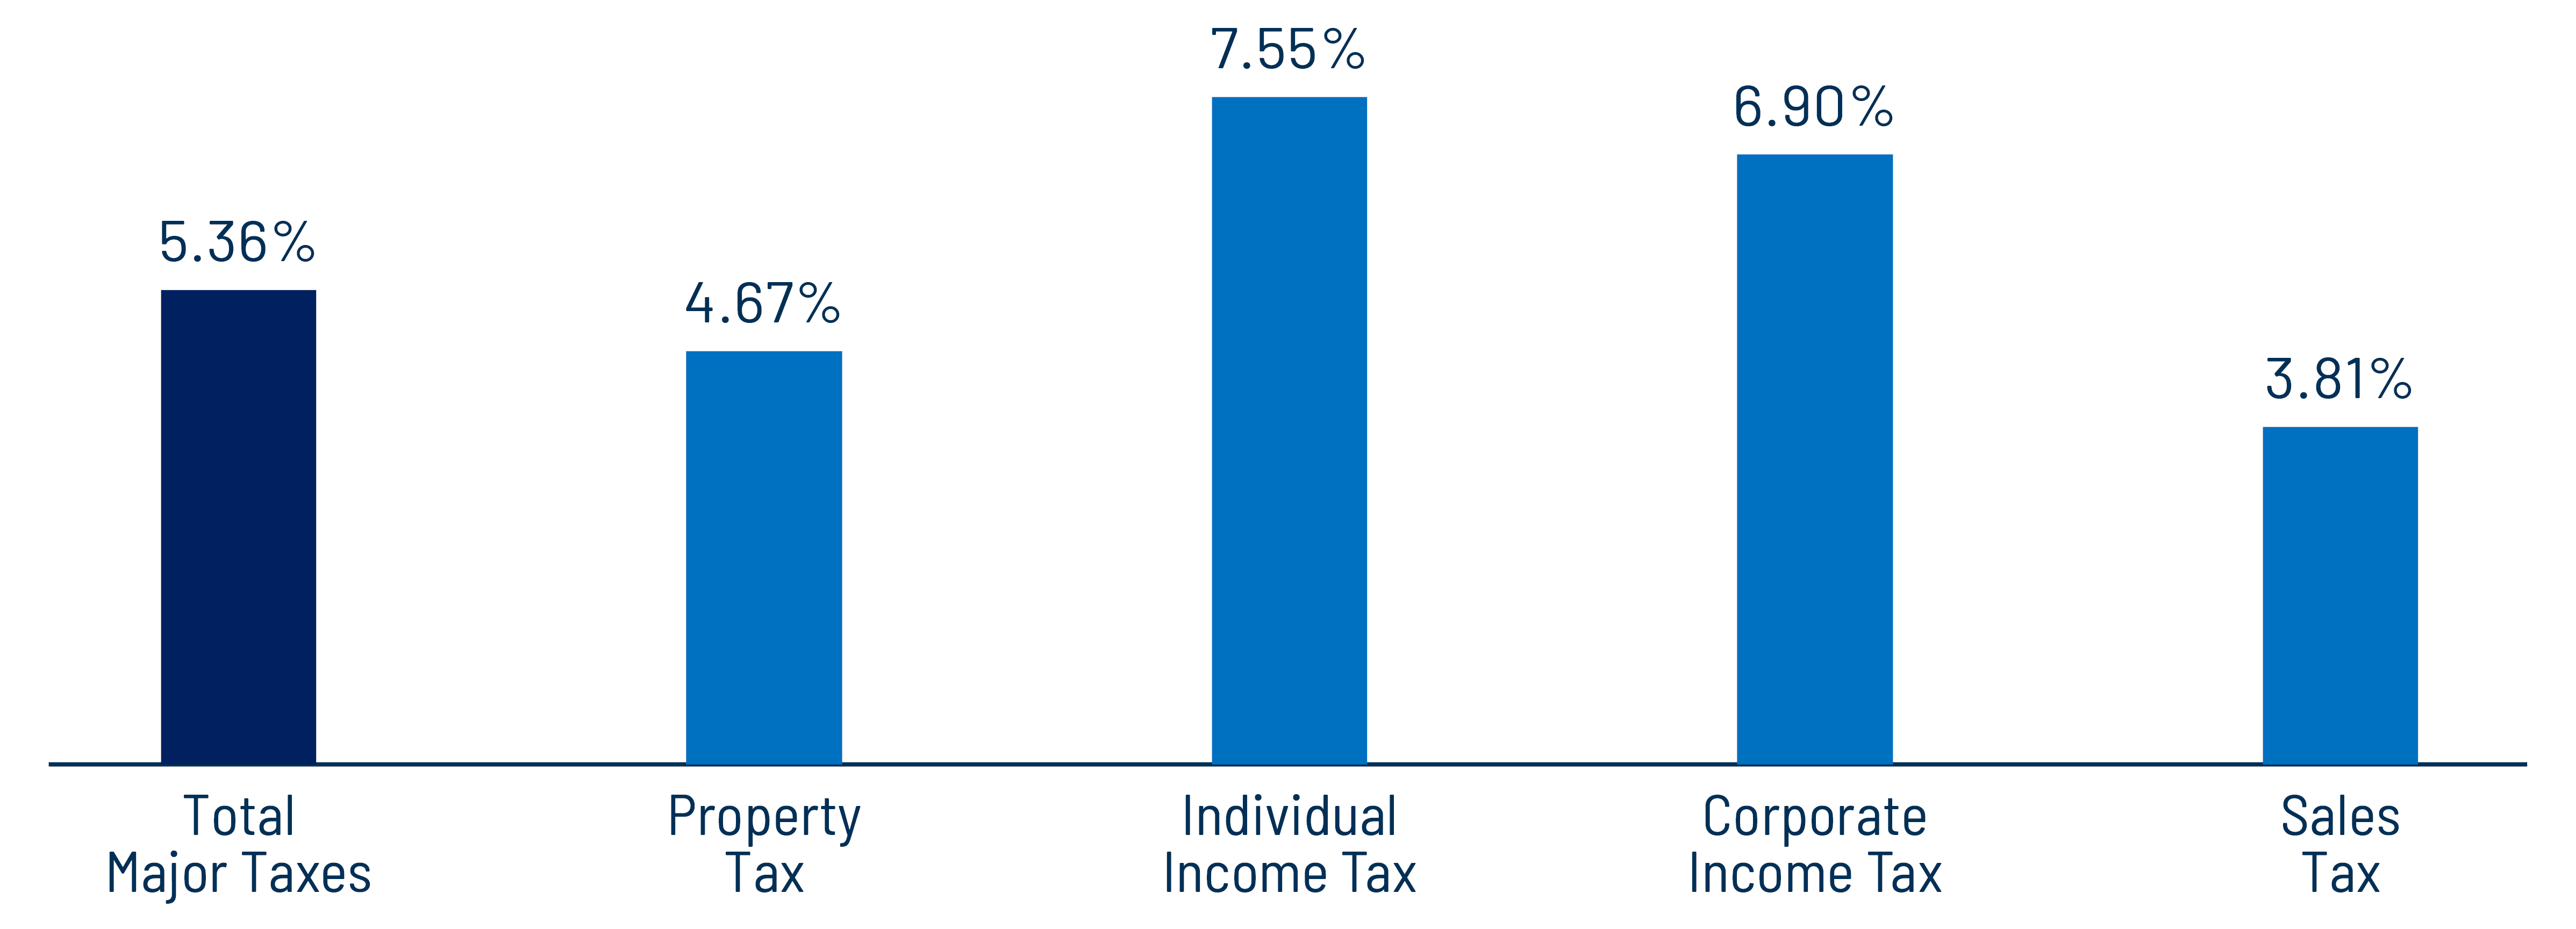
Earlier this month, the US Census Bureau released state and local tax collection estimates for the first quarter of 2026. State and local governments collected an estimated $541 billion of major tax revenue during the quarter, up 5.4% from the 1Q25. Among major revenue sources, individual income tax collections led growth, rising 7.6% YoY, followed by corporate income taxes, which increased 6.9%, and sales taxes, which rose 3.8%. Property tax collections, the primary revenue source for local governments, grew 4.7% YoY.
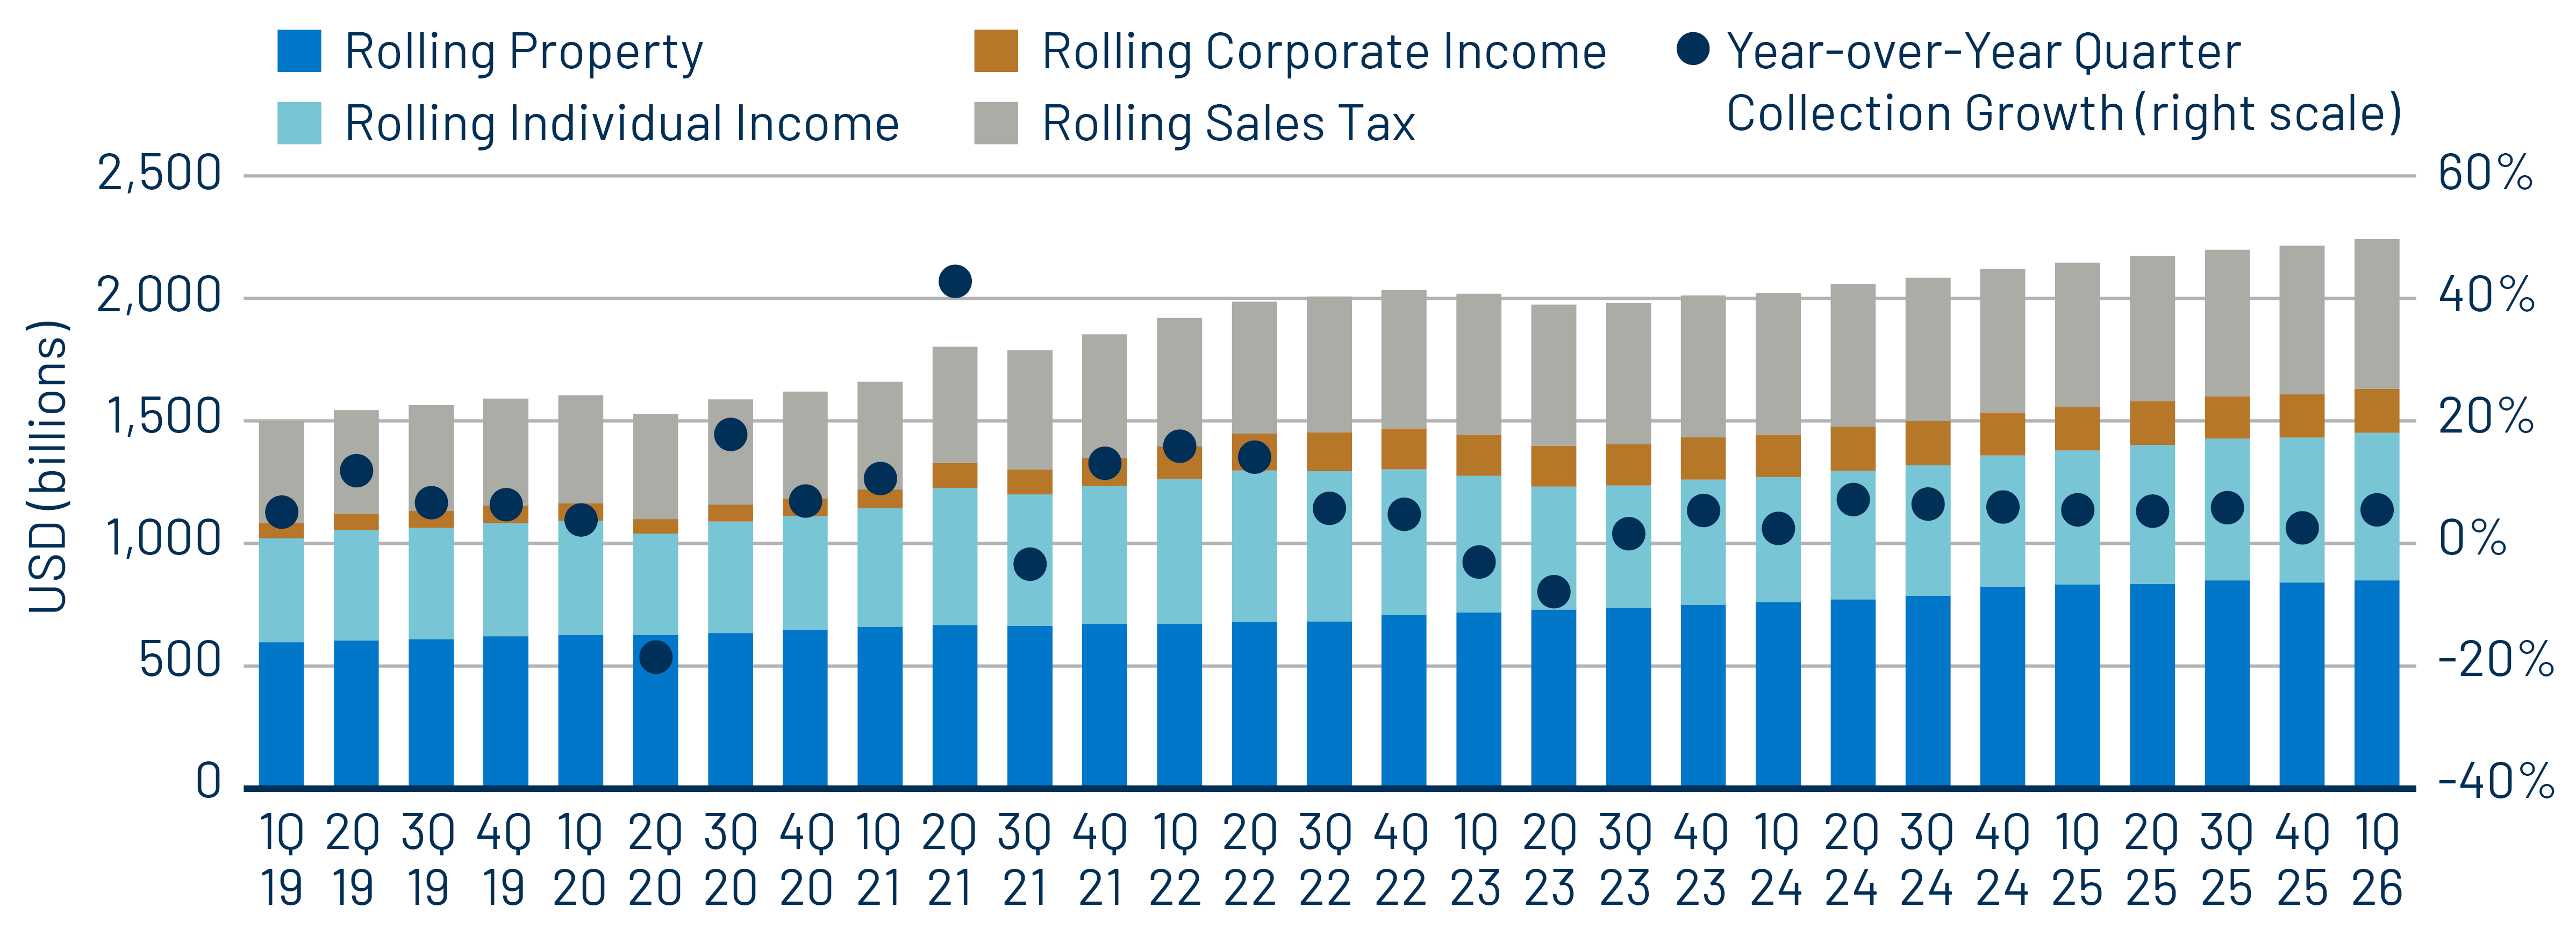
On a trailing 12-month basis, total collections rose 5.5% to a record $2.22 trillion. Individual income taxes were again the primary driver, increasing 10.0% YoY. Growth in corporate income tax and sales tax collections was more moderate, at 0.8% and 3.8%, respectively. Rolling 12-month property tax collections increased 2.1% YoY.
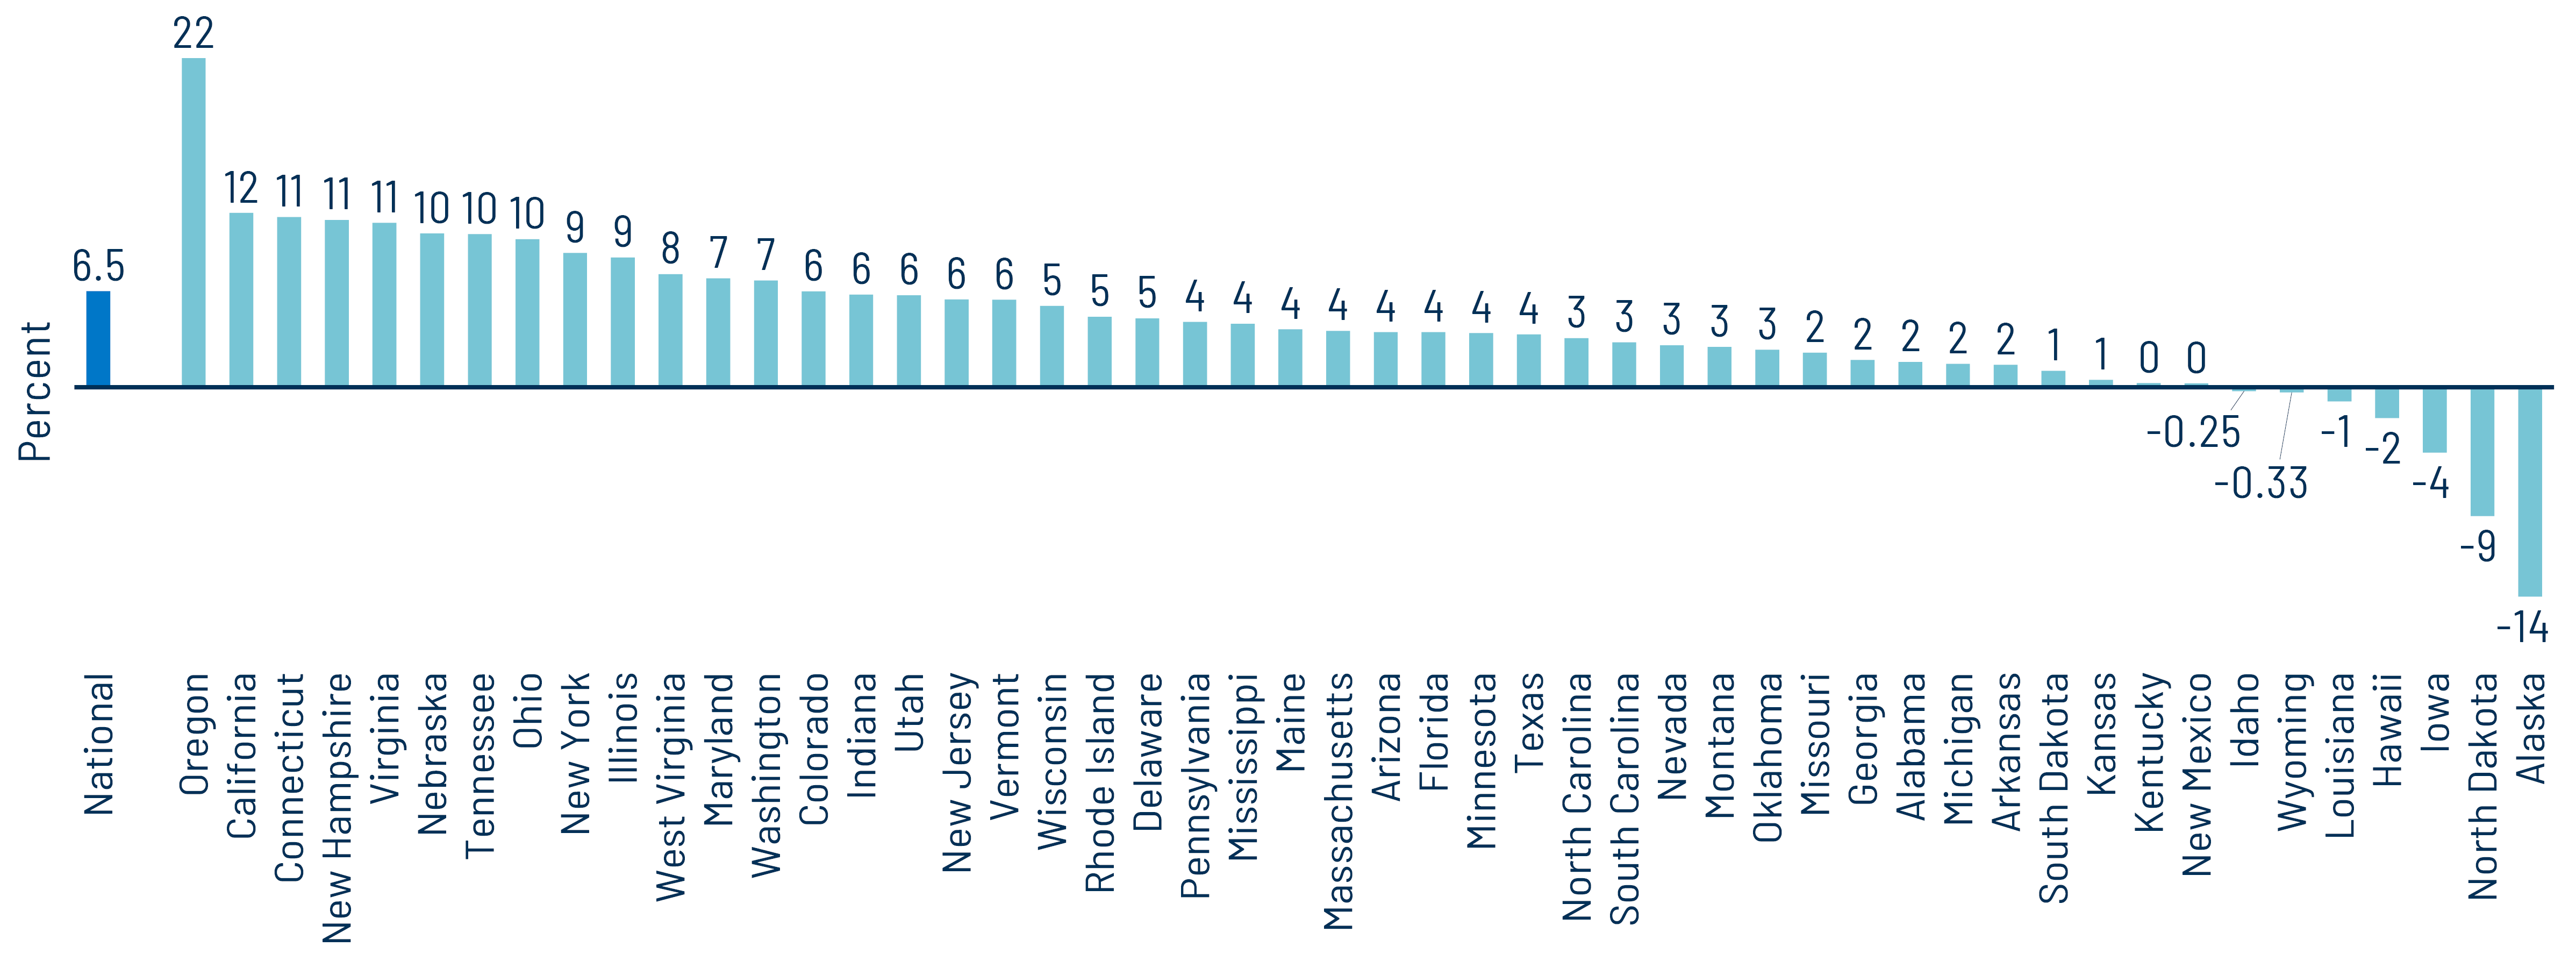
At the state level, all but seven states recorded growth in major tax collections over the past 12 months, with total state tax collections increasing 6.5% YoY on average. Oregon, up 22% YoY, California, up 12%, and Connecticut, up 12%, posted the strongest gains. Conversely, energy-focused Alaska, was down 14%, and North Dakota, down 8%, experienced the largest YoY declines.
Resilient economic growth and a strong labor market continue to support record tax collection levels and municipal credit fundamentals. As state and local governments navigate lower federal support and inflationary pressures, these elevated revenues should help preserve overall credit stability and fiscal flexibility, which have historically underpinned the high quality of the municipal asset class.
Municipal Credit Curves and Relative Value
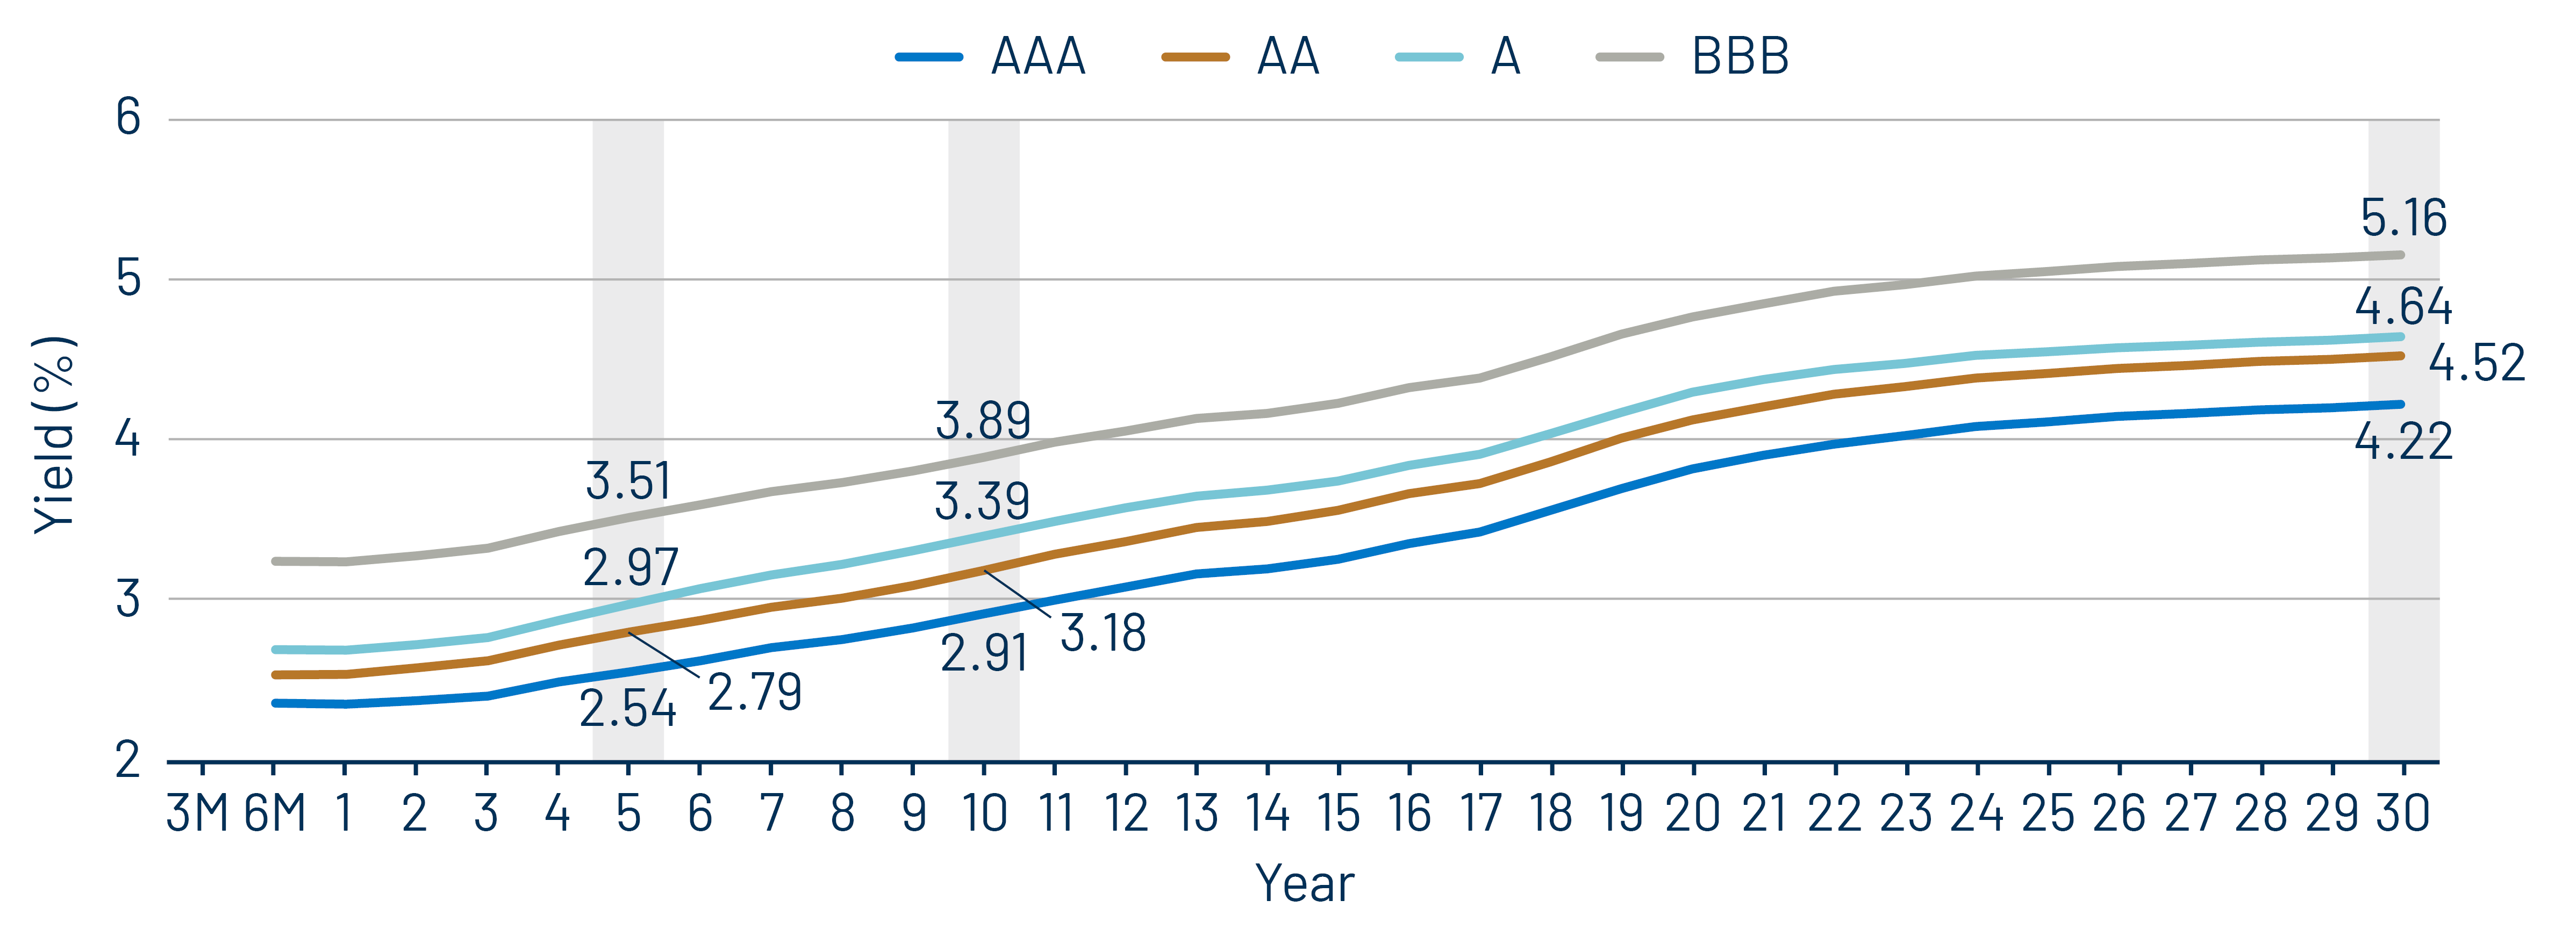
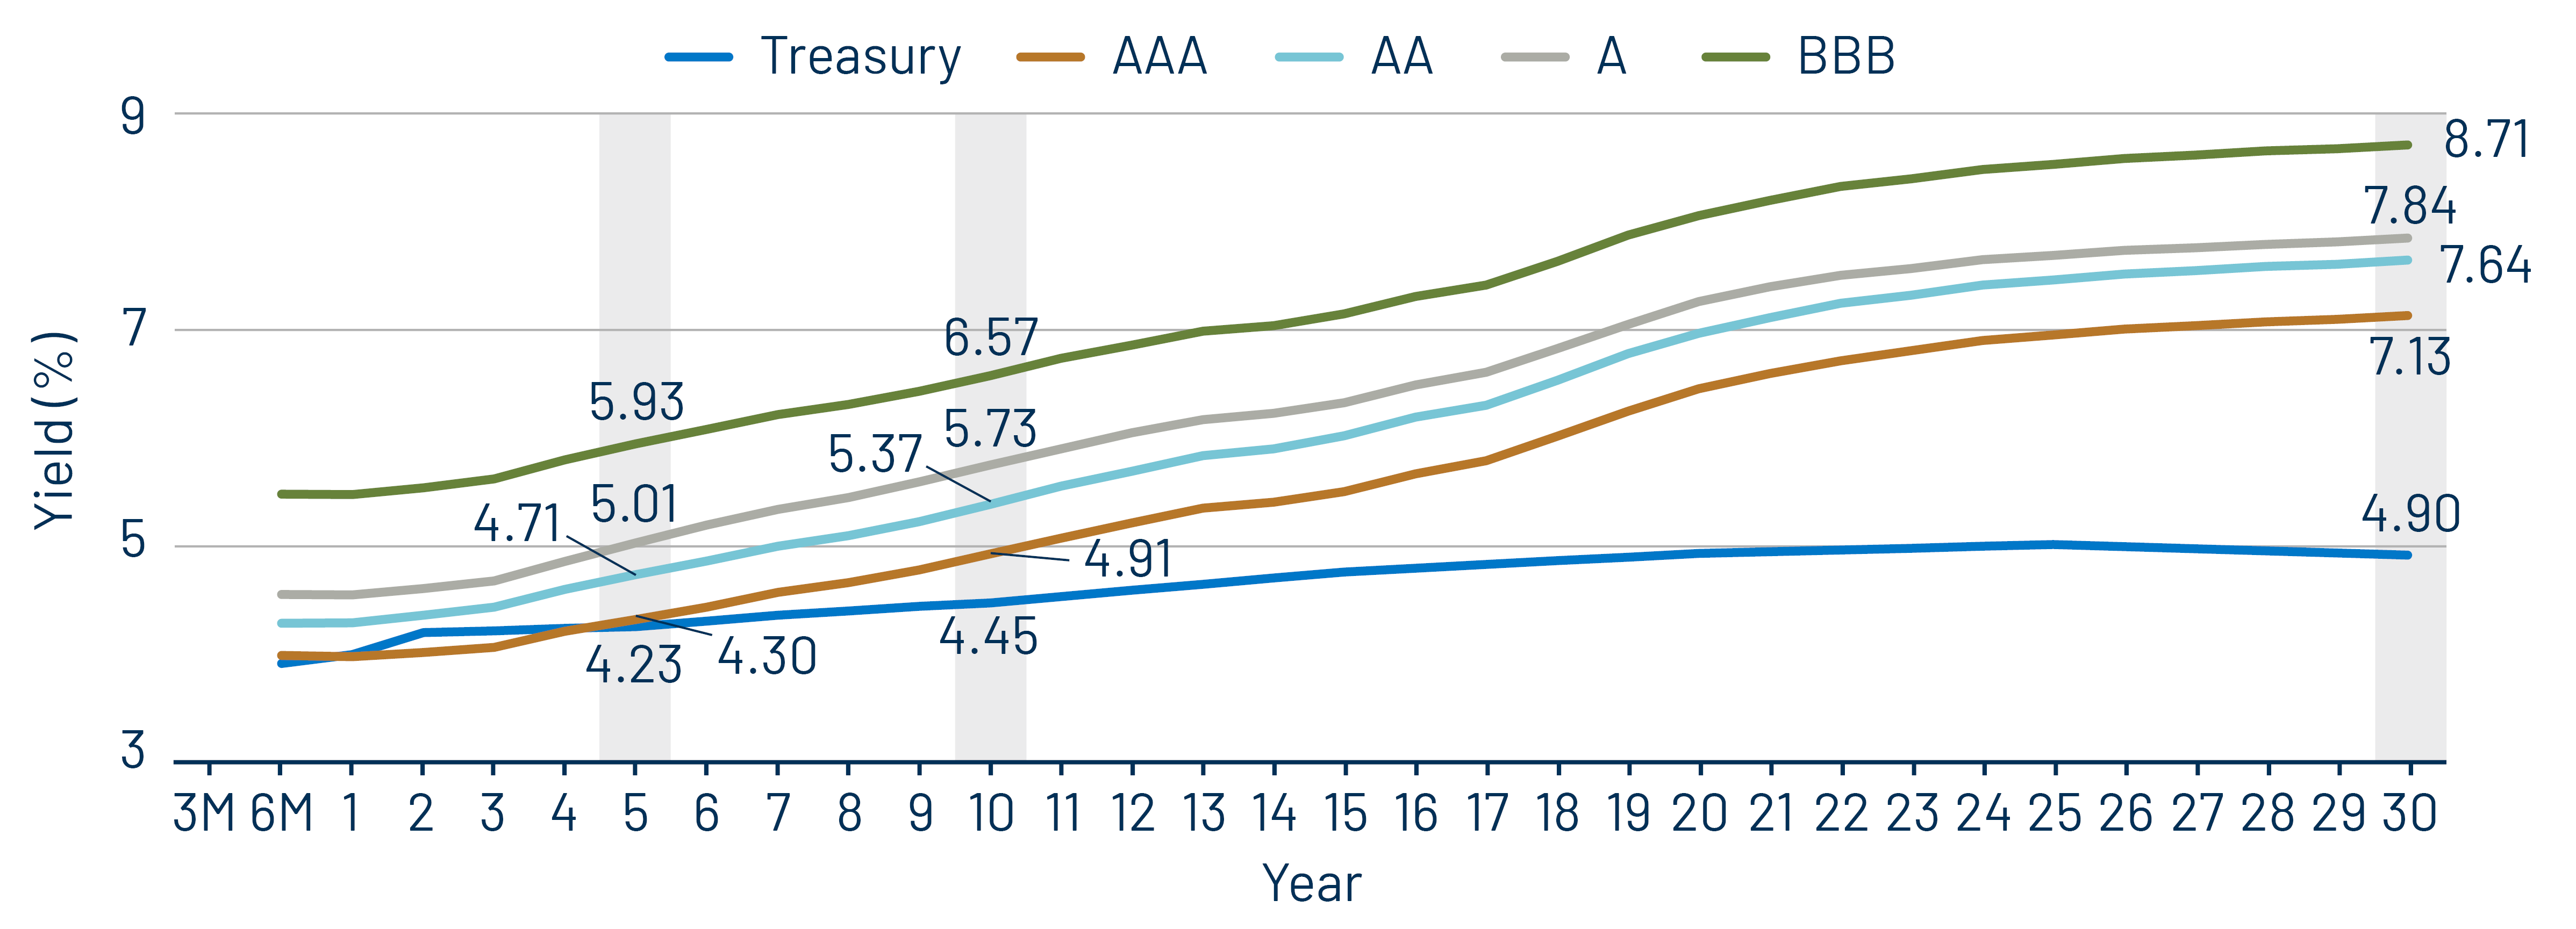
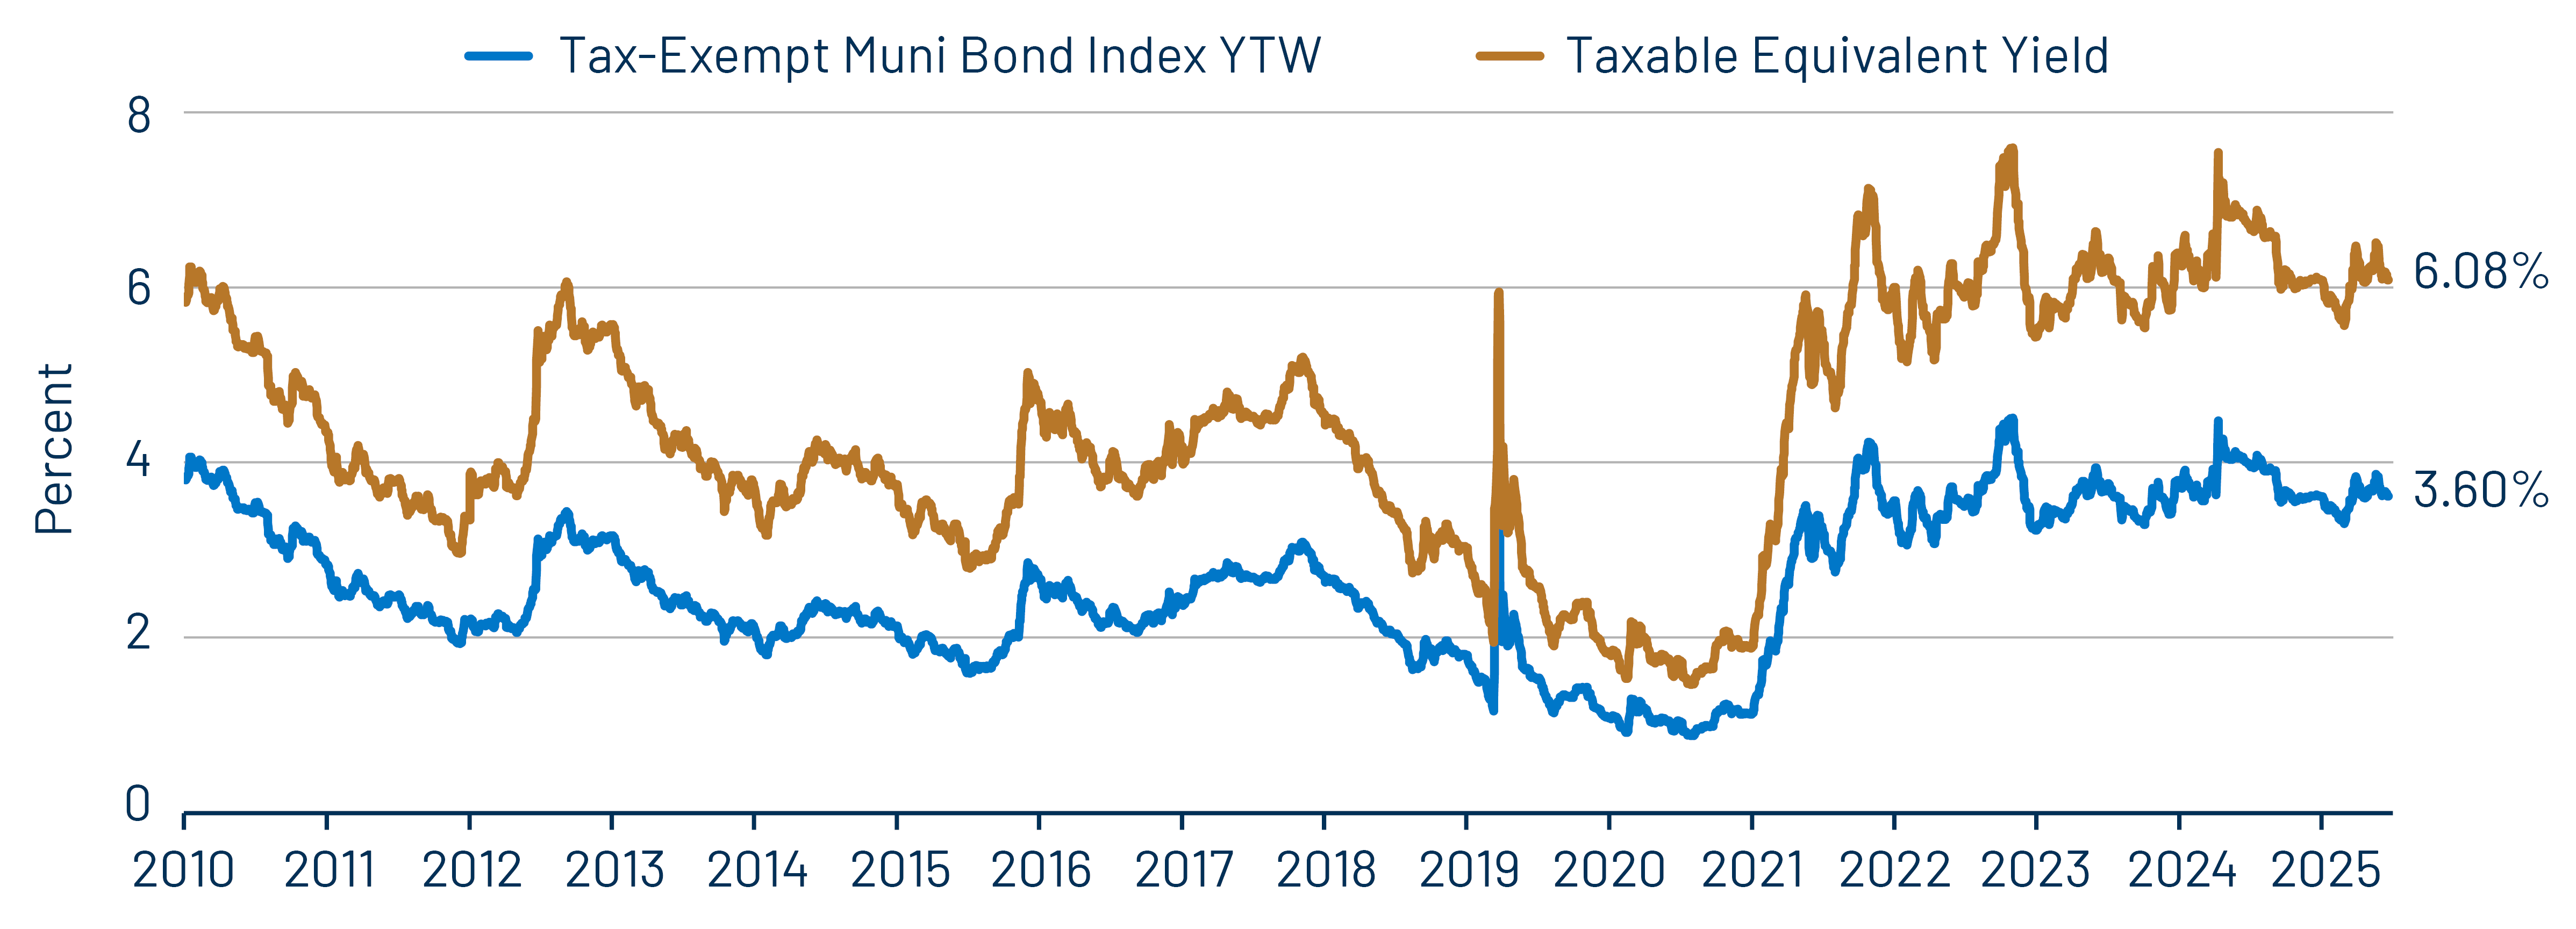
Theme 1: Municipal taxable-equivalent yields moved lower from recent highs, but remain above historical averages.
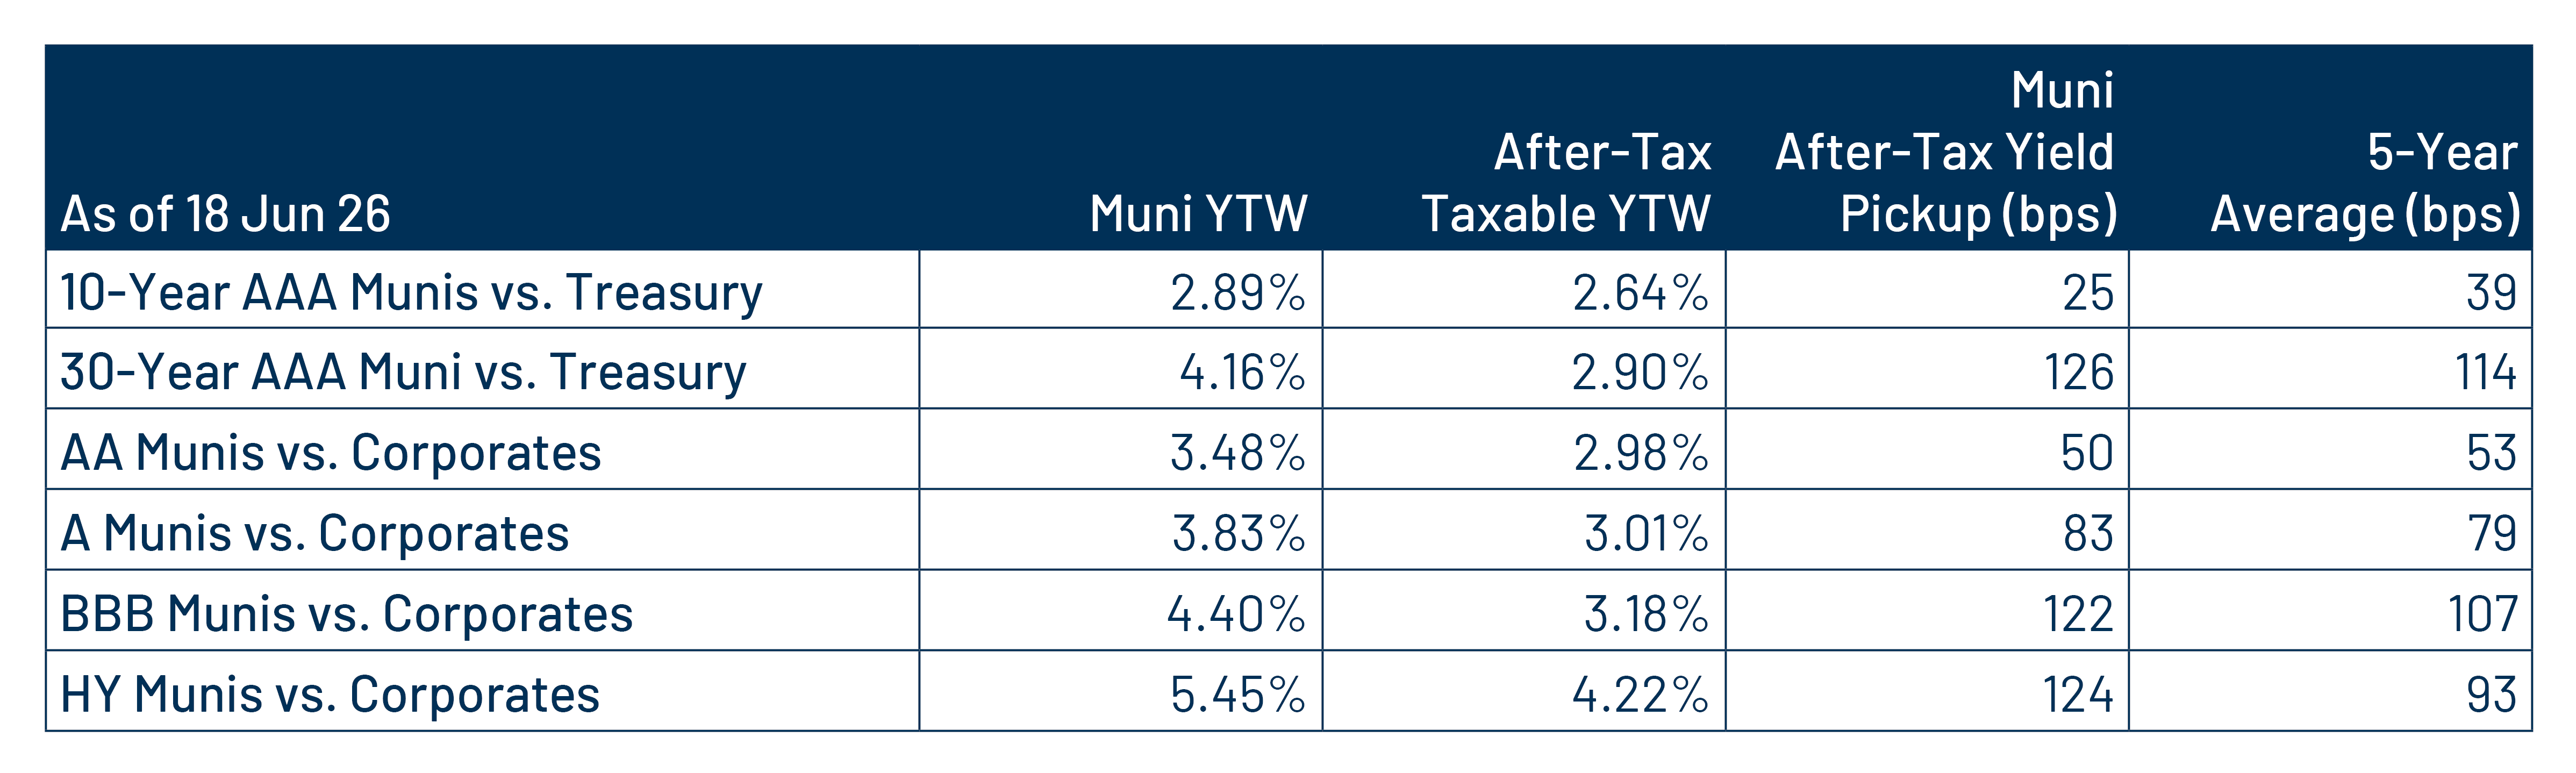
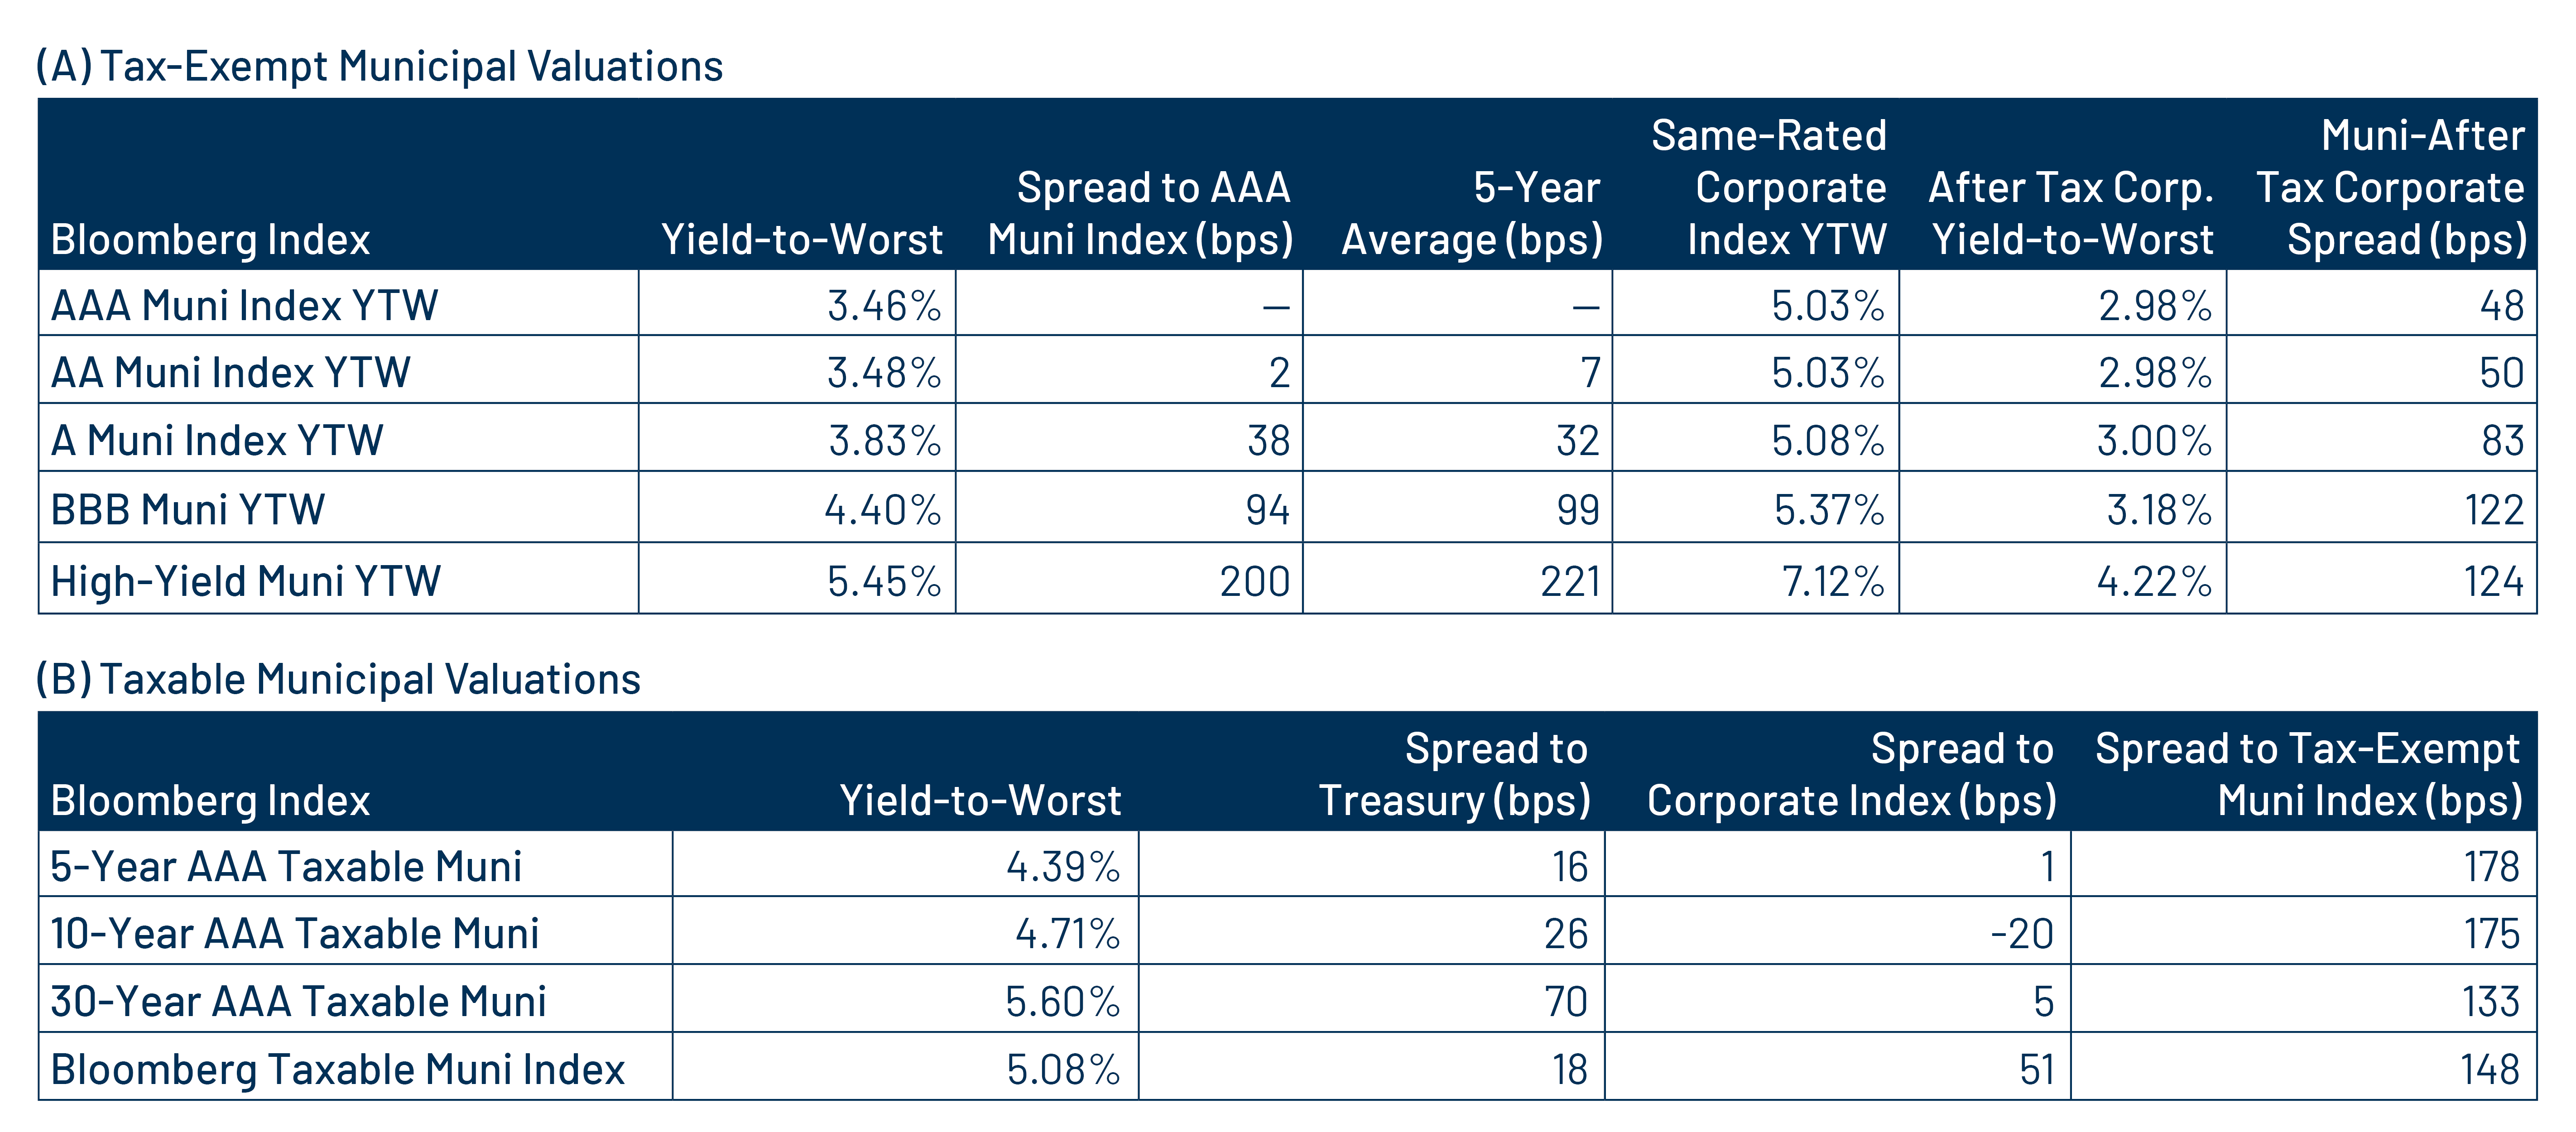
Theme 2: Munis offer attractive after-tax yield pickup vs. longer-duration or lower-quality taxable alternatives.
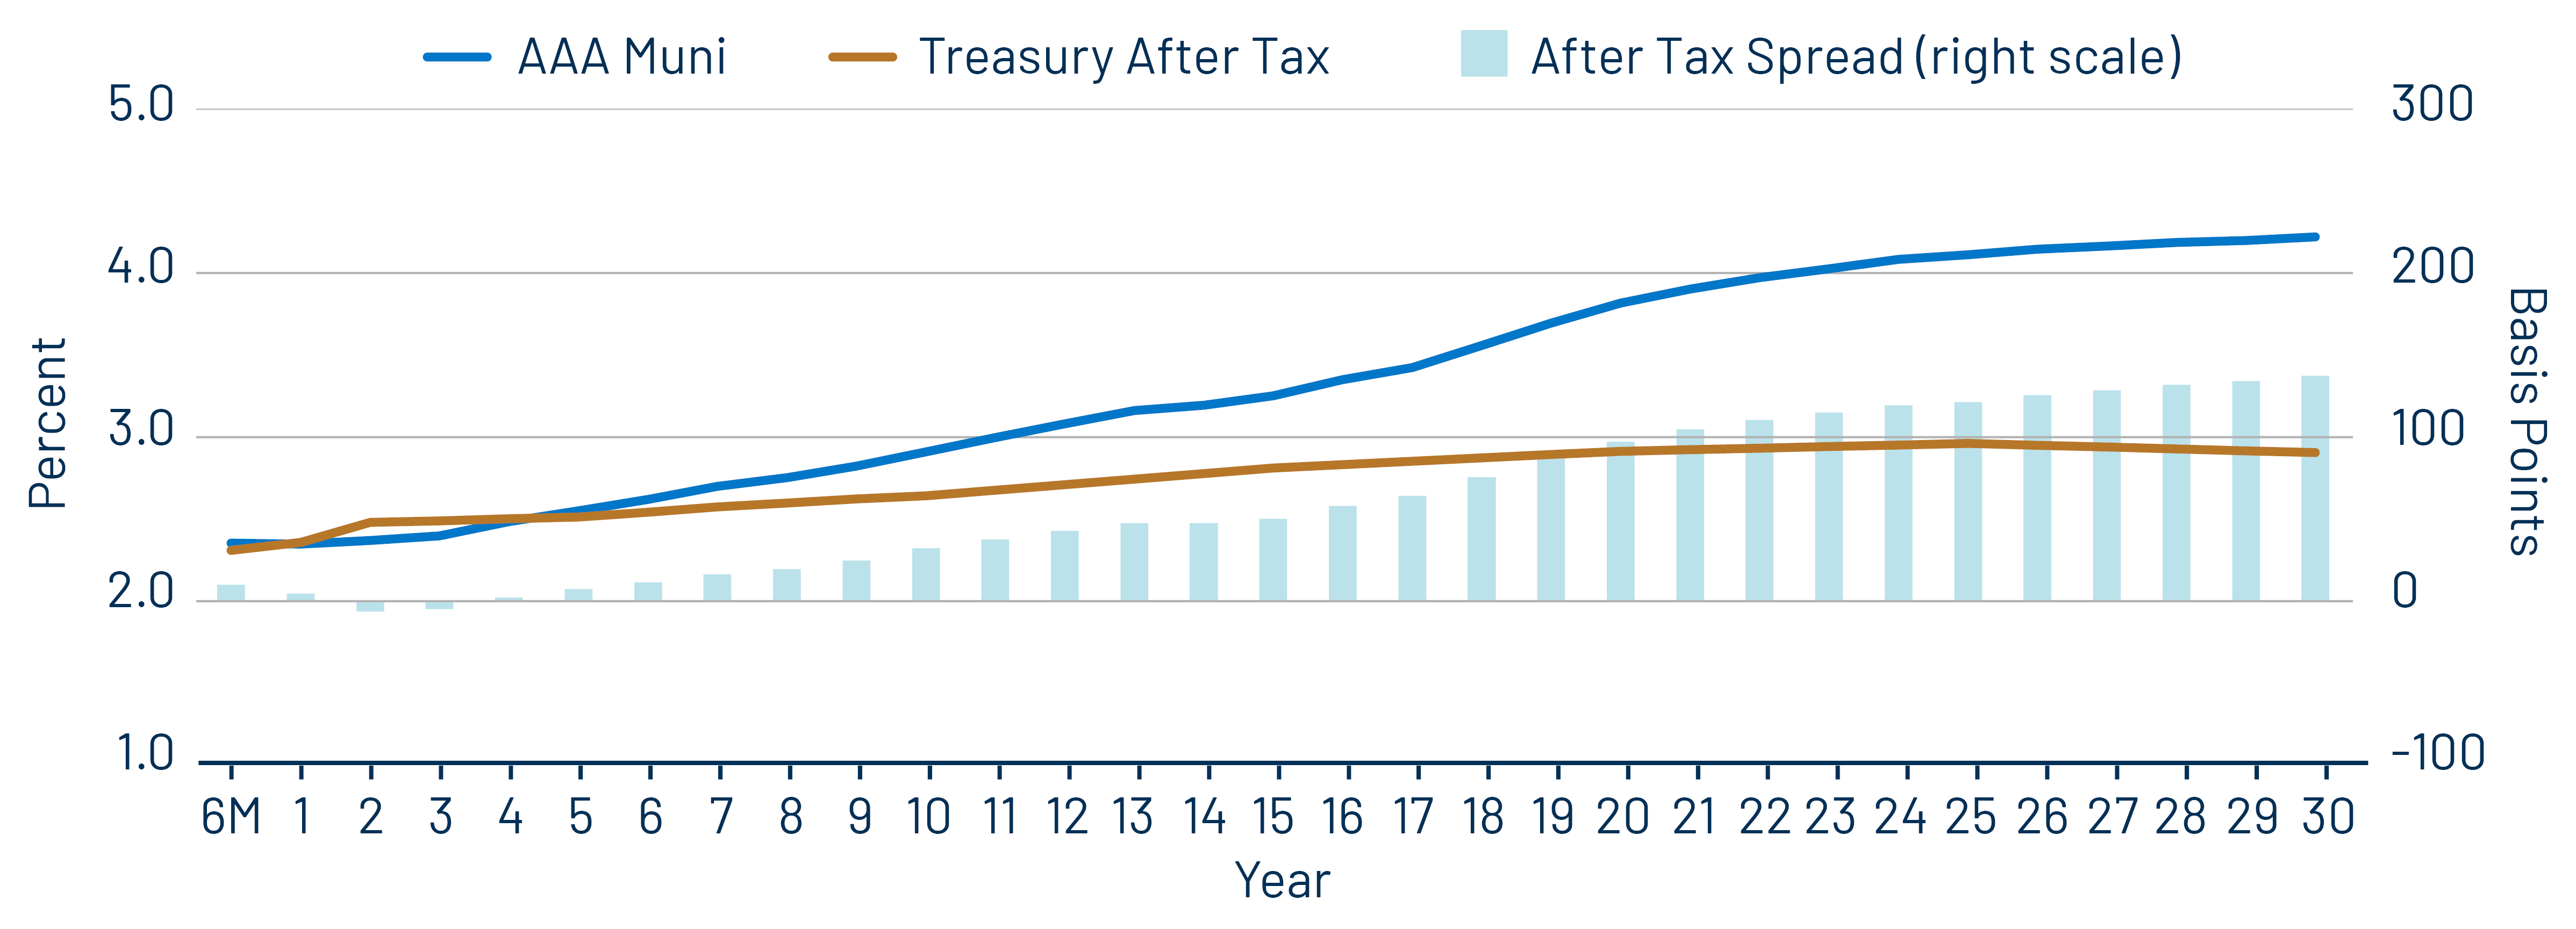
Theme 3: The muni curve remains steep and offers relative value in longer maturities.