skip navigation
Western Asset Management Company
Blog

Stay up to date on timely topics and market events. Subscribe to our Blog now.

MARKETS
February 03, 2026

Weekly Municipal Monitor—State and Local Tax Collections Remain Strong

By Sam Weitzman

Stay up to date on timely topics and market events. Subscribe to our Blog now.

Macros, Markets and Munis

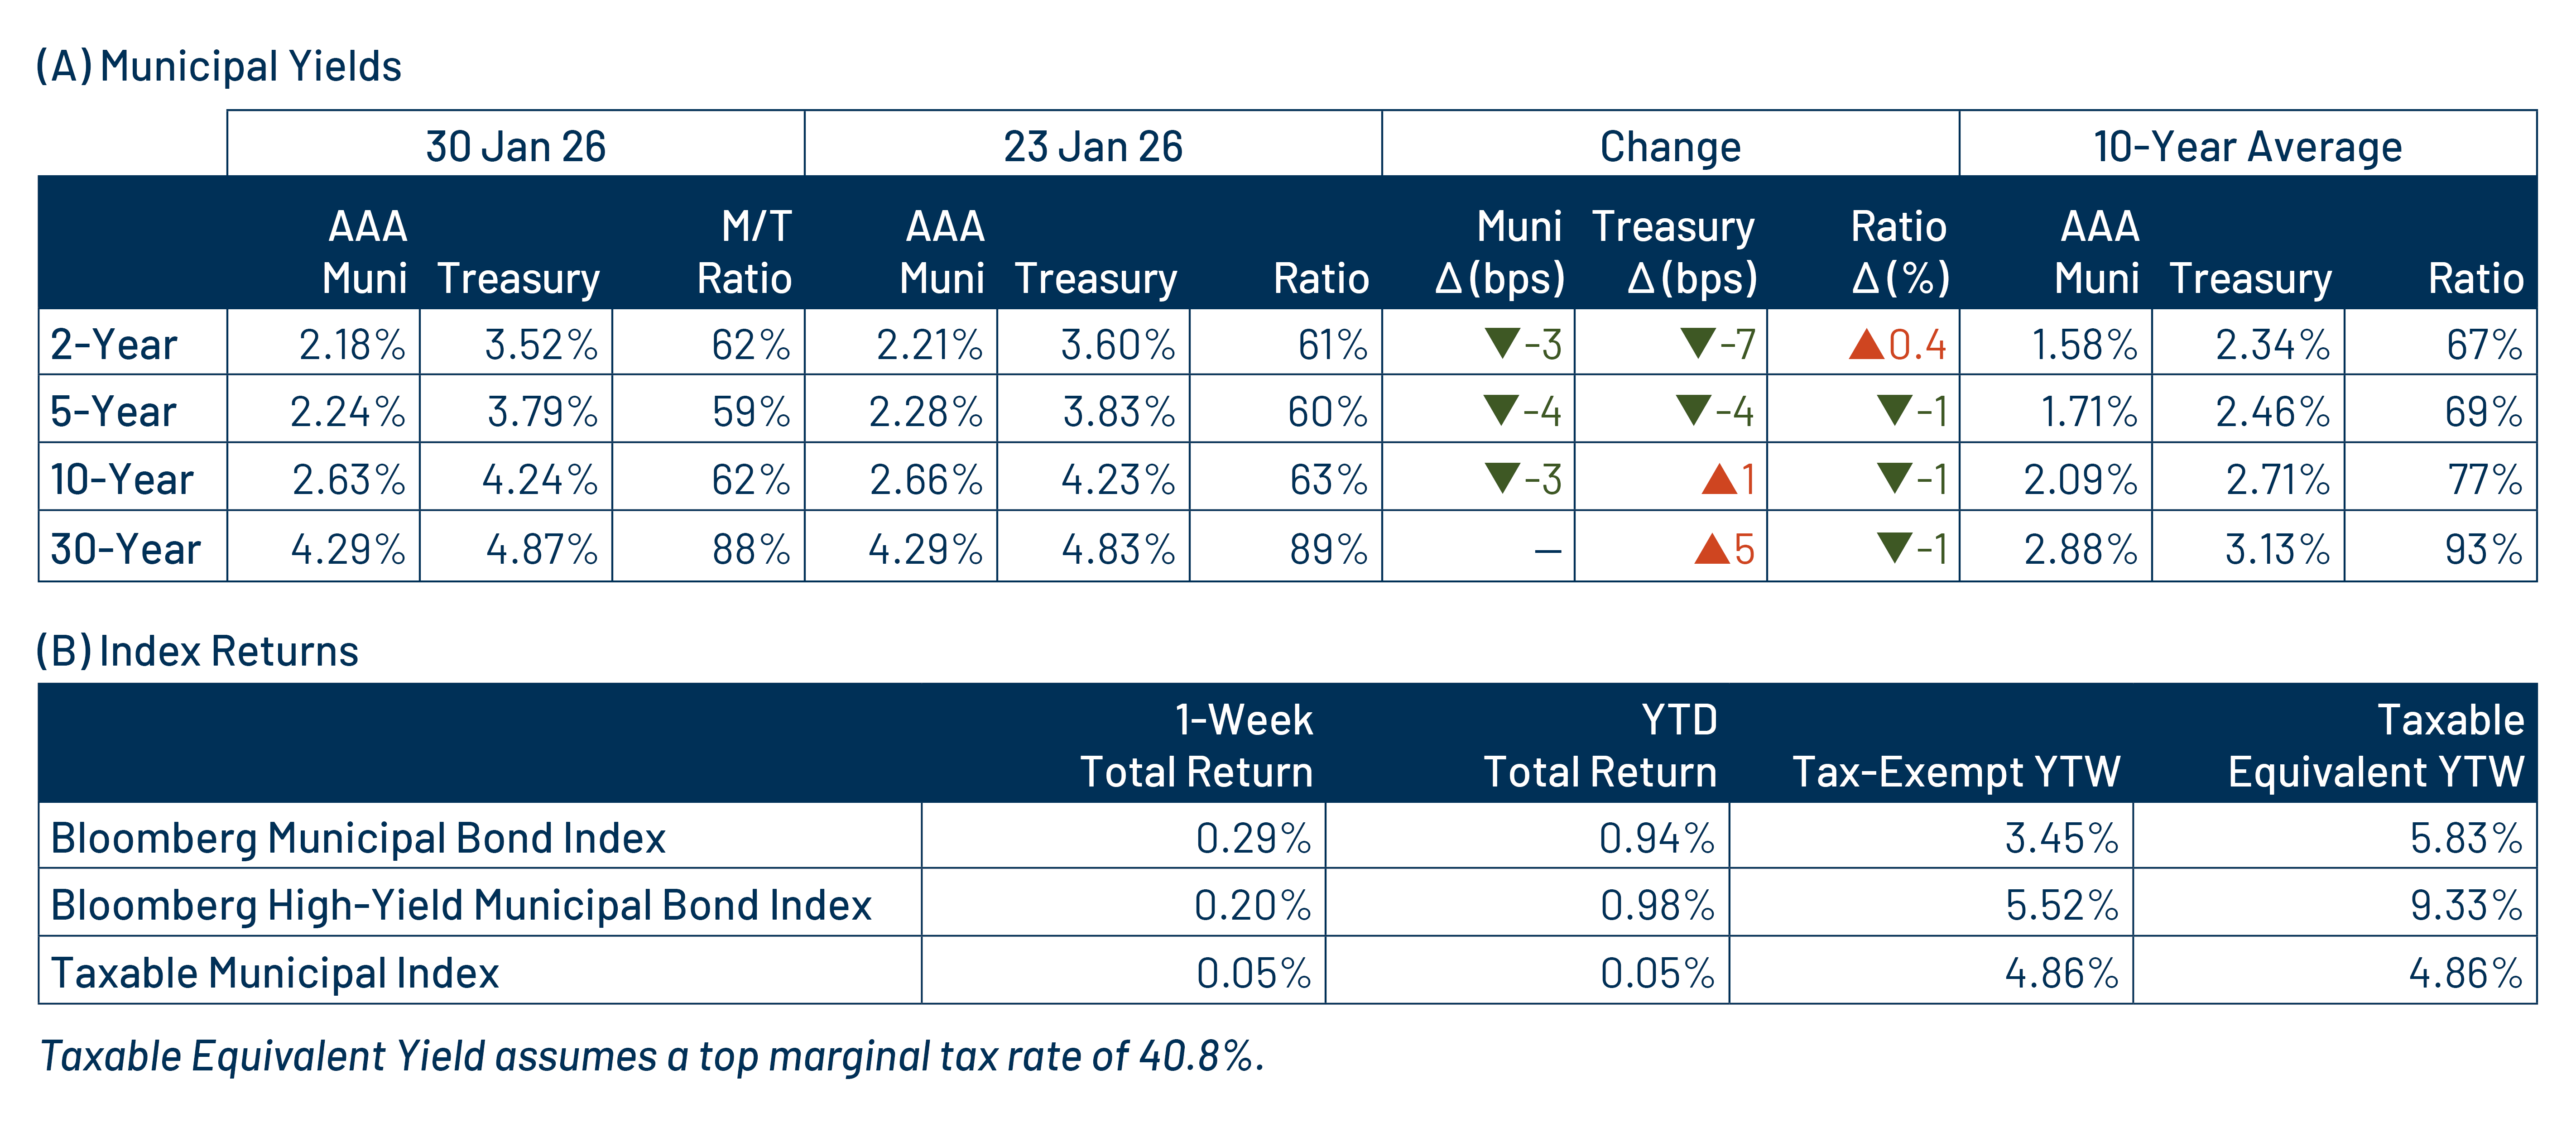
Munis posted positive returns and outperformed US taxable fixed-income last week. Fixed-income markets were focused on the Federal Open Market Committee (FOMC) meeting last week, which resulted in keeping rates unchanged as anticipated and included dovish language around labor market stabilization in its press release. The week closed with President Trump’s announcement to nominate Kevin Warsh as the successor to Jerome Powell as the Federal Reserve Chair. The Treasury curve steepened during the week, with yields moving 4-7 basis points (bps) lower in shorter maturities and 1 to 5 bps higher farther out the curve. Municipals outperformed amid strong supply and demand technical conditions as demand accelerated and new-issue supply was modest. Following the release of state and local tax collection estimates from the Census last month, this week we provide an update on state and local revenue drivers.

Technicals Strengthened Amid Strong Inflows, Lighter Supply Conditions

Fund Flows ($2.1 billion of net inflows): During the week ending January 28, weekly reporting municipal mutual funds recorded $2.1 billion of net inflows, according to Lipper. Long-term, intermediate and short-term categories recorded $1.0 billion, $603 million and $239 million of inflows, respectively. Last week’s inflows marked the 10th consecutive week of net inflows and led year-to-date (YTD) inflows higher to $6 billion.

Supply (YTD supply of $36 billion; up 23% YoY): The muni market recorded $5 billion of new-issue supply last week, down 58% from the prior week. The YTD new-issue supply of $36 billion is 23% higher than the prior year, with tax-exempt issuance up 23% year-over-year (YoY) and taxable issuance up 11%, respectively. This week’s calendar is expected to remain lighter at $6 billion. The largest deals include $718 million Goldman Sachs Black Belt Energy and $750 million Triborough Bridge and Tunnel Authority transactions.

This Week in Munis: State and Local Tax Collections Remain Strong

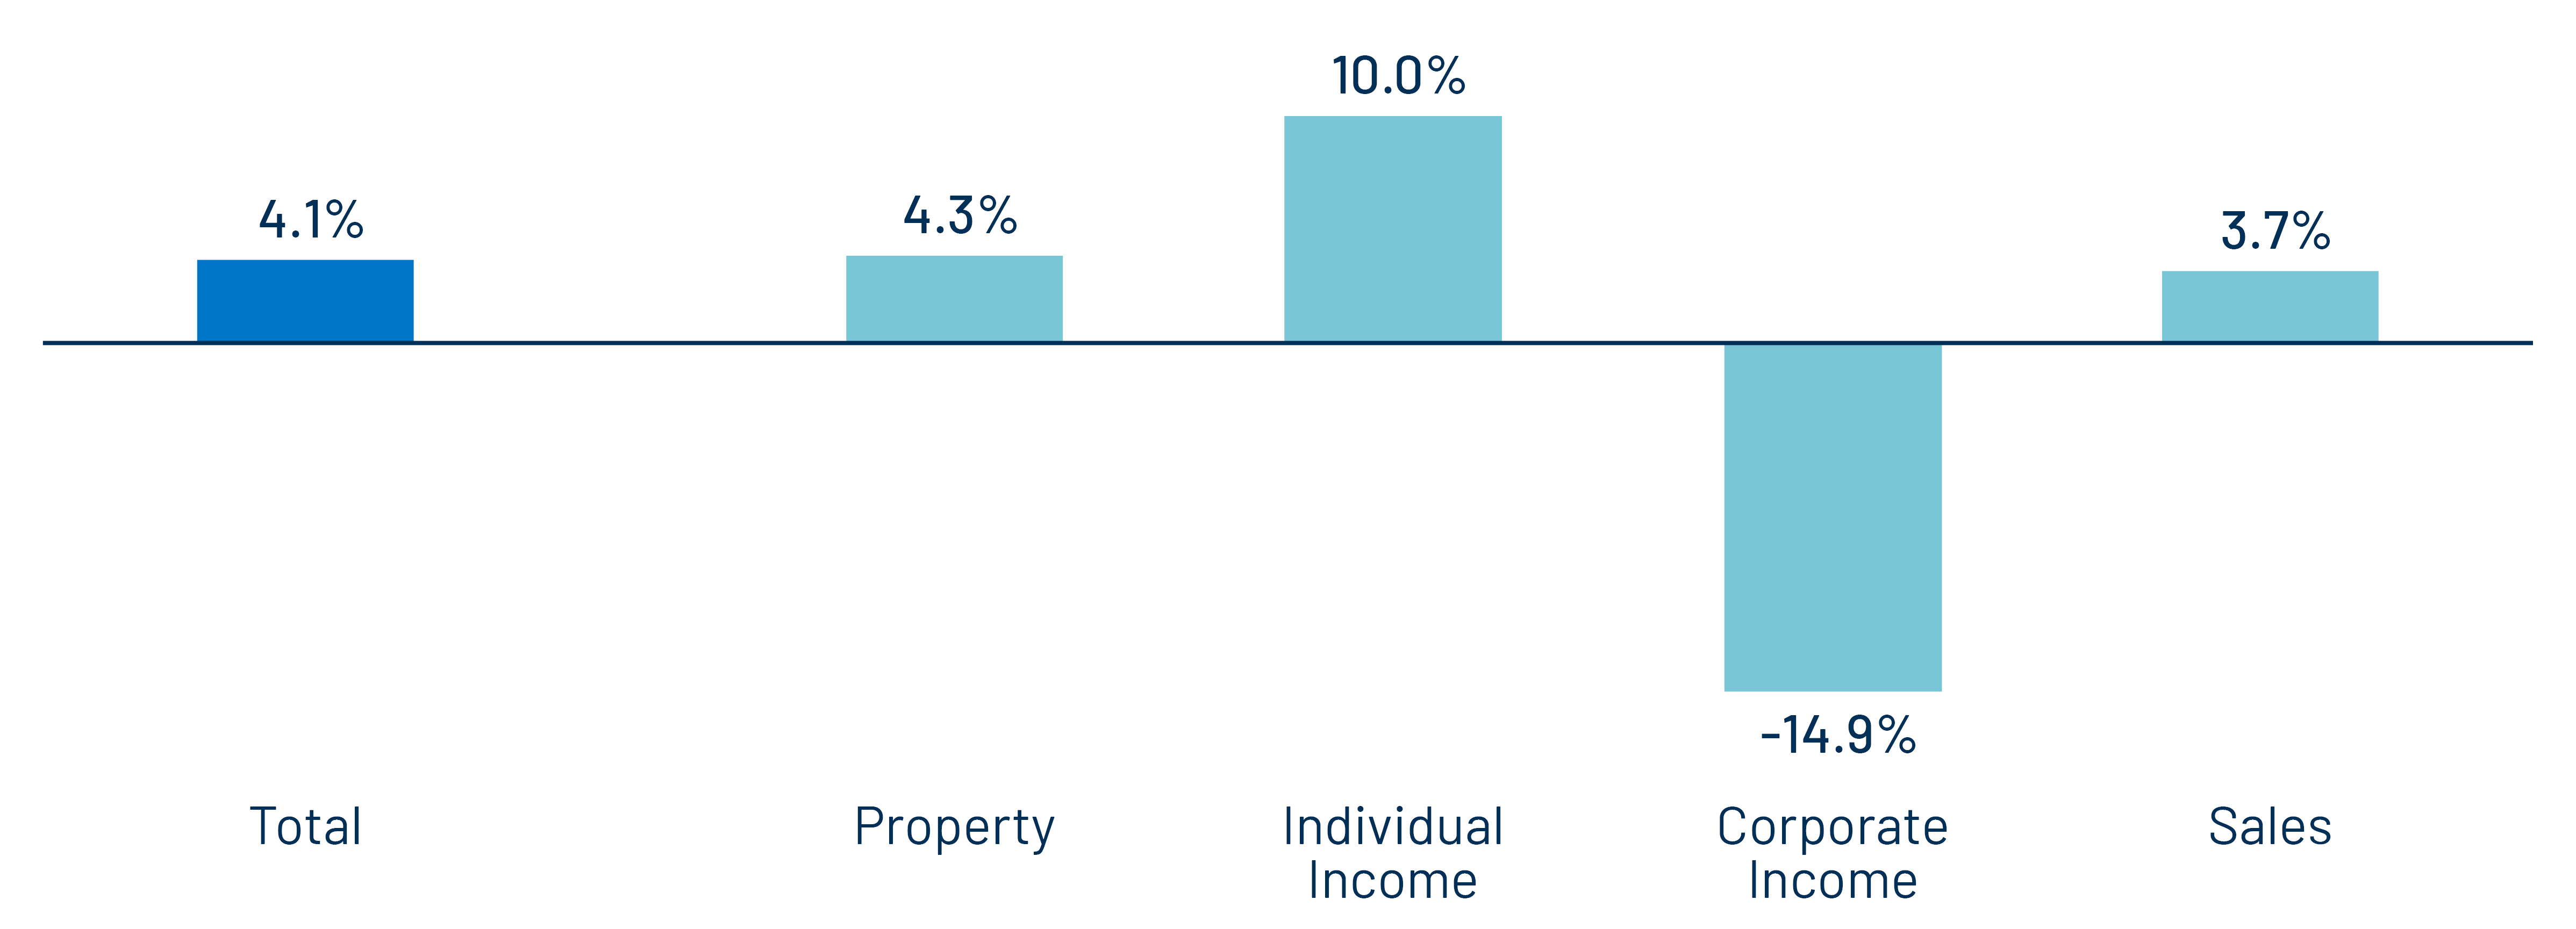
In January, the Census released 3Q25 state and local tax collection estimates, which were delayed due to the government shutdown but underscored continued resilience for traditional state and local credit conditions. State and local government tax collections increased 4.1% in 3Q25 from 3Q24 levels to $562 billion. Among the major state revenue sources, individual income taxes increased 10.0%, sales tax collections increased 3.7% YoY, while corporate income tax collections declined 14.9%. Property tax collections, the primary source of revenues for local governments, increased 4.3% YoY.

Exhibit 1: 3Q25 YoY Revenue Growth
3Q25 YoY Revenue Growth
Source: Census, Western Asset. As of 15 Jan 26. Major state and local tax revenue is not seasonally adjusted. Select the image to expand the view.

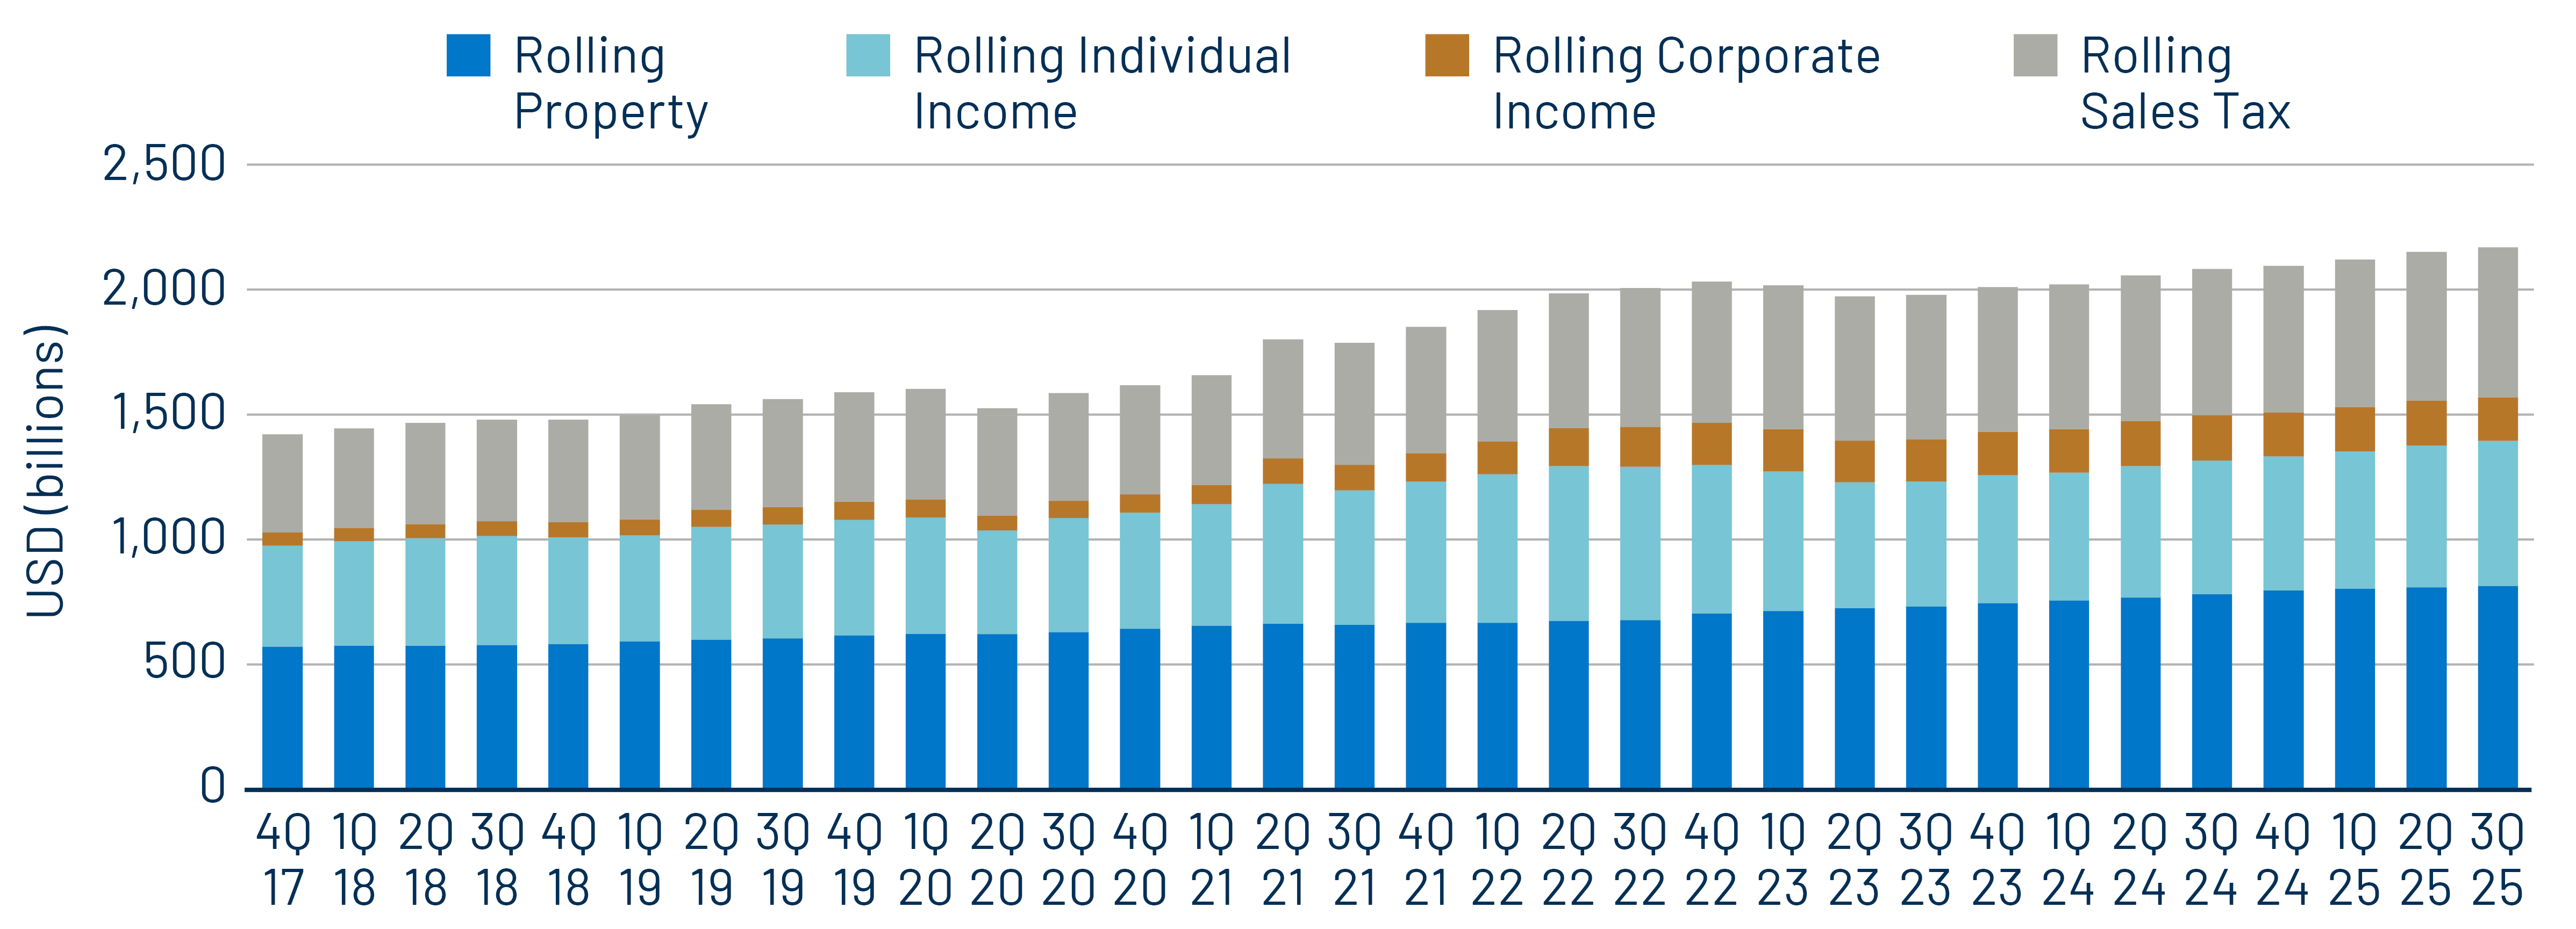
Twelve-month trailing collections increased 4.2% YoY to $2.2 trillion, marking a record high according to Census data. On a 12-month trailing basis, individual income tax collections increased 8.6% YoY and sales tax collections increased 2.6%, while corporate income tax collections declined 3.6%. Twelve-month rolling property tax collections increased 4.2% YoY.

Exhibit 2: 12-Month Trailing State and Local Revenue Collections
12-Month Trailing State and Local Revenue Collections
Source: Census, Western Asset. As of 15 Jan 26. Major state and local tax revenue is not seasonally adjusted. Select the image to expand the view.

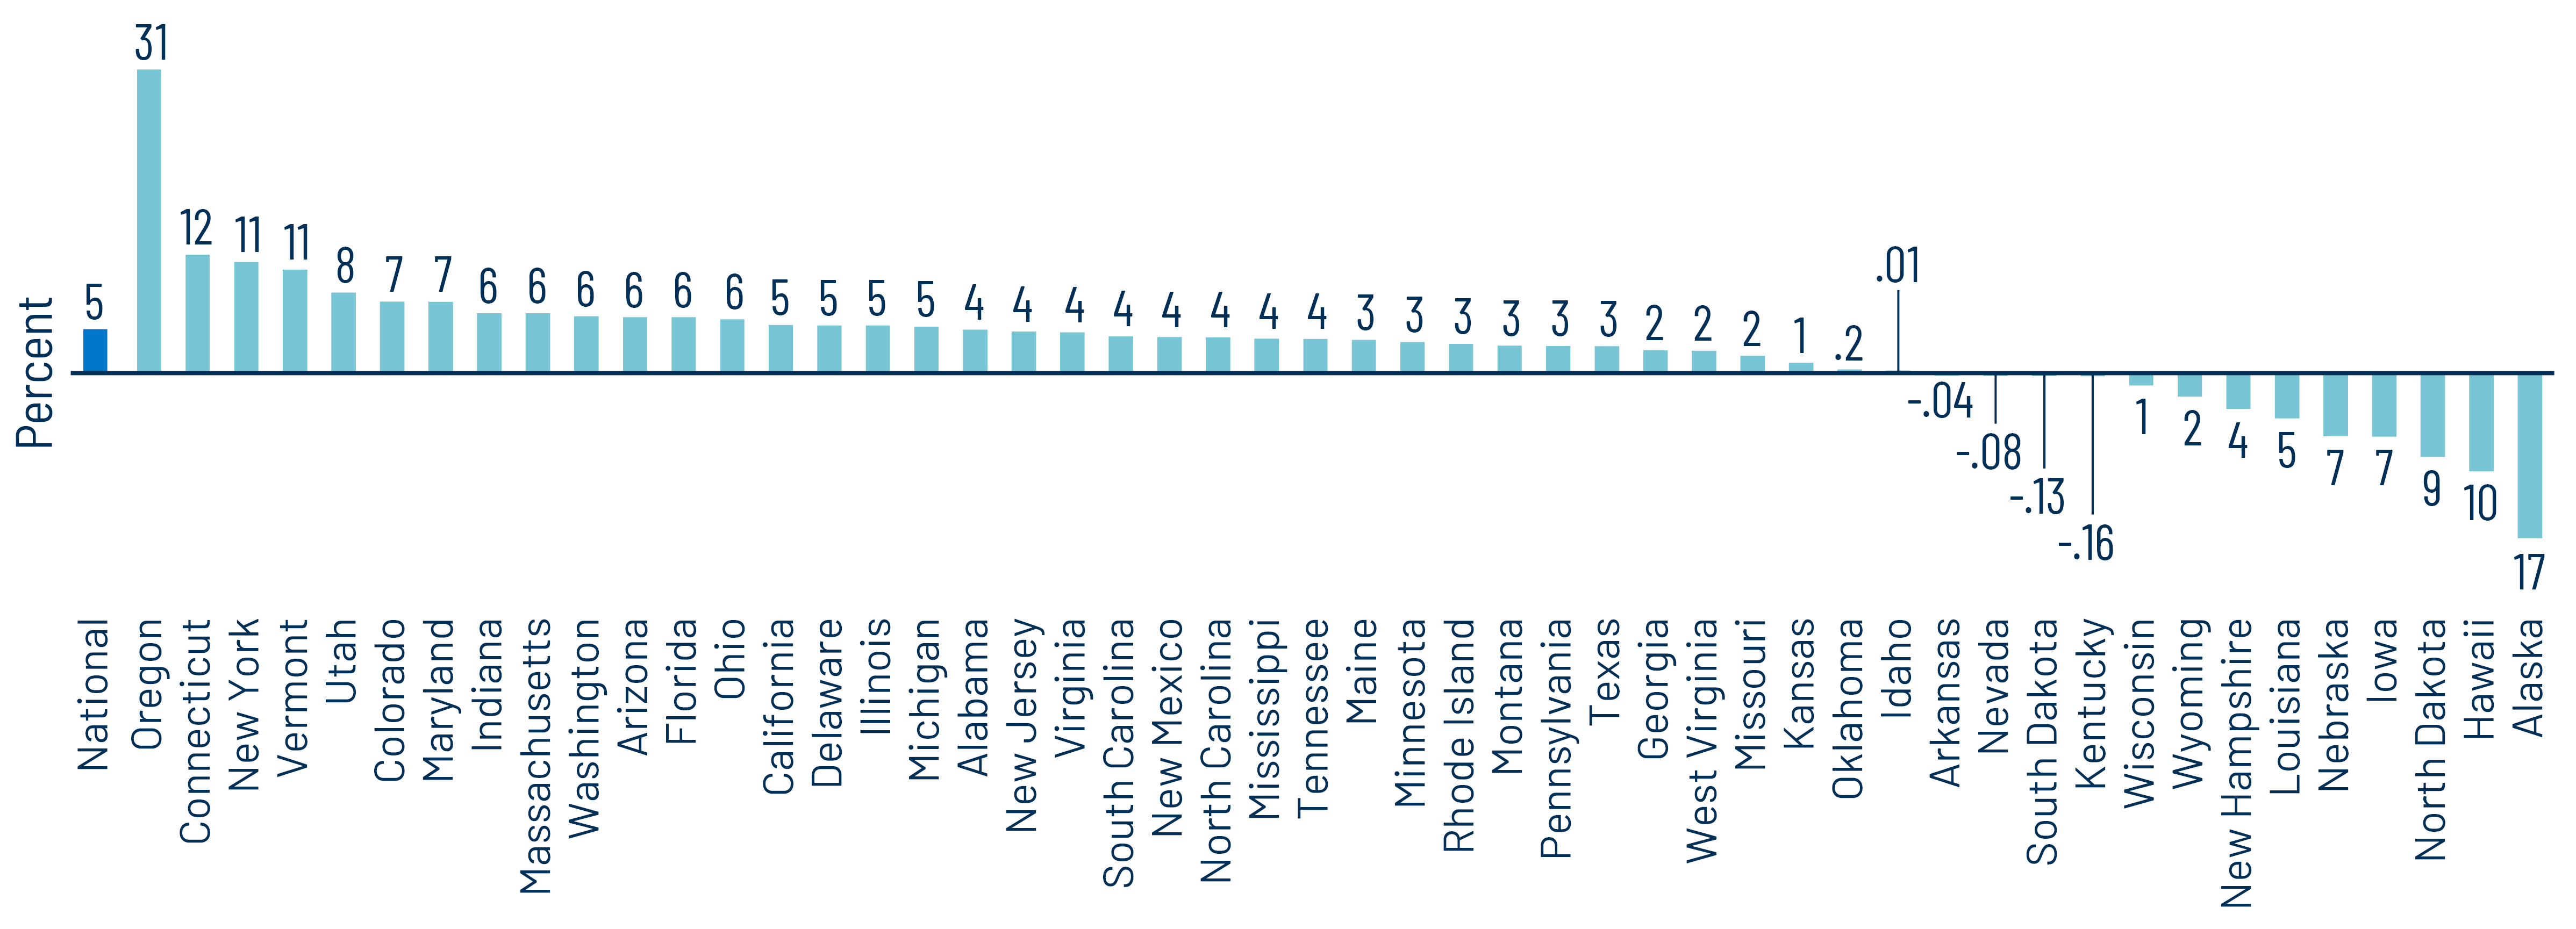
From a state perspective, the Census estimates that most states recorded revenue increases over the trailing 12 months, with total state tax collections increasing 4.6%. On a YoY basis, Oregon (+31%), New York (+13%) and Connecticut (+12%) recorded the highest growth in estimated tax revenue. Conversely, Alaska (-17%), Hawaii (-10%) and North Dakota (-9%) saw the sharpest 12-month trailing YoY declines.

Exhibit 3: YoY Change in 12-Month Trailing State and Local Revenue Collections
YoY Change in 12-Month Trailing State and Local Revenue Collections
Source: Census, Western Asset. As of 15 Jan 26. Major state and local tax revenue is not seasonally adjusted. Select the image to expand the view.

The continued growth in state and local tax collections highlights the resilience of these revenue streams, which consistently surpass US GDP growth. Despite recent softening, we expect the labor market and consumer spending to remain supportive of tax collections and municipal credit conditions over the medium term. However, tax collection performance will likely become more critical for budgets if federal spending reductions impact broader state and local funding or challenge labor conditions.

Exhibit 4: Muni Credit Curves
Muni Credit Curves
Source: Bloomberg, Western Asset. As of 30 Jan 26. Bloomberg Valuation Service (BVAL) Municipal Credit Indices (AAA, AA, A, BBB, respectively) and US Sovereign Curves. Taxable-Equivalent Muni Credit Curves consider the top marginal effective tax rate of 40.8%. AA Muni is represented by the US General Obligation AA Muni BVAL Yield Curve. The BVAL curve is populated with pricing from uninsured AA General Obligation bonds. A Muni is represented by the US General Obligation A Muni BVAL Yield Curve. The BVAL curve is populated with pricing from uninsured A General Obligation bonds. BBB Muni is represented by the US General Obligation BBB Muni BVAL Yield Curve. The BVAL curve is populated with pricing from uninsured BBB General Obligation bonds. Indices are unmanaged and one cannot directly invest in them. They do not include fees, expenses or sales charges. Past performance is not an indicator or a guarantee of future results. Select the image to expand the view.
Exhibit 5: Taxable-Equivalent Muni Credit Curves
Taxable-Equivalent Muni Credit Curves
Source: Bloomberg, Western Asset. As of 30 Jan 26. Bloomberg Valuation Service (BVAL) Municipal Credit Indices (AAA, AA, A, BBB, respectively) and US Sovereign Curves. Taxable-Equivalent Muni Credit Curves consider the top marginal effective tax rate of 40.8%. AA Muni is represented by the US General Obligation AA Muni BVAL Yield Curve. The BVAL curve is populated with pricing from uninsured AA General Obligation bonds. A Muni is represented by the US General Obligation A Muni BVAL Yield Curve. The BVAL curve is populated with pricing from uninsured A General Obligation bonds. BBB Muni is represented by the US General Obligation BBB Muni BVAL Yield Curve. The BVAL curve is populated with pricing from uninsured BBB General Obligation bonds. Indices are unmanaged and one cannot directly invest in them. They do not include fees, expenses or sales charges. Past performance is not an indicator or a guarantee of future results. Select the image to expand the view.
Exhibit 6: AAA Munis vs. Treasuries
AAA Munis vs. Treasuries
Source: Muni Yields: Thomson Reuters MMD, Treasury Yields: Bloomberg. As of 30 Jan 26. Past performance is not a guarantee of future results. It is not possible to invest directly in an index. Select the image to expand the view.
Exhibit 7: Tax-Exempt and Taxable Muni Valuations
Tax-Exempt and Taxable Muni Valuations
Source: Bloomberg, Western Asset. As of 30 Jan 26. Yield-to-worst (YTW) is the lowest potential yield that can be received on a bond without the issuer actually defaulting. AAA, AA, A, BBB Corporate Indices; After-Tax Yield assumes a top effective tax rate of 40.8%. Taxable Muni Index Corporate comparable used is the Global Corporate Aggregate (ex. BBB) to better align credit quality and duration. Select the image to expand the view.

Western Asset Key Themes for Muni Investors

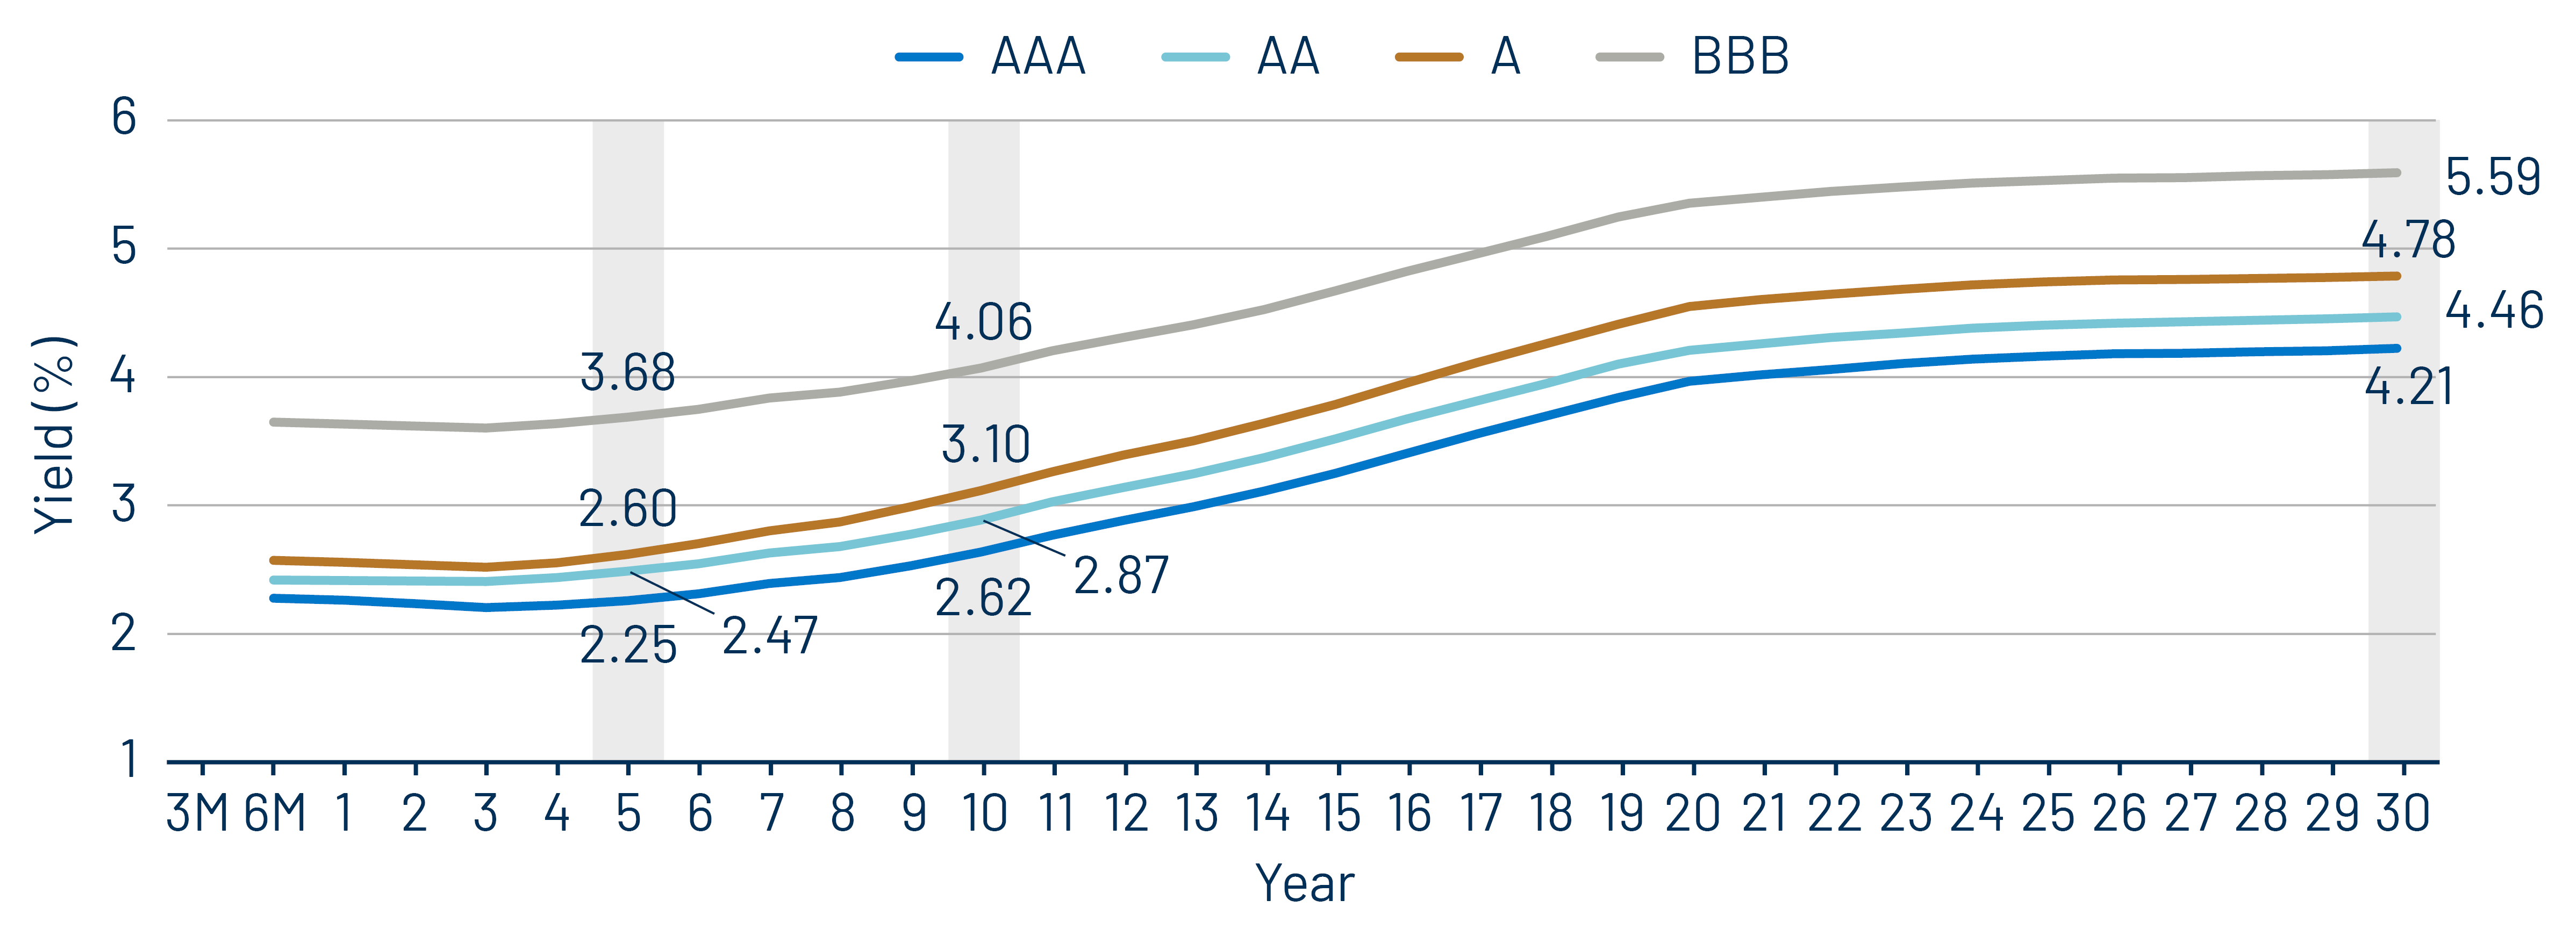
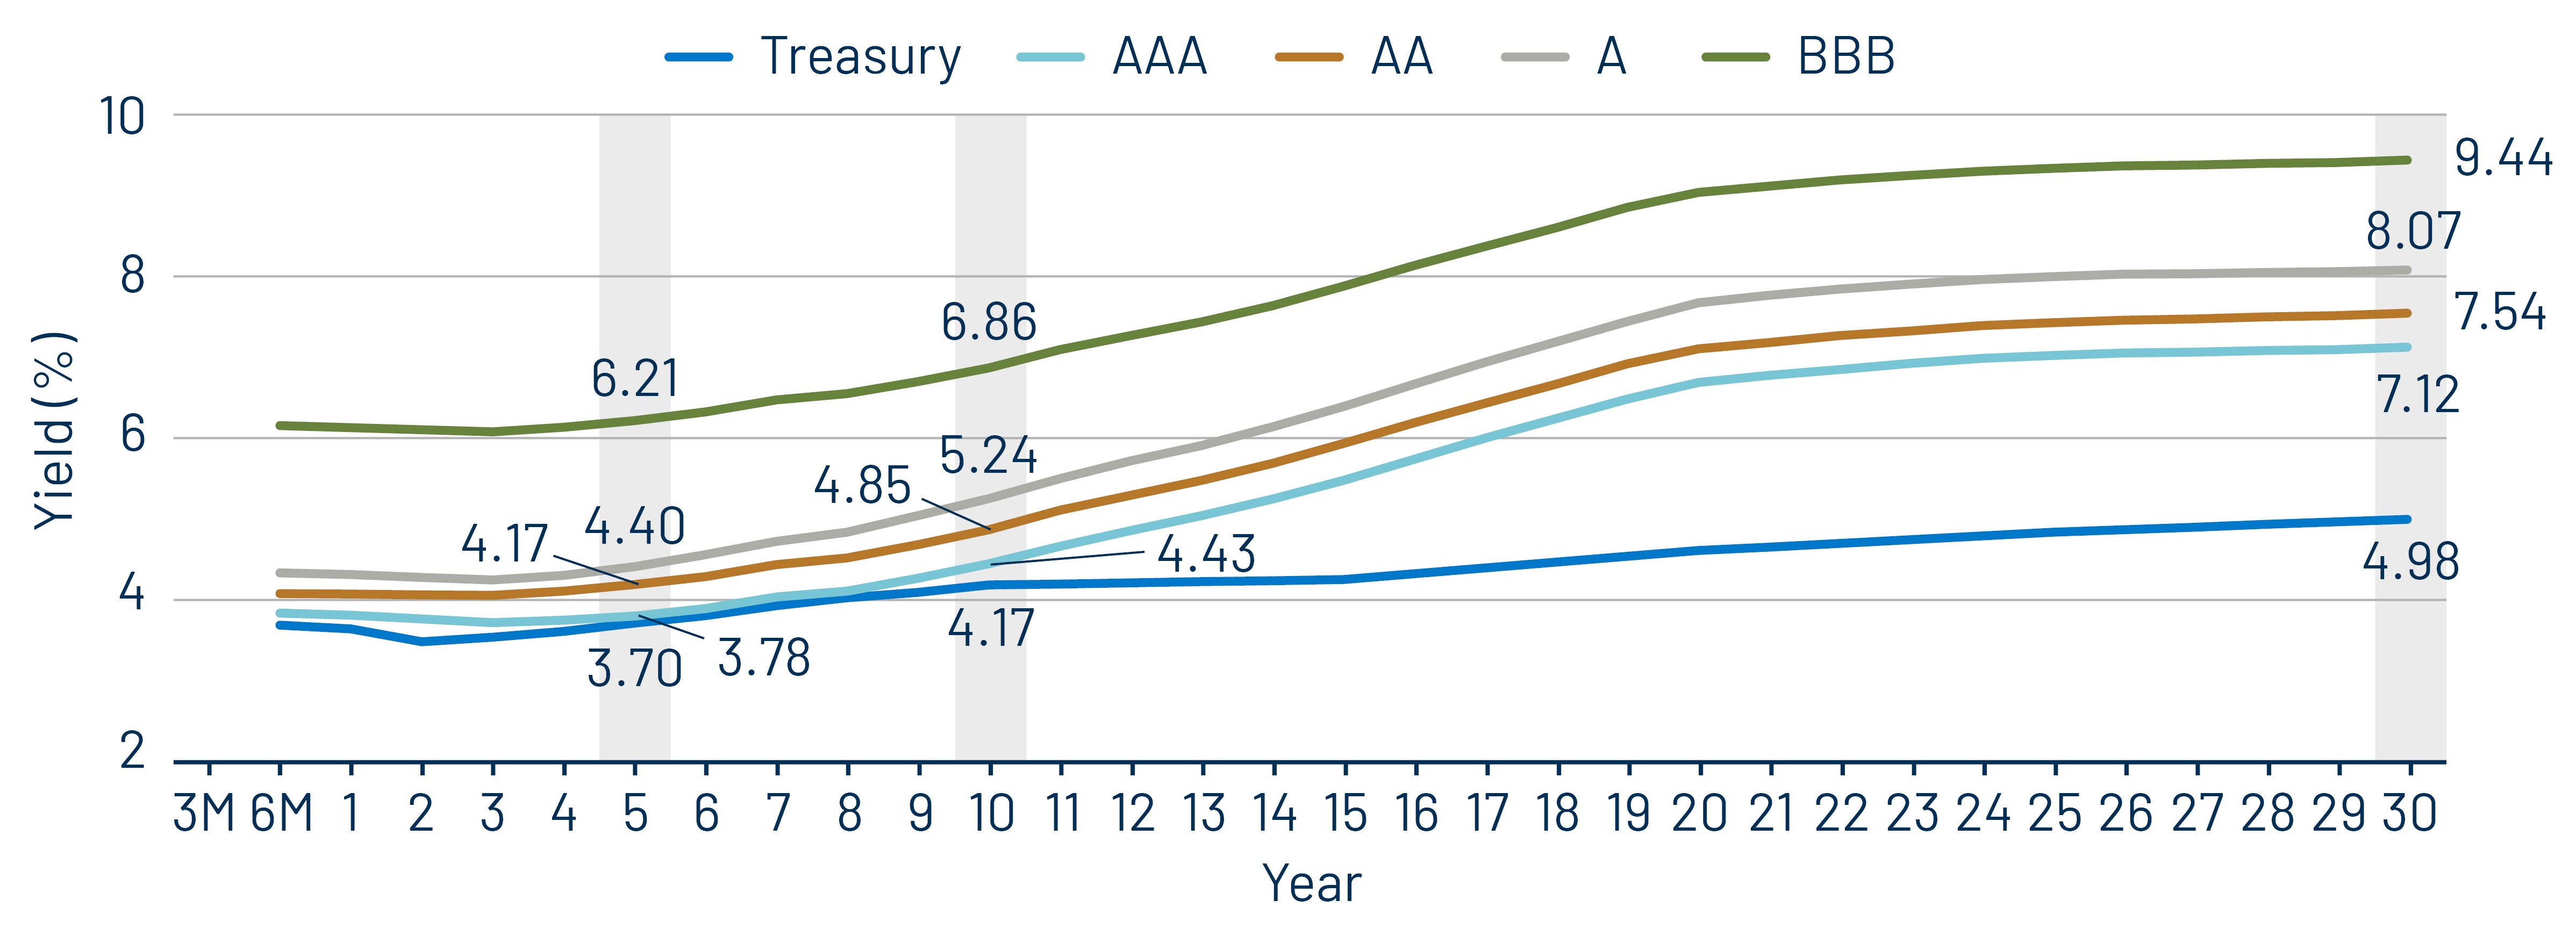
Theme 1: Municipal taxable-equivalent yields moved lower in 2025, but remain above historical averages.

Exhibit 8: Muni and Taxable-Equivalent Muni Yield-to-Worst
Muni and Taxable-Equivalent Muni Yield-to-Worst
Source: Bloomberg, Western Asset. As of 30 Jan 26. Bloomberg Municipal Bond Index yield considering highest marginal tax rate of 40.8%. Indexes are unmanaged and one cannot directly invest in them. They do not include fees, expenses or sales charges. Past performance is not an indicator or a guarantee of future results. Select the image to expand the view.

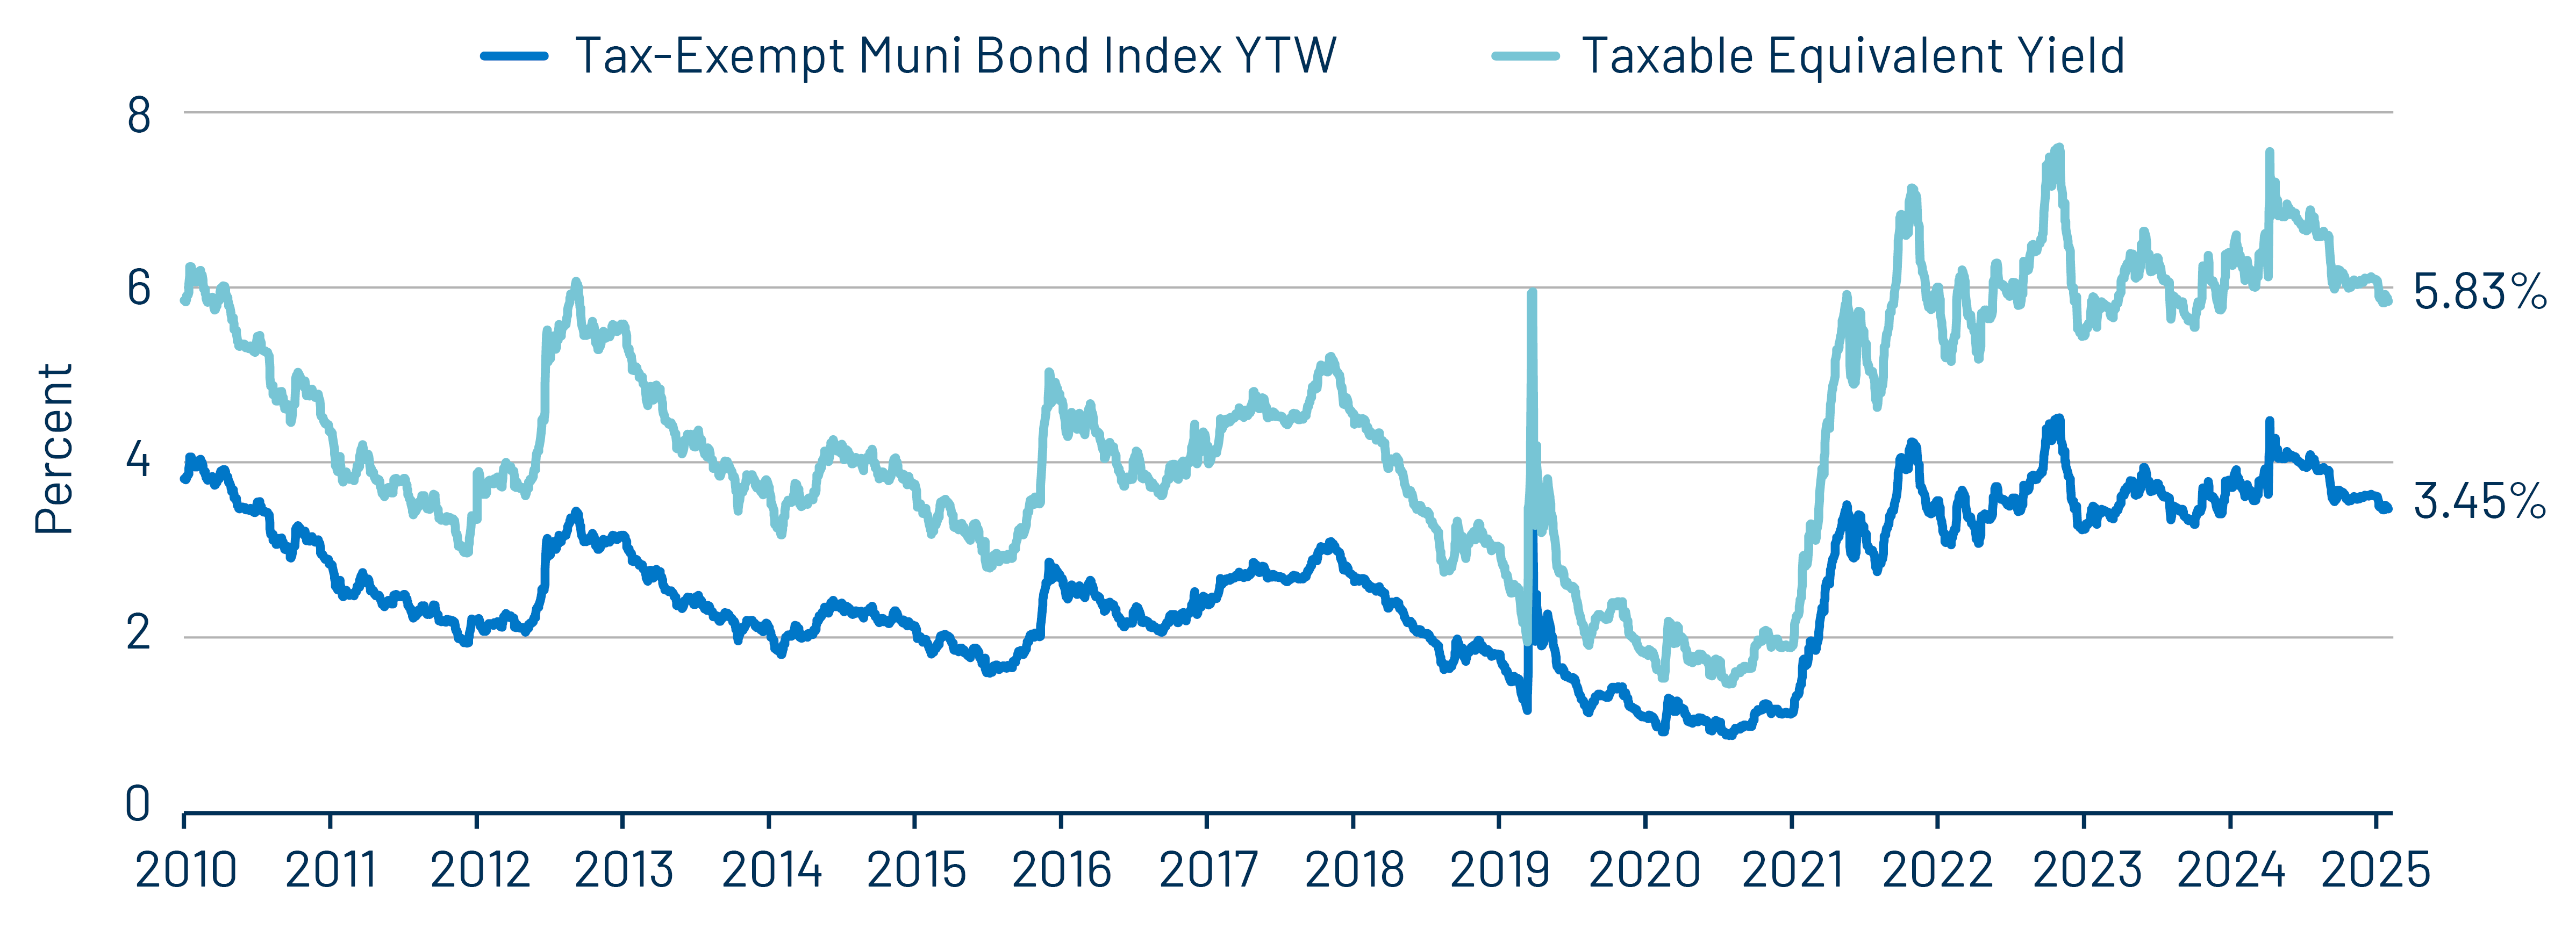
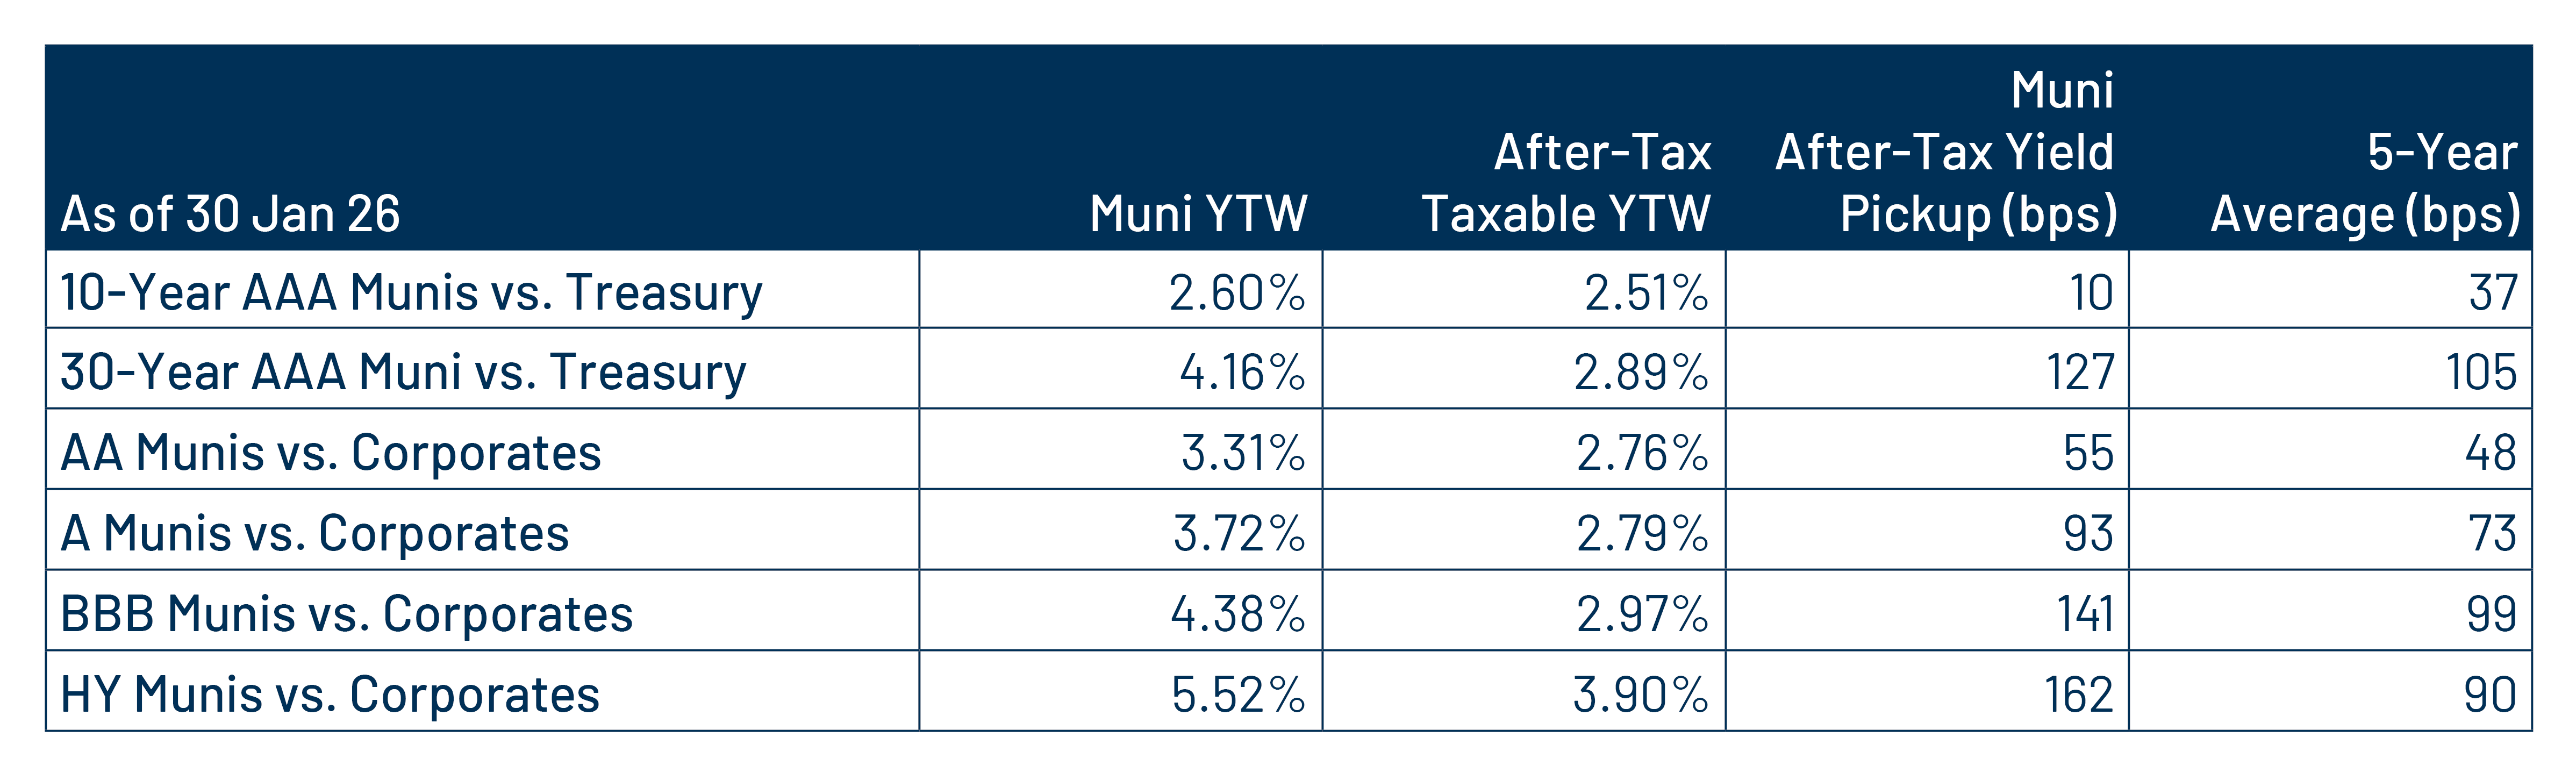
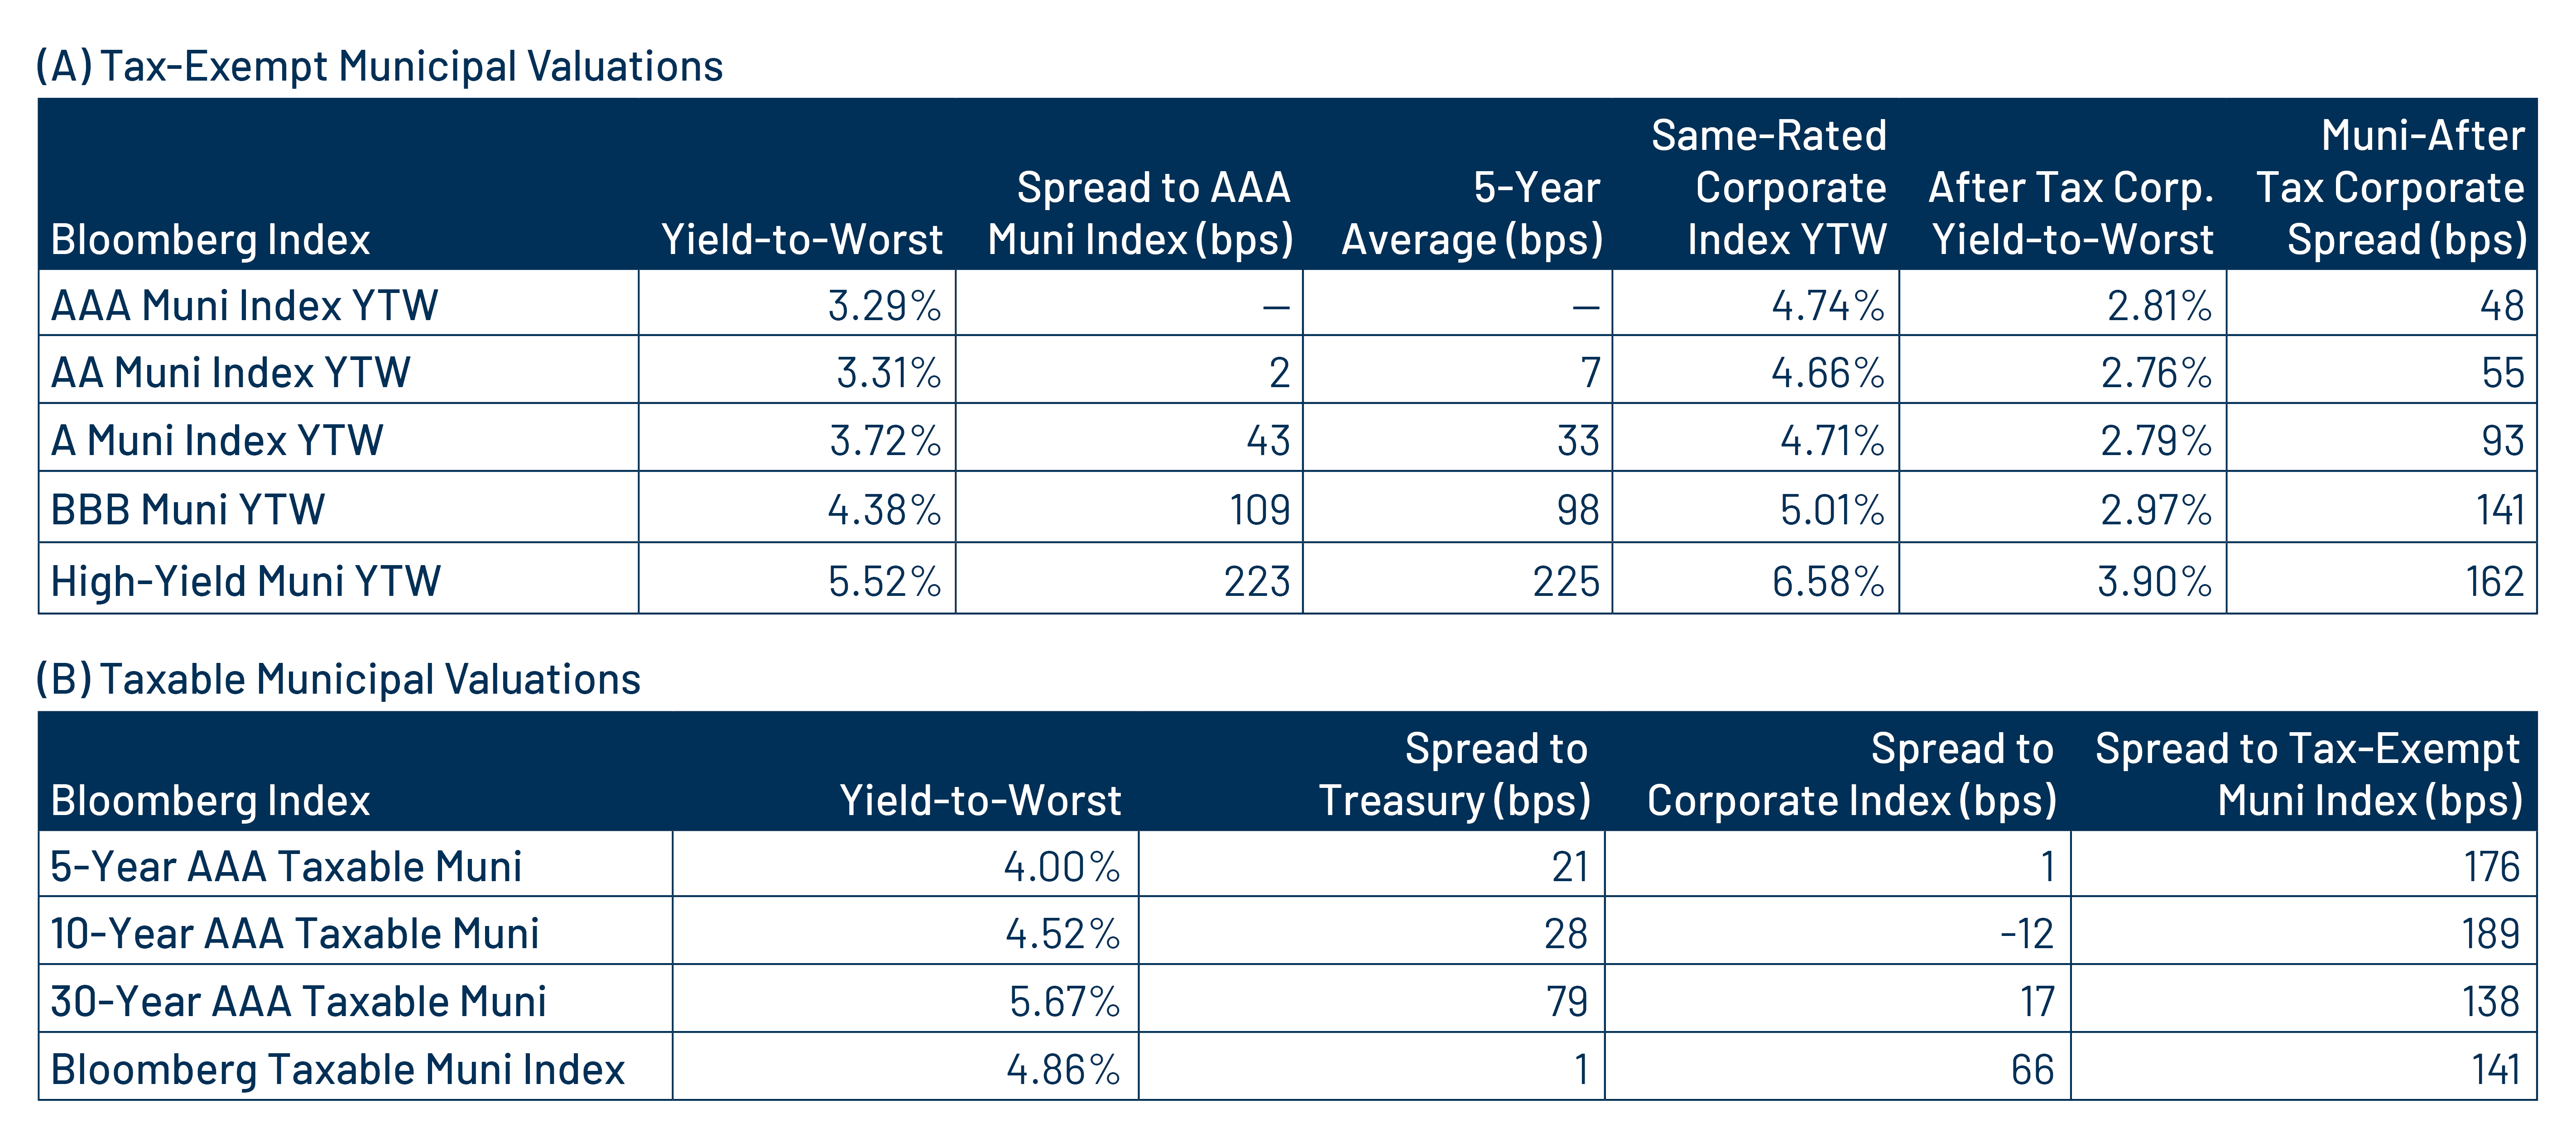
Theme 2: Munis offer attractive after-tax yield pickup vs. taxable alternatives.

Exhibit 9: AAA Municipal vs. Treasury Yield Curves
AAA Municipal vs. Treasury Yield Curves
Source: Bloomberg, Western Asset. As of 30 Jan 26. Bloomberg Valuation Service (BVAL) AAA Muni Curve and US On-/Off-the-Run Sovereign Curve. Indexes are unmanaged and one cannot directly invest in them. They do not include fees, expenses or sales charges. Past performance is not an indicator or a guarantee of future results. Select the image to expand the view.

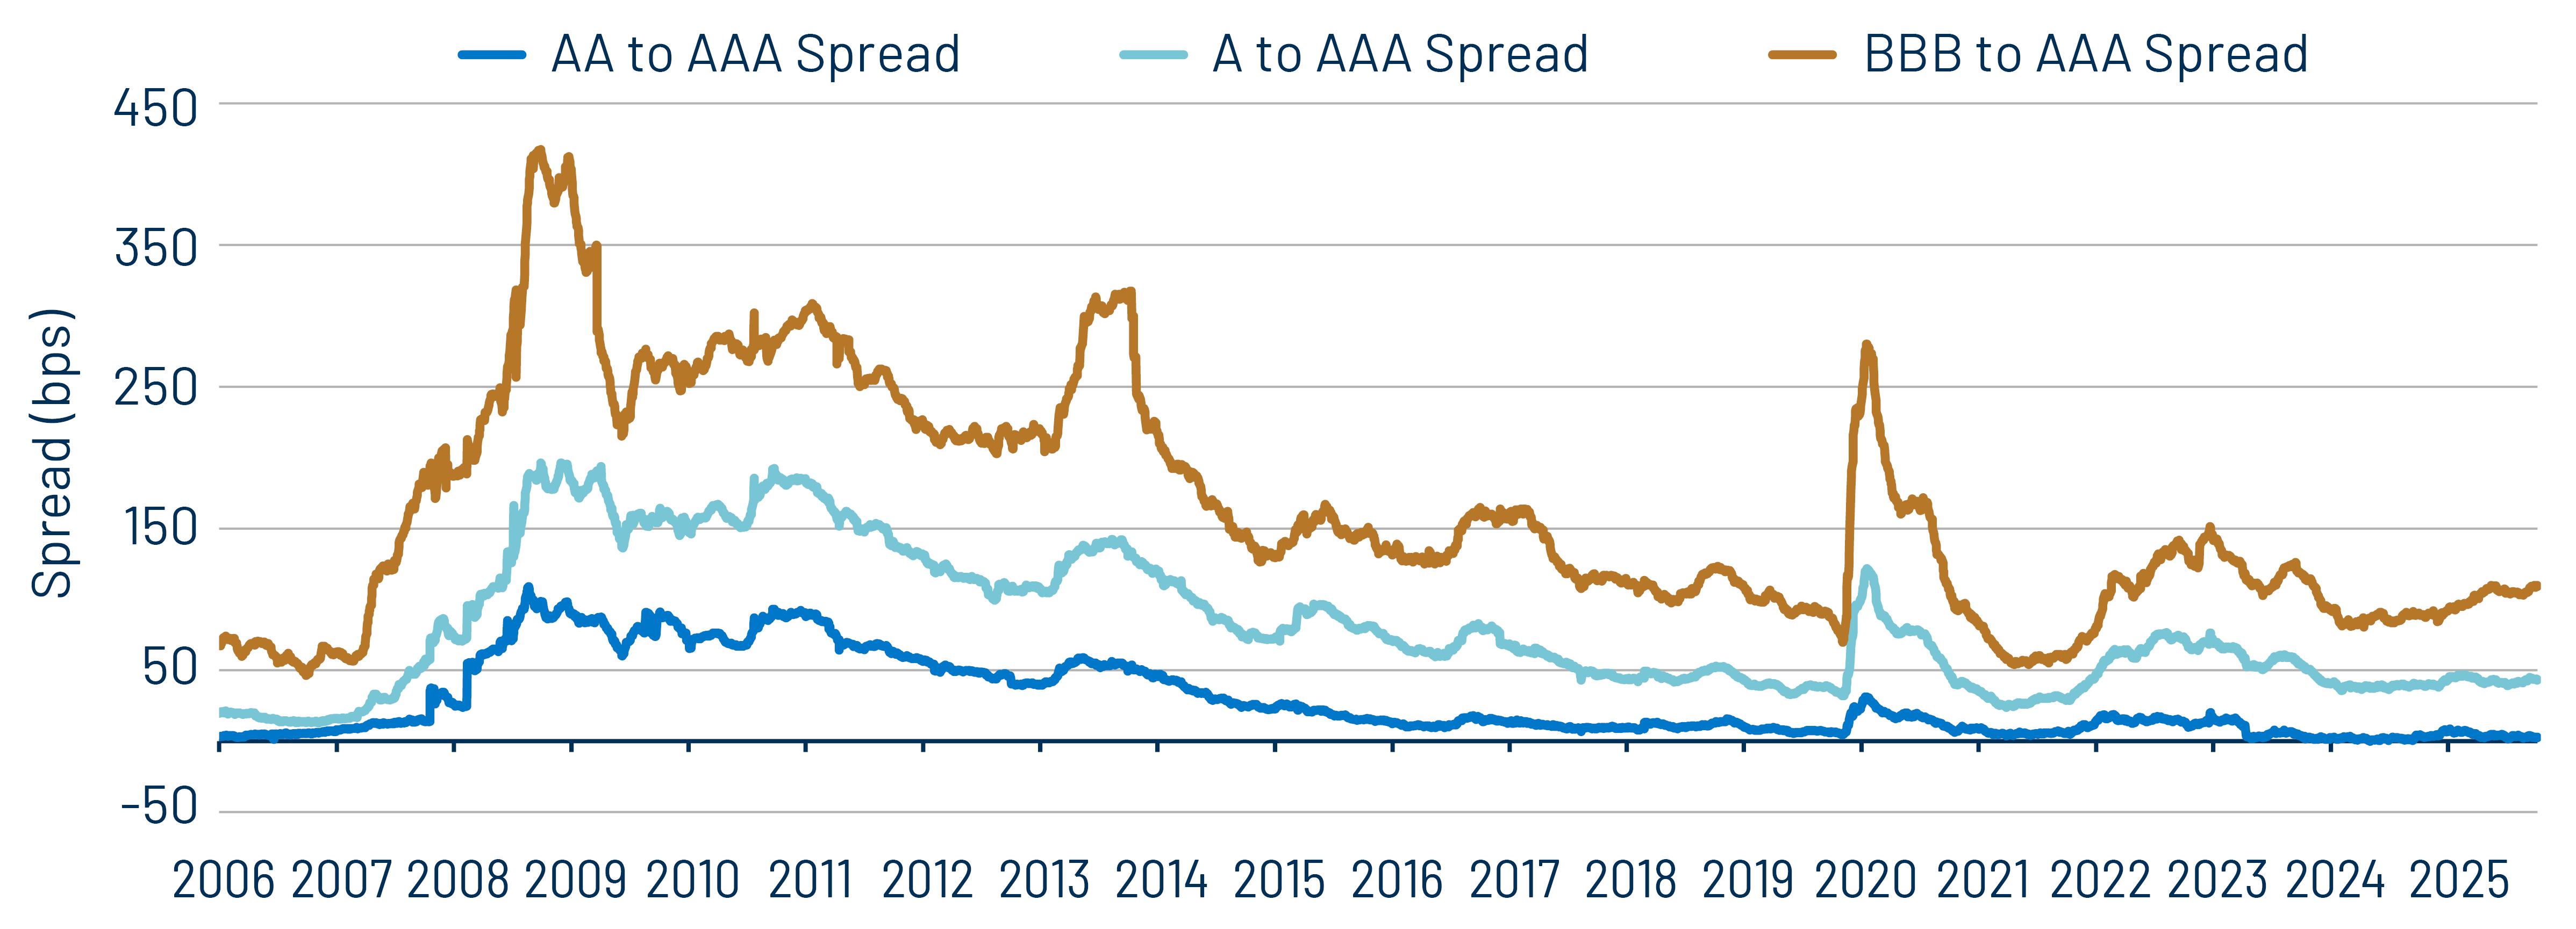
Theme 3: Tight municipal credit spreads demand disciplined credit selection.

Exhibit 10: Municipal vs. Taxable Fixed-Income Yields by Quality
Municipal vs. Taxable Fixed-Income Yields by Quality
Source: Western Asset, Bloomberg. As of 30 Jan 26. 10- and 30-Year comparison reflects Bloomberg Valuation Service (BVAL) AAA Muni Curve and US On-/Off-the-Run Sovereign Curve. AA Muni reflects the Bloomberg AA Muni Bond Index. A Muni reflects the Bloomberg A Muni Bond Index. BBB Muni reflects the Bloomberg BBB Muni Bond Index. HY Muni reflects the Bloomberg High Yield Muni Bond Index. AA Corp reflects the Bloomberg AA Corporate Bond Index. A Corp reflects the Bloomberg A Corporate Bond Index. BBB Corp reflects the Bloomberg BBB Corporate Bond Index. After-tax yield considers the top marginal tax rate of 40.8%. Indexes are unmanaged and one cannot directly invest in them. They do not include fees, expenses or sales charges. Past performance is not an indicator or a guarantee of future results. Select the image to expand the view.

© Western Asset Management Company, LLC 2026. The information contained in these materials ("the materials") is intended for the exclusive use of the designated recipient ("the recipient"). This information is proprietary and confidential and may contain commercially sensitive information, and may not be copied, reproduced or republished, in whole or in part, without the prior written consent of Western Asset Management Company ("Western Asset").
Past performance does not predict future returns. These materials should not be deemed to be a prediction or projection of future performance. These materials are intended for investment professionals including professional clients, eligible counterparties, and qualified investors only.
These materials have been produced for illustrative and informational purposes only. These materials contain Western Asset's opinions and beliefs as of the date designated on the materials; these views are subject to change and may not reflect real-time market developments and investment views.
Third party data may be used throughout the materials, and this data is believed to be accurate to the best of Western Asset's knowledge at the time of publication, but cannot be guaranteed. These materials may also contain strategy or product awards or rankings from independent third parties or industry publications which are based on unbiased quantitative and/or qualitative information determined independently by each third party or publication. In some cases, Western Asset may subscribe to these third party's standard industry services or publications. These standard subscriptions and services are available to all asset managers and do not influence rankings or awards in any way.
Investment strategies or products discussed herein may involve a high degree of risk, including the loss of some or all capital. Investments in any products or strategies described in these materials may be volatile, and investors should have the financial ability and willingness to accept such risks.
Unless otherwise noted, investment performance contained in these materials is reflective of a strategy composite. All other strategy data and information included in these materials reflects a representative portfolio which is an account in the composite that Western Asset believes most closely reflects the current portfolio management style of the strategy. Performance is not a consideration in the selection of the representative portfolio. The characteristics of the representative portfolio shown may differ from other accounts in the composite. Information regarding the representative portfolio and the other accounts in the composite are available upon request. Statements in these materials should not be considered investment advice. References, either general or specific, to securities and/or issuers in the materials are for illustrative purposes only and are not intended to be, and should not be interpreted as, recommendation to purchase or sell such securities. Employees and/or clients of Western Asset may have a position in the securities or issuers mentioned.
These materials are not intended to provide, and should not be relied on for, accounting, legal, tax, investment or other advice. The recipient should consult its own counsel, accountant, investment, tax, and any other advisers for this advice, including economic risks and merits, related to making an investment with Western Asset. The recipient is responsible for observing the applicable laws and regulations of their country of residence.
Founded in 1971, Western Asset Management Company is a global fixed-income investment manager with offices in Pasadena, New York, London, Singapore, Tokyo, Melbourne, São Paulo, Hong Kong, and Zürich. Western Asset is a wholly owned subsidiary of Franklin Resources, Inc. but operates autonomously. Western Asset is comprised of six legal entities across the globe, each with distinct regional registrations: Western Asset Management Company, LLC, a registered Investment Adviser with the Securities and Exchange Commission; Western Asset Management Company Ltda. is regulated by Comissão de Valores Mobiliários; Western Asset Management Company Pty Ltd ABN 41 117 767 923 is the holder of the Australian Financial Services License 303160; Western Asset Management Company Pte. Ltd. Co. Reg. No. 200007692R is a holder of a Capital Markets Services License for fund management and regulated by the Monetary Authority of Singapore; Western Asset Management Company Ltd, a registered Financial Instruments Business Operator and regulated by the Financial Services Agency of Japan; and Western Asset Management Company Limited is authorised and regulated by the Financial Conduct Authority ("FCA") (FRN 145930). This communication is intended for distribution to Professional Clients only if deemed to be a financial promotion in the UK as defined by the FCA. This communication may also be intended for certain EEA countries where Western Asset has been granted permission to do so. For the current list of the approved EEA countries please contact Western Asset at +44 (0)20 7422 3000.