Macros, Markets and Munis
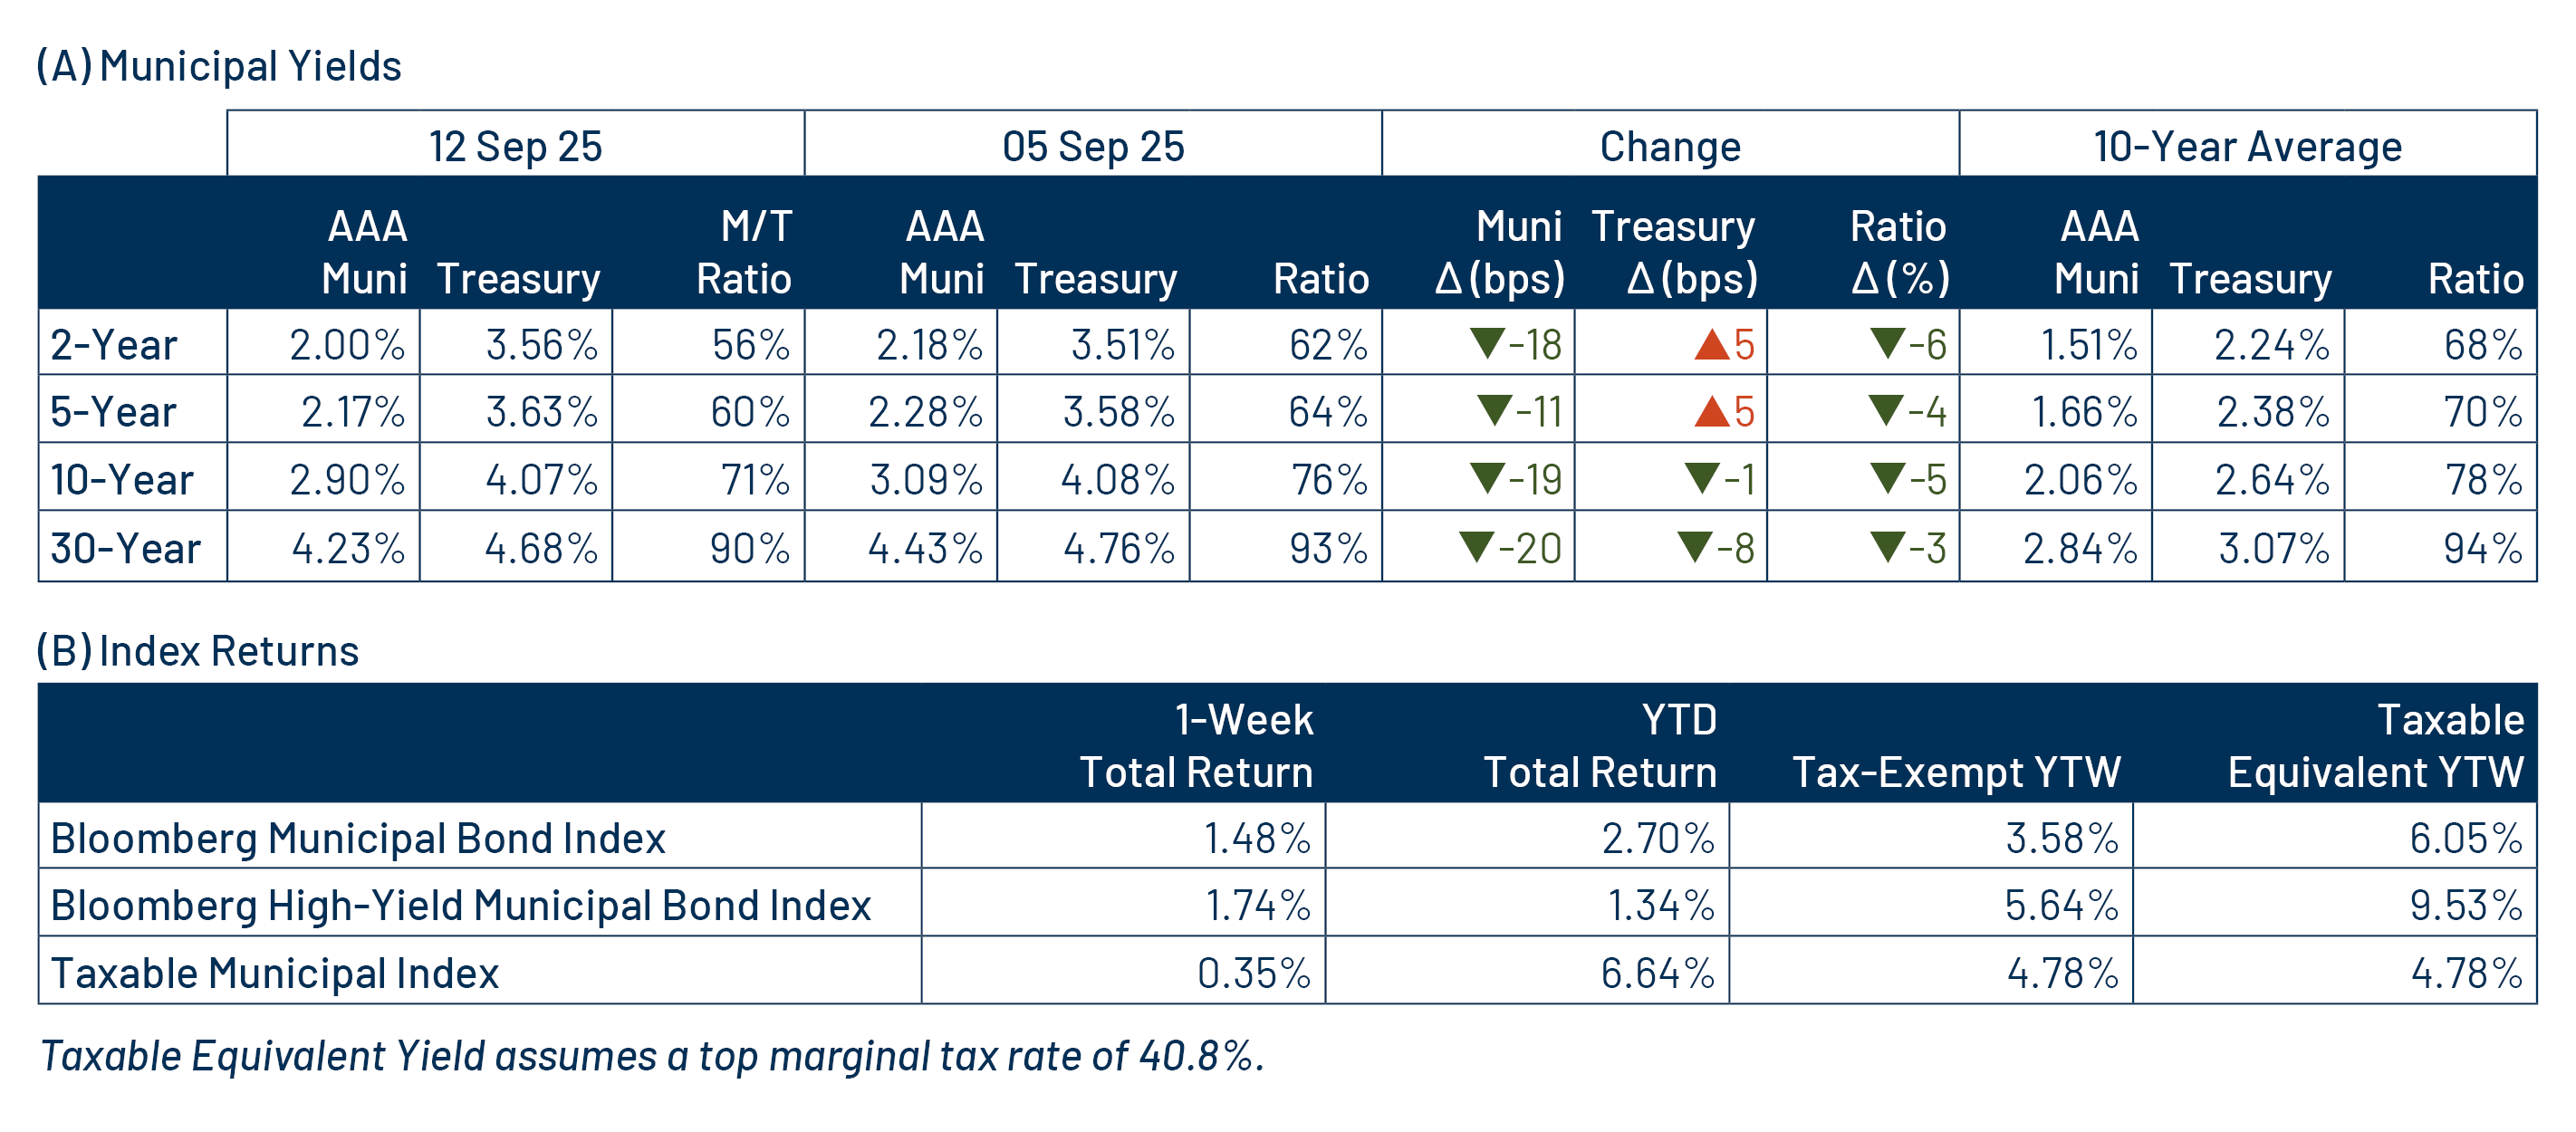
Munis posted positive returns and outperformed other fixed-income markets last week. Fixed-income markets generally carried over the momentum from the prior week’s weak labor data as inflation figures came in weaker than expected. Producer Price Index data fell below expectations and University of Michigan sentiment data continued to decline. The Treasury curve flattened, with yields moving 5 basis points (bps) higher in short maturities and 8 bps lower in longer maturities. Municipal bond demand accelerated amid an elevated new-issue calendar, with the high-grade muni yield curve outperforming across the curve, moving 11-20 bps lower during the week. Following last week’s release of state and local tax collection estimates from the Census, this week we touch on the pace of state and local revenue growth.
Technicals Strengthened Amid Heavy Inflows
Fund Flows ($2.2 billion of net inflows): During the week ending September 10, weekly reporting municipal mutual funds recorded $2.2 billion of net inflows, according to Lipper. Long-term, intermediate and short-term categories recorded $1.3 billion, $375 million and $71 million of inflows, respectively. Last week’s inflows led year-to-date (YTD) inflows higher to $28 billion.
Supply (YTD supply of $407 billion; up 21% YoY): The muni market recorded $14 billion of new-issue supply last week, up 84% from the prior week. YTD new-issue supply of $407 billion is 21% higher than the prior year, with tax-exempt issuance up 22% year-over-year (YoY) and taxable issuance up 2% YoY, respectively. This week’s calendar is expected to remain elevated at $12 billion. The largest deals include $1.0 billion New York Metropolitan Transportation Authority and $950 million California Community Choice Clean Energy Project transactions.
This Week in Munis: State and Local Tax Collections Remain Strong
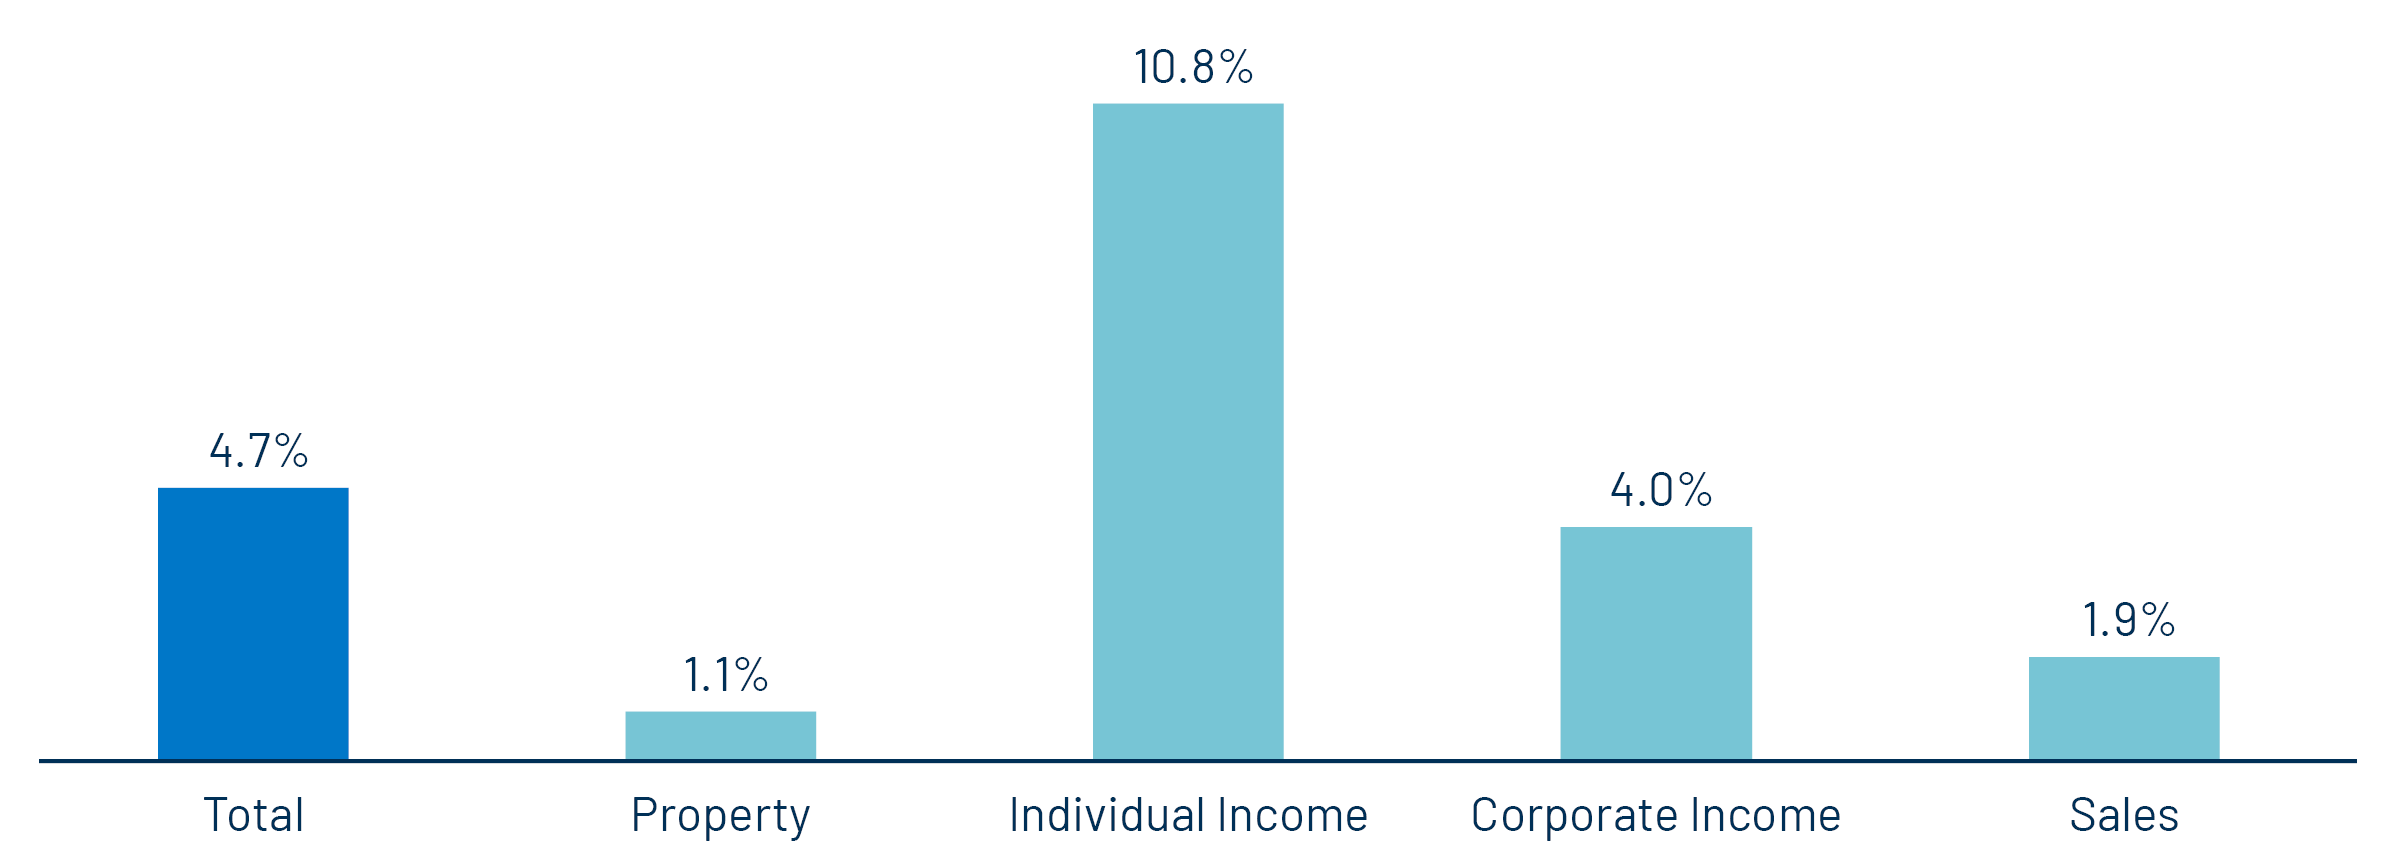
Last week the Census released 2Q25 state and local tax collection estimates, which indicated the end of the fiscal year for most state and local governments. Second quarter major state and local government tax collections increased 5% from 2Q24 levels to $562 billion. Among the major state revenue sources, individual income taxes increased 11%, corporate income tax collections increased 4% and sales tax collections increased 2% YoY. Property tax collections, the primary source of revenues for local governments, increased 1% YoY.
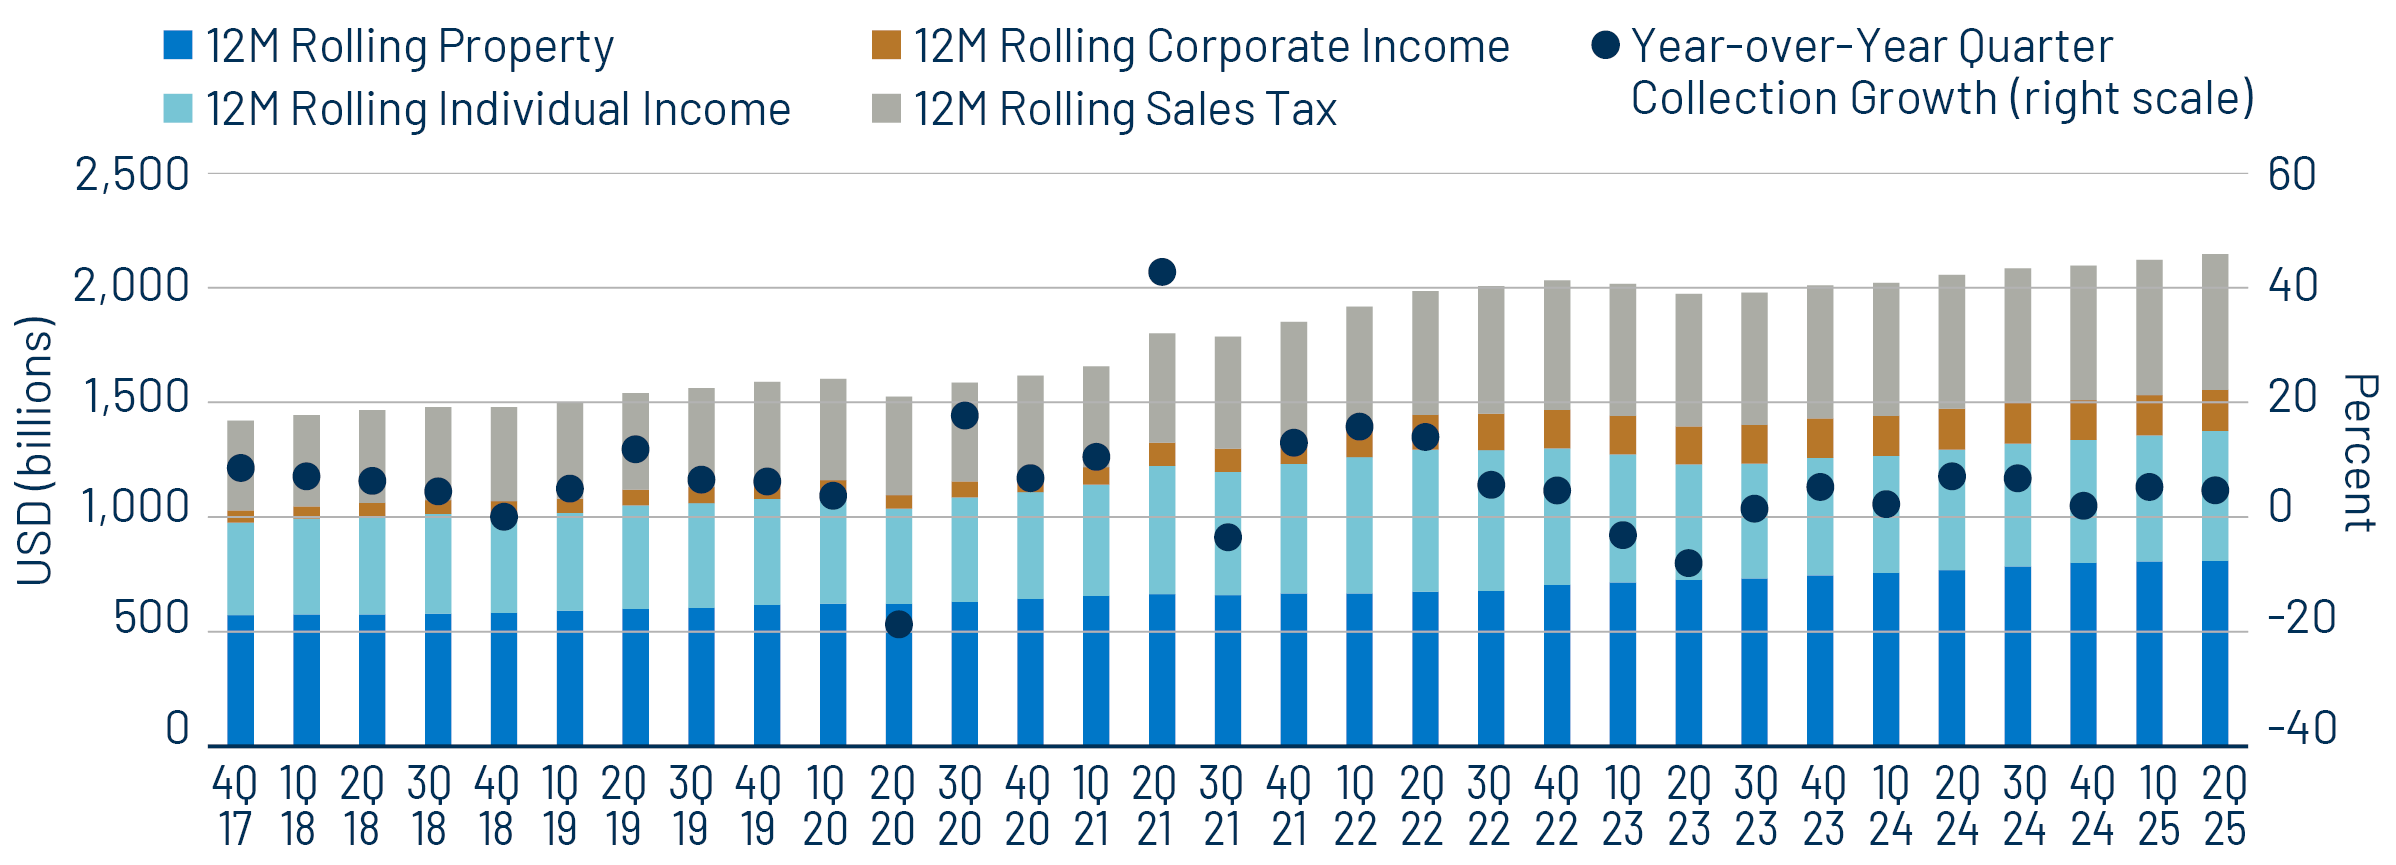
Twelve-month trailing collections increased 4% YoY to $2.1 trillion, marking a record high level, according to the Census data. On a 12-month trailing basis, individual income tax collections increased 8% YoY, sales tax collections increased 2% YoY, while corporate income tax collections were relatively unchanged YoY. Twelve-month rolling property tax collections increased 2% YoY.
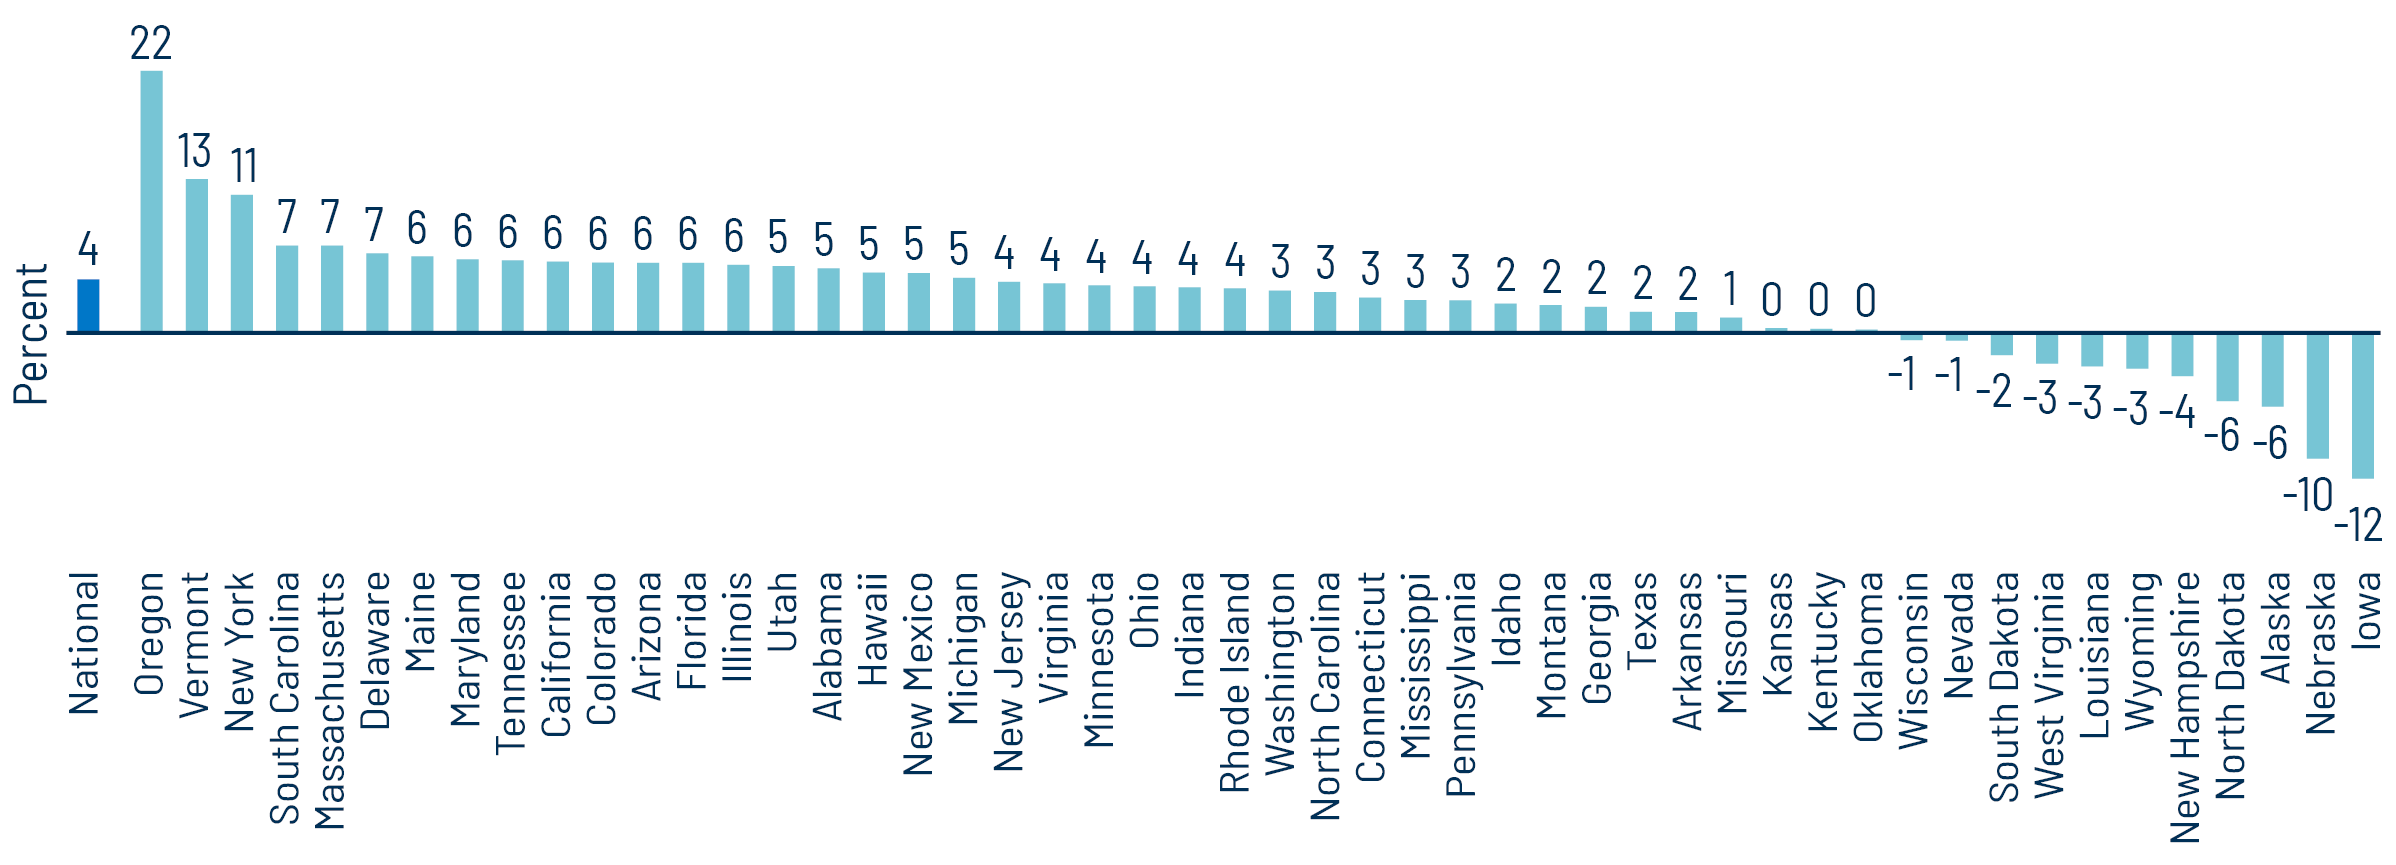
From a state perspective, the Census estimates that most states recorded revenue increases over the trailing 12 months, with total state tax collections increasing 4% during the year. Oregon (+22% YoY), Vermont (+13%), and New York (+11%) recorded the highest growth in estimated tax revenue, while the Census estimated Iowa (-12%), Nebraska (-10%) and Alaska (-6%) recorded the greatest 12-month trailing YoY tax collection declines.
The continued growth of state and local tax collections highlights the resilience of state and local revenues despite the lower economic growth trends observed earlier in the year. We expect a strong labor market and consumer spending to support tax collections and municipal credit conditions over the medium term. However, we anticipate that the potential for tax collections will become more critical for budgets if federal spending reductions extend more broadly to state and local budgets.
Municipal Credit Curves and Relative Value
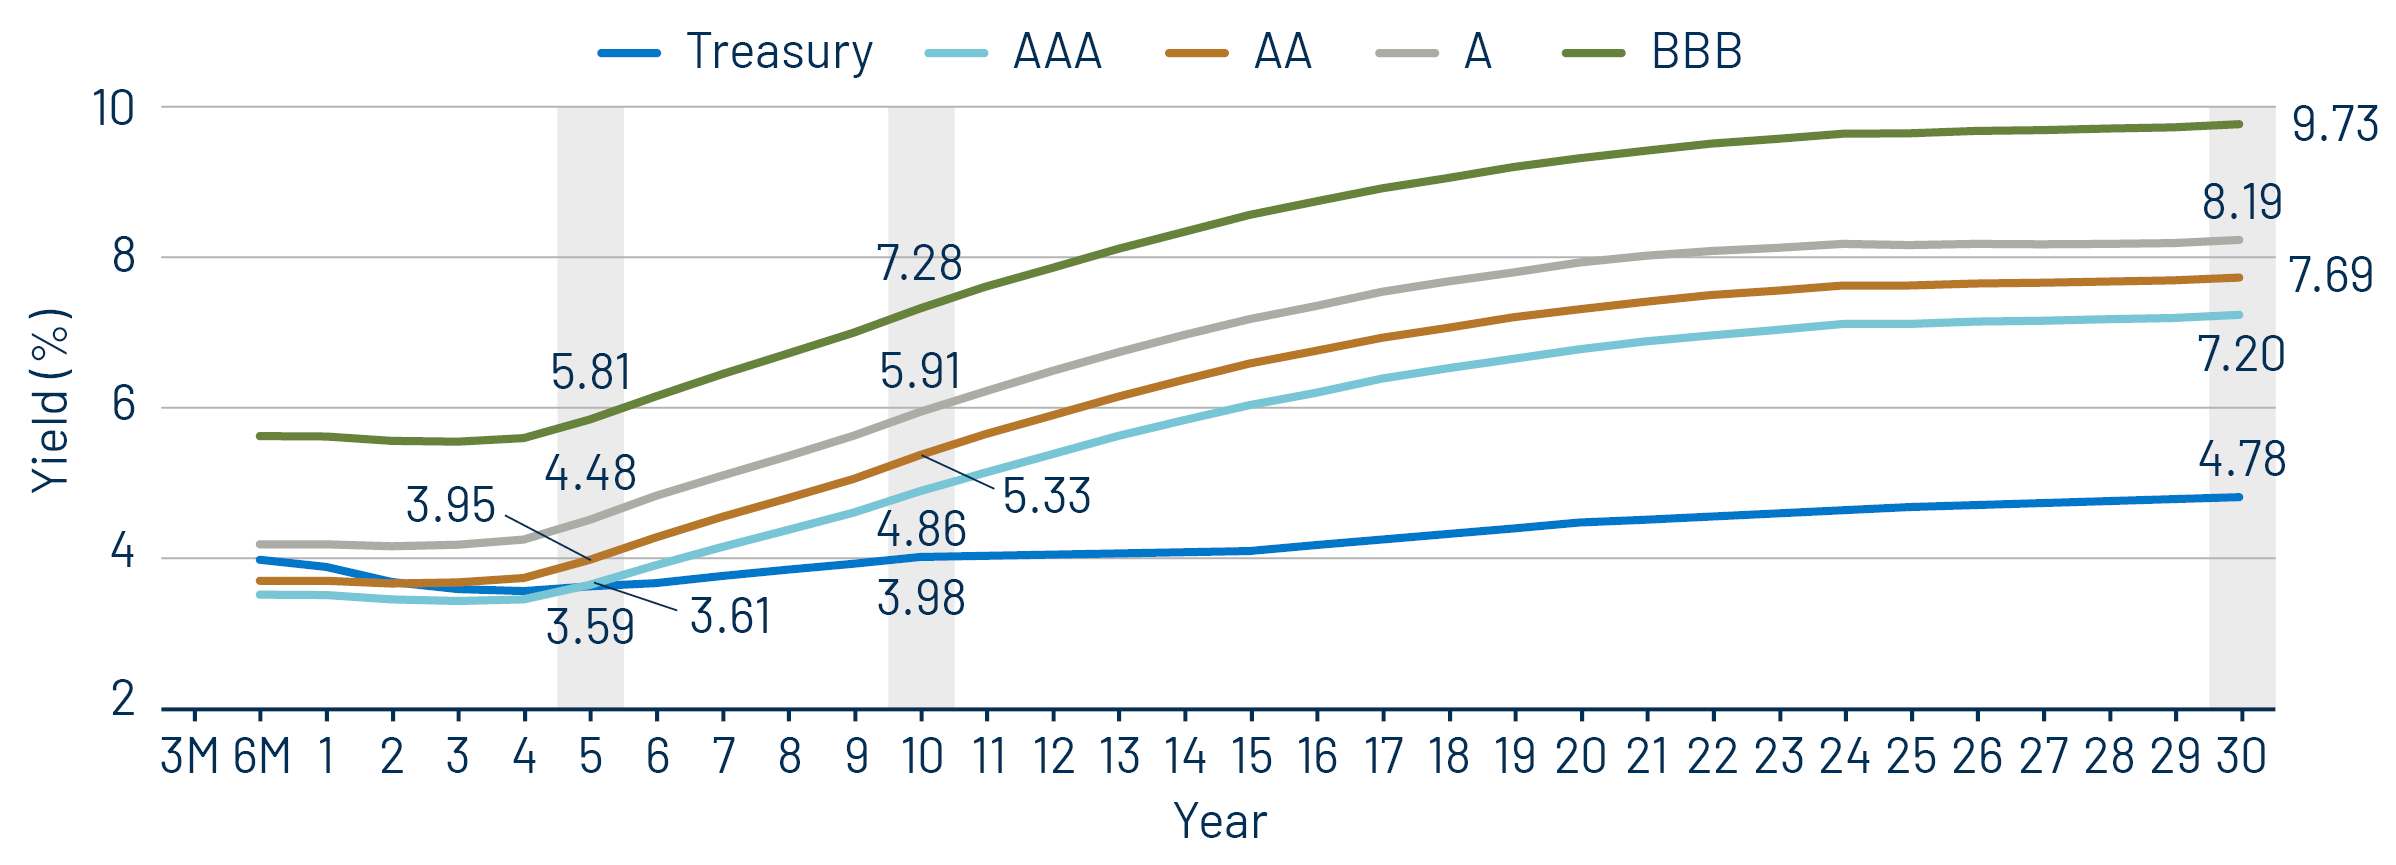
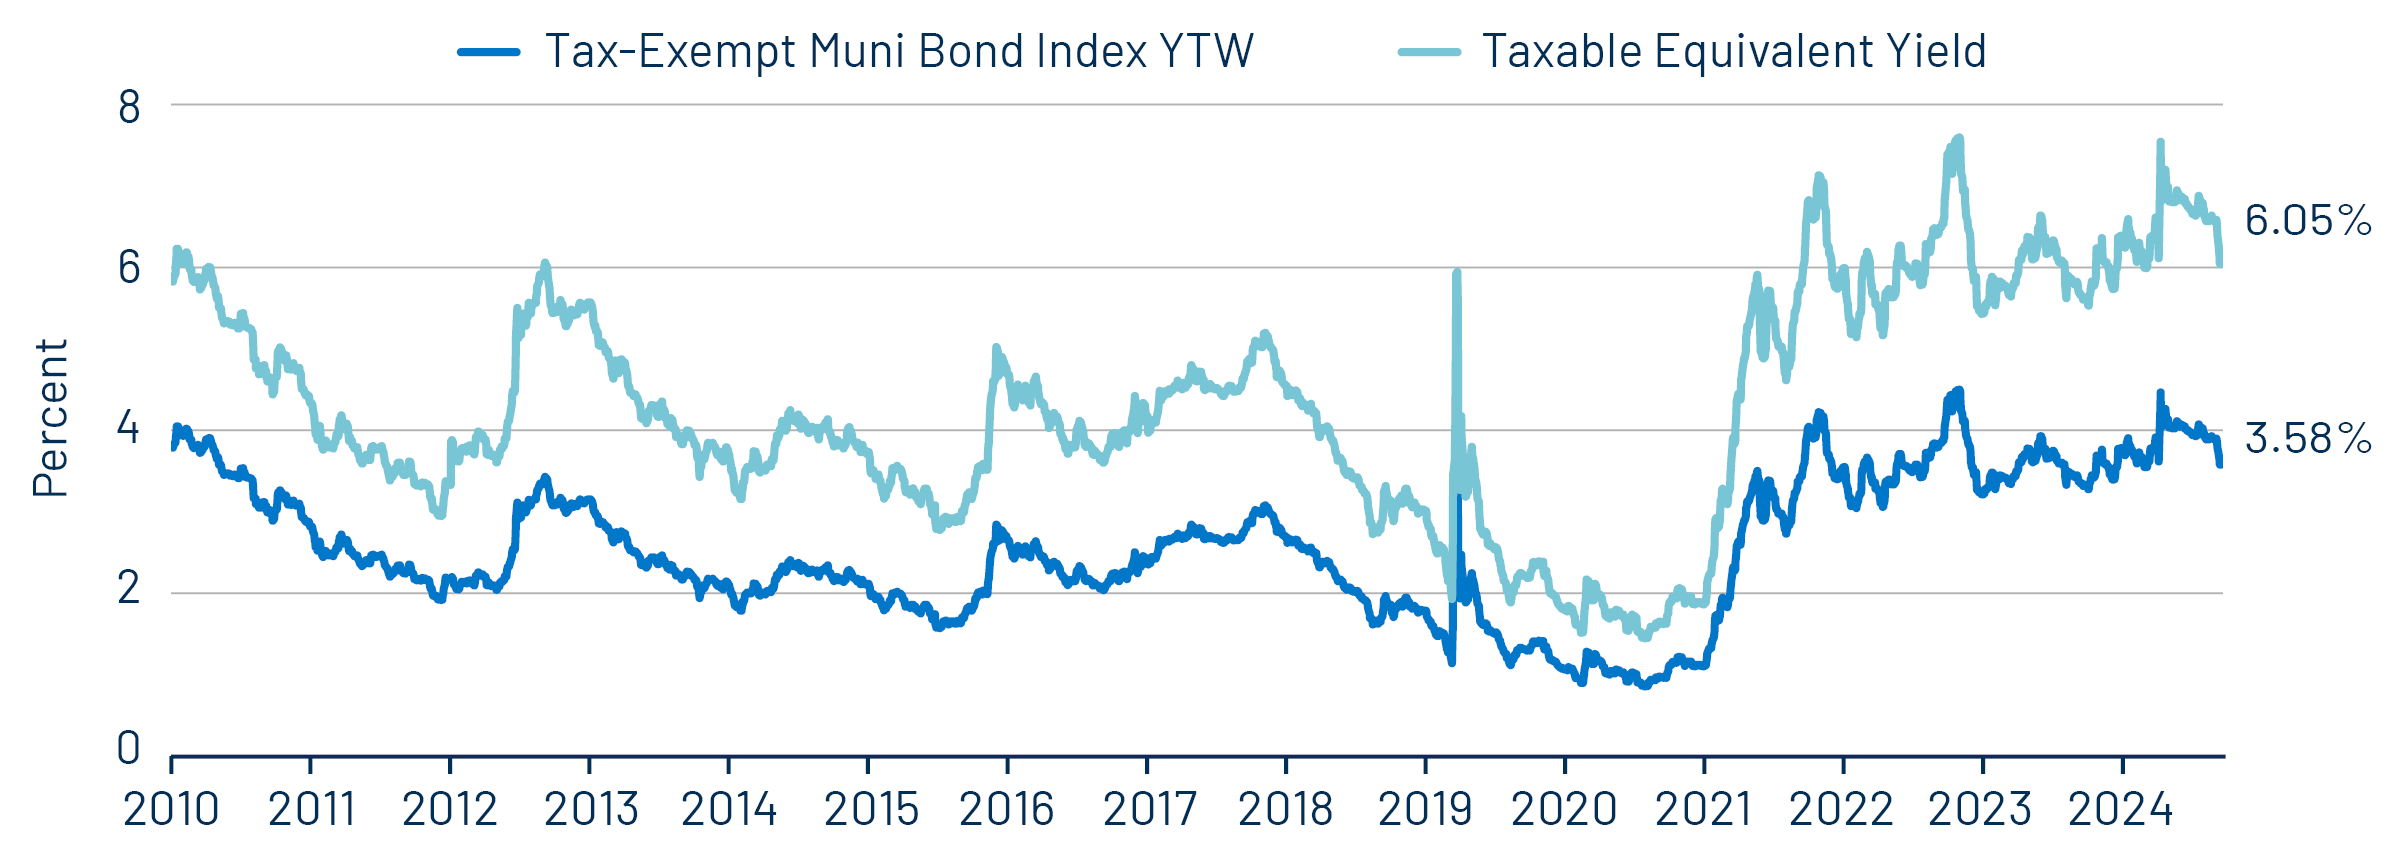
Theme #1: Municipal taxable-equivalent yields and income opportunities remain near decade-high levels.
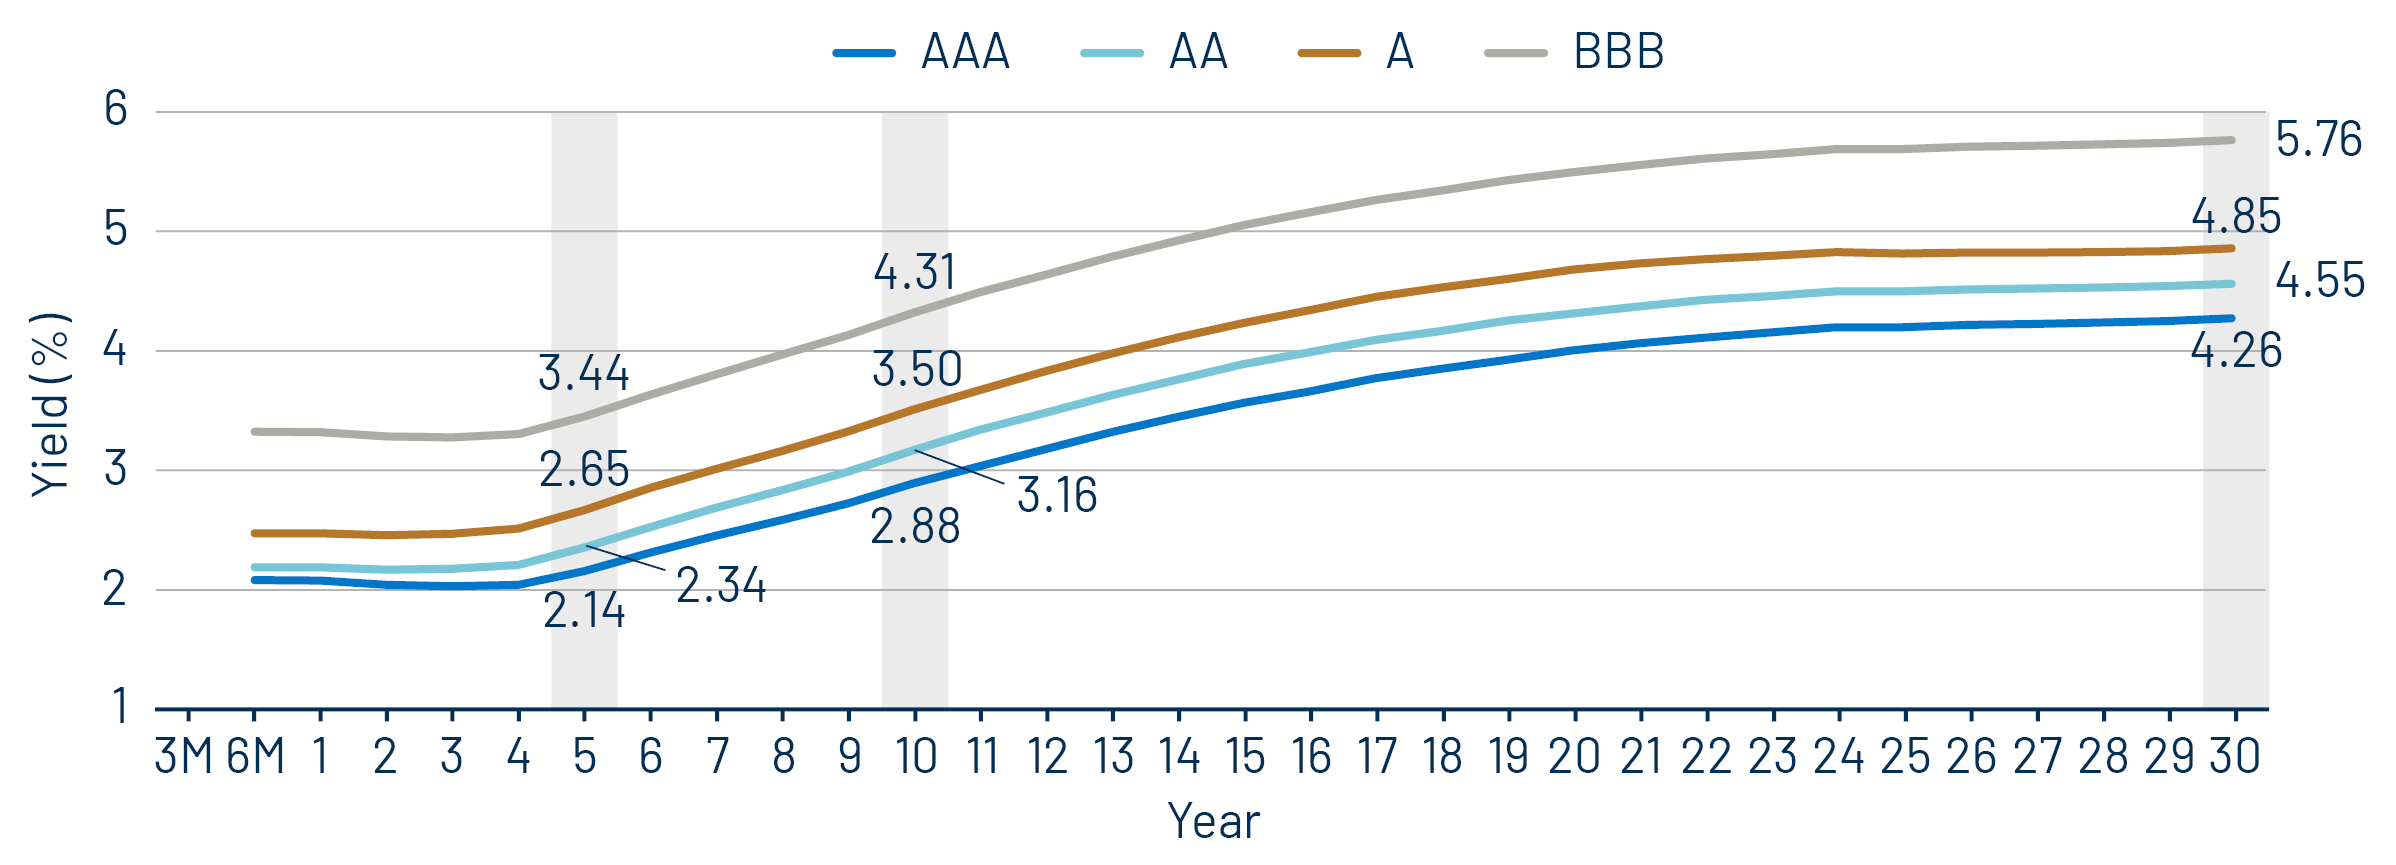
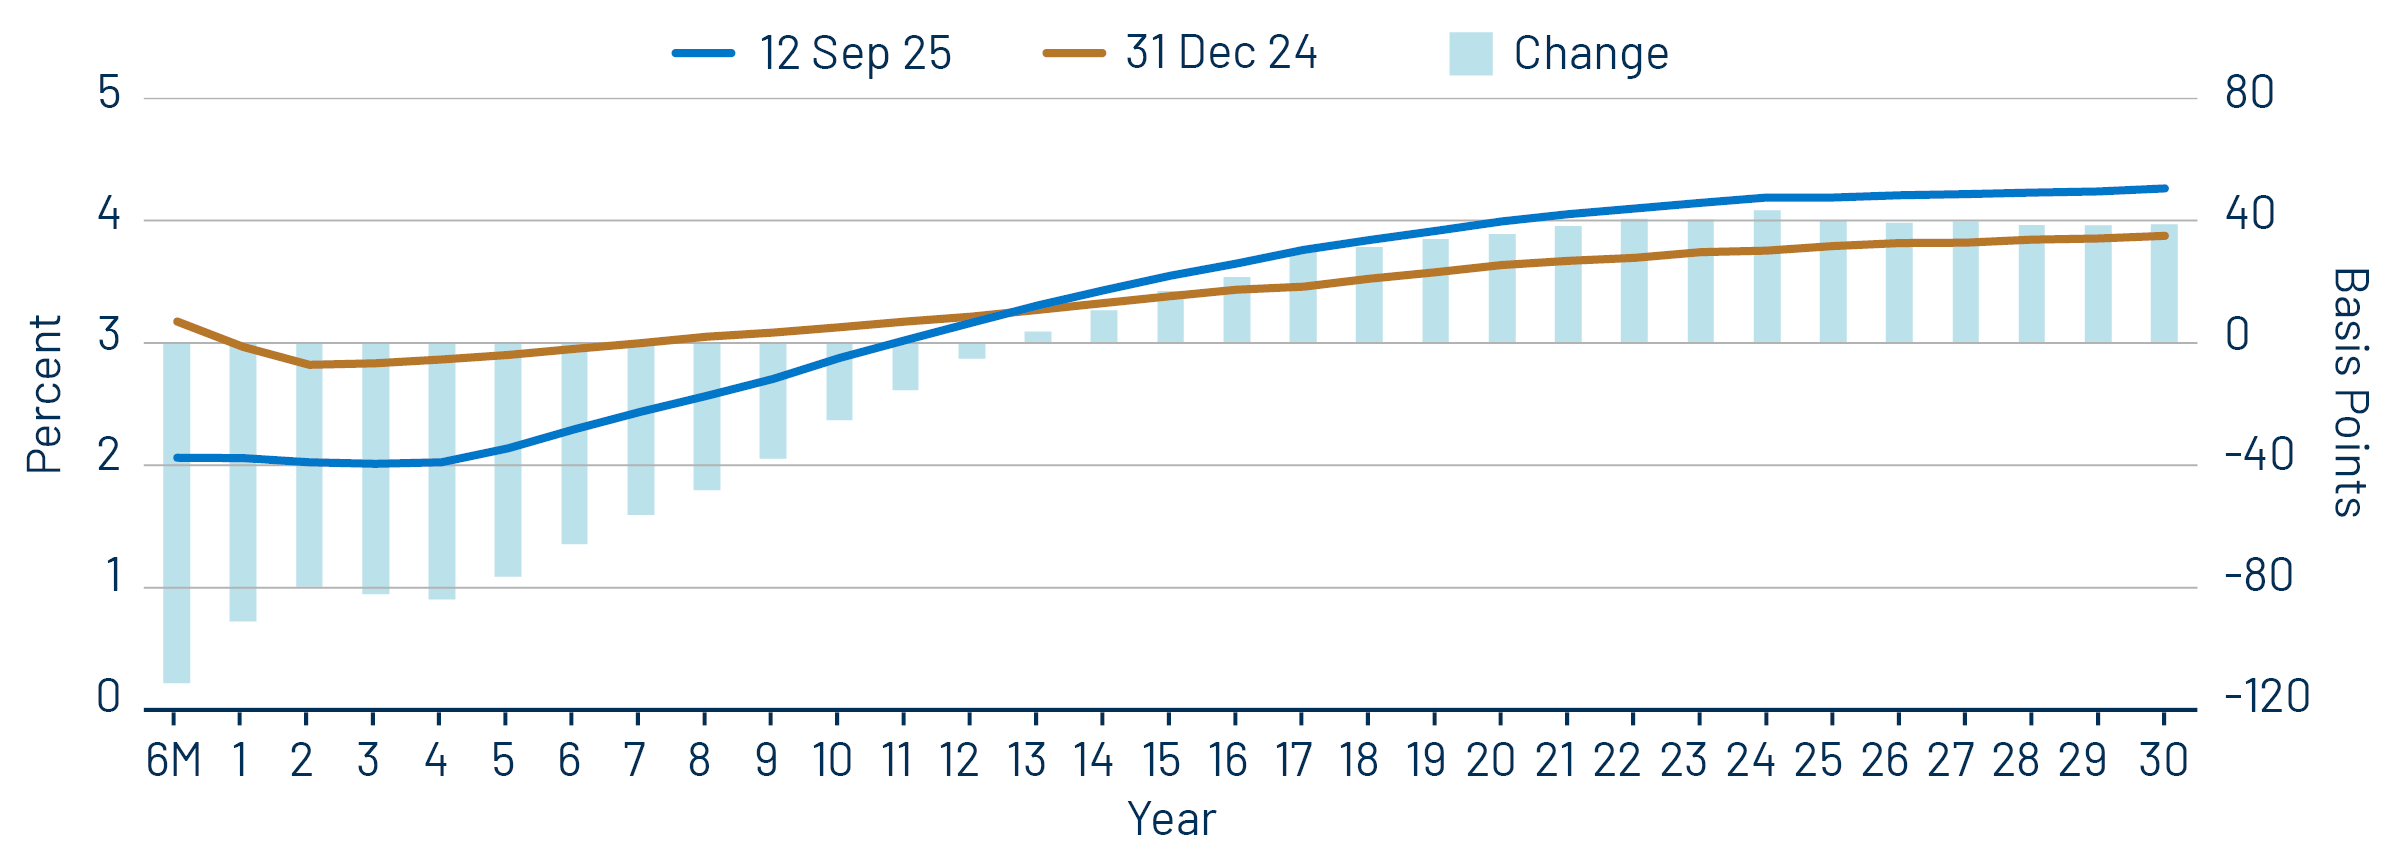
Theme #2: The AAA muni curve has steepened, offering better value in intermediate and longer maturities.
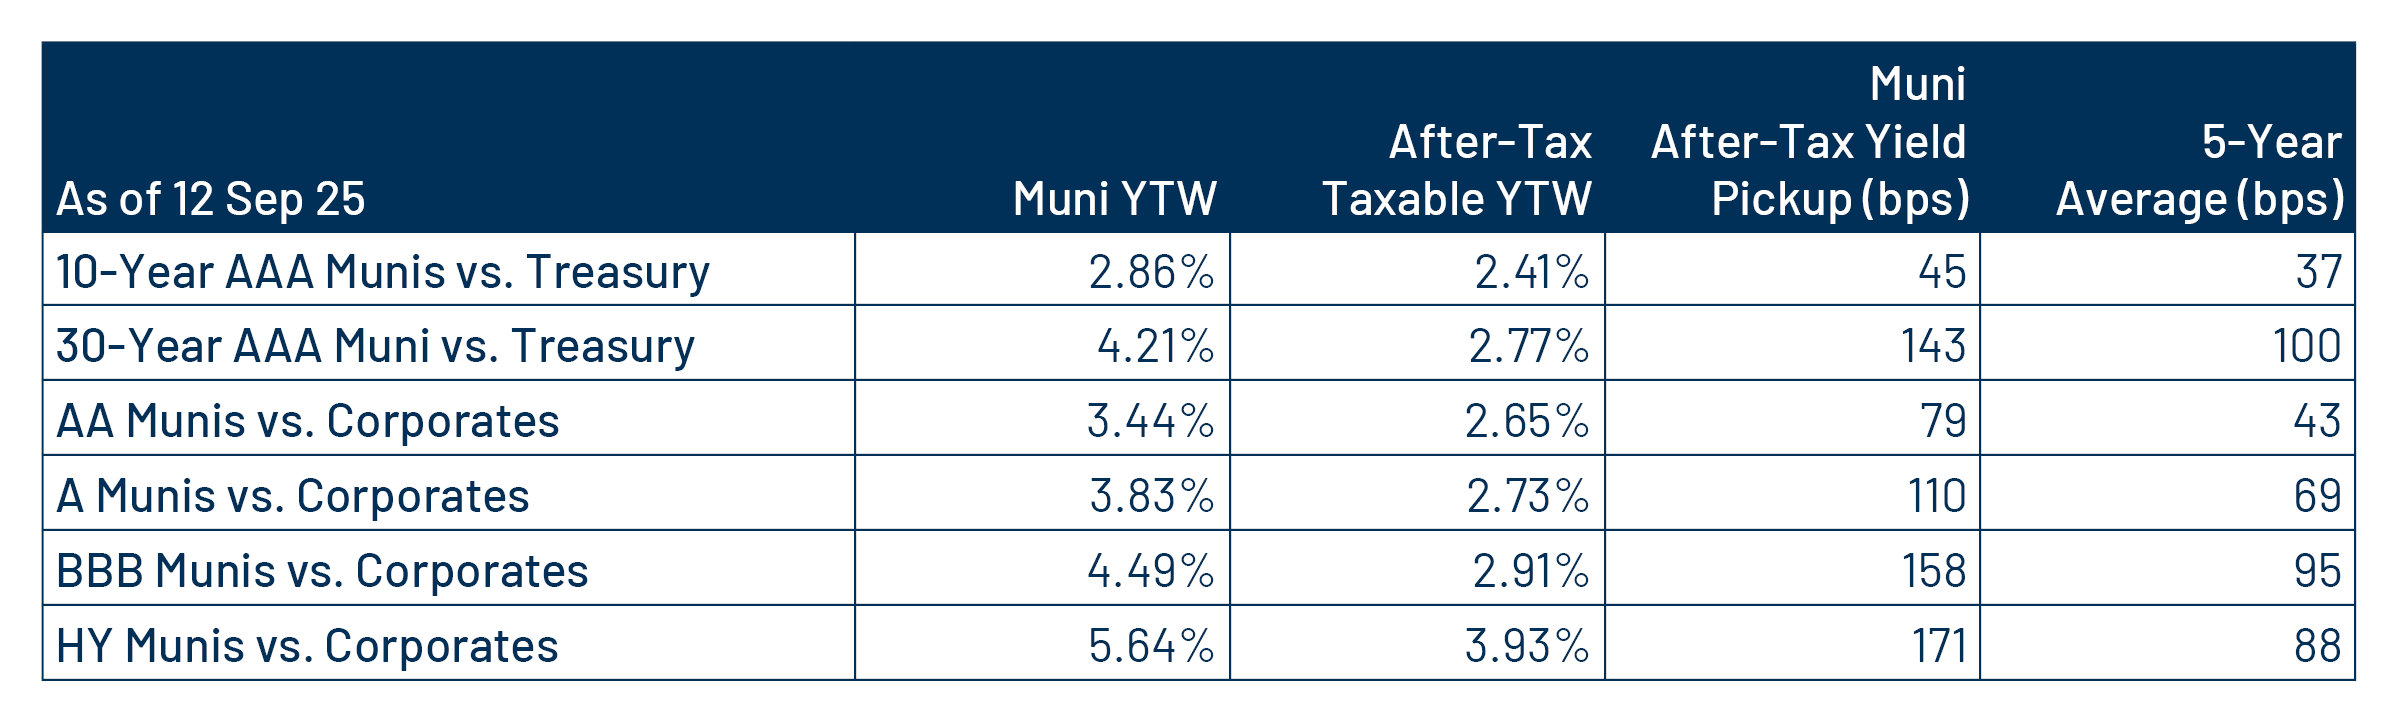
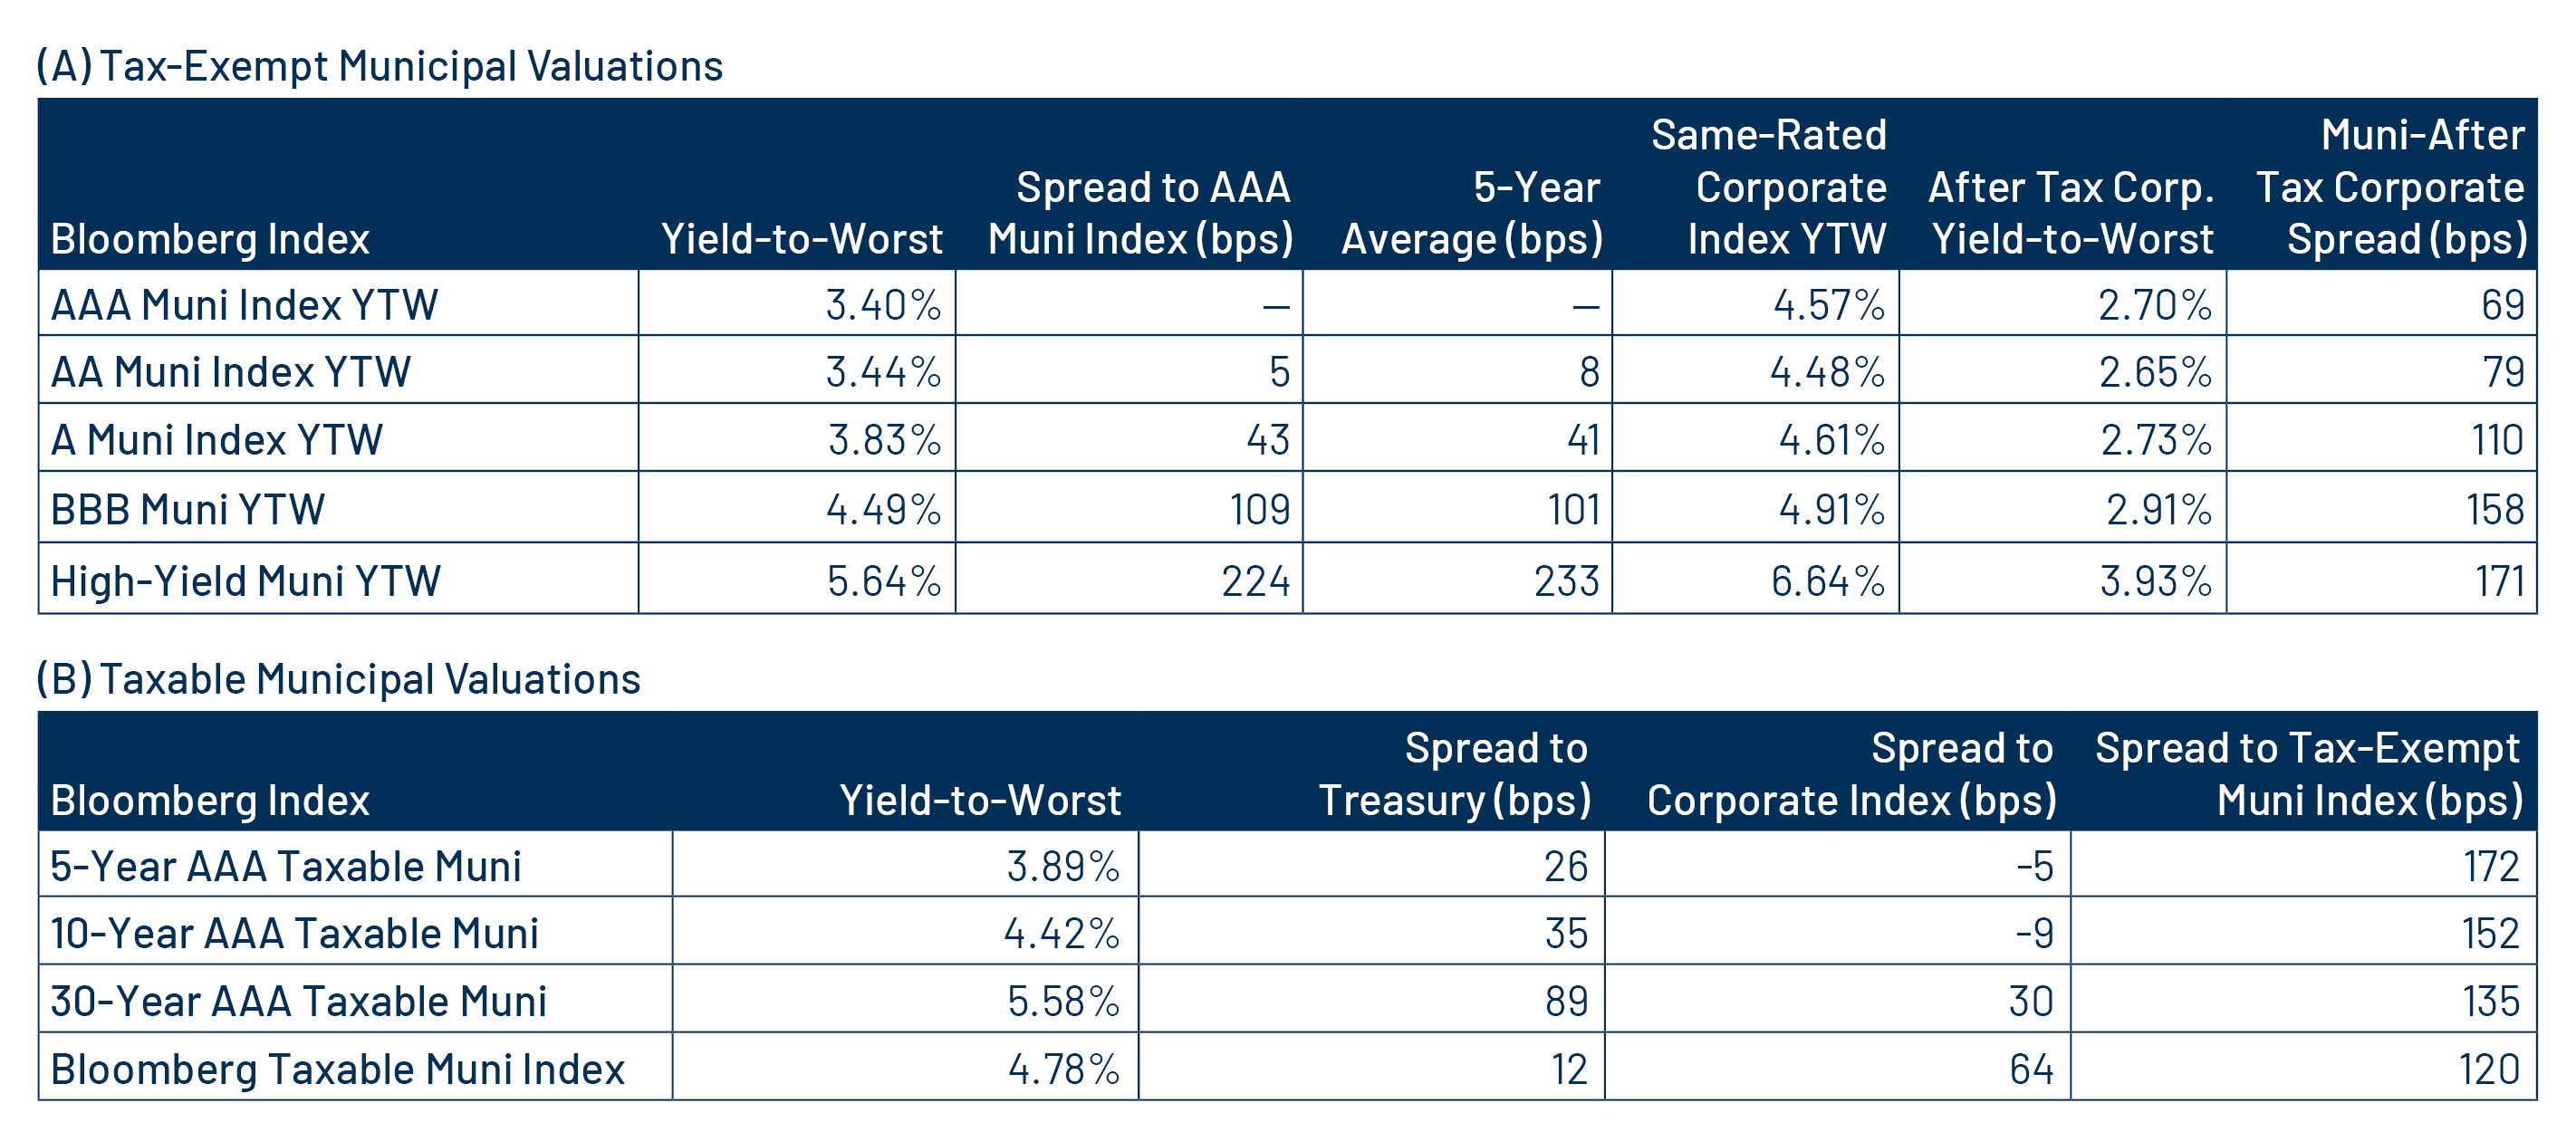
Theme #3: Munis offer attractive after-tax yield compared to taxable alternatives.