skip navigation
Blog

Stay up to date on timely topics and market events. Subscribe to our Blog now.

MARKETS
May 06, 2025

Weekly Municipal Monitor—State and Local Payrolls

By Sam Weitzman

Stay up to date on timely topics and market events. Subscribe to our Blog now.

Macros, Markets and Munis

Municipals posted positive returns last week as demand sharply proliferated and supply remained elevated. Fixed-income markets rallied early in the week as 1Q25 GDP data indicated a 0.3% economic contraction, consumer confidence data declined and fell below expectations and March core PCE data declined from the prior month. The positive sentiment turned by the end of the week, in part due to the stronger-than-expected nonfarm payrolls report, which contributed to US Treasury (UST) rates ultimately ending higher. UST yields moved 6 basis points (bps) to 9 bps lower across the curve, while municipals generally side-stepped the late-week rate selloff as demand rebounded from seven consecutive weeks of outflows. The Bloomberg Municipal Index returned 0.76% during the week, the High Yield Muni Index returned 0.70% and the Taxable Muni Index returned -0.16%. Following the better-than-expected nonfarm payrolls report released Friday, this week we touch on state and local payroll conditions.

Muni Demand Improved as Fund Flows Rebounded Sharply

Fund Flows (up $1.6 billion): During the week ending April 30, weekly reporting municipal mutual funds recorded $1.6 billion of net inflows, according to Lipper. Long-term funds recorded $814 million in inflows, intermediate funds recorded $250 million in inflows, and high yield funds recorded $234 million in inflows. Last week’s inflows end seven consecutive weeks of net outflows and led year-to-date (YTD) inflows higher to $7 billion.

Supply (YTD supply of $179 billion; up 29% YoY): The muni market recorded $19 billion of new-issue supply last week, the highest weekly supply level of the year. YTD, the muni market has recorded $179 billion of new issuance, up 34% year-over-year (YoY). Tax-exempt and taxable issuance are up 28% and 37% respectively, though tax-exempt issuance has comprised the vast majority (93%) of YTD supply. This week’s calendar is expected to decline but remain elevated at $10 billion. The largest deals include $750 million Massachusetts Institute of Technology and $420 million New Hampshire Health Authority transactions.

This Week in Munis: State and Local Payrolls

Entering 2025, expected tax policy changes were a key focus, considering the new administration and the end-of-year expiration of the individual tax reductions associated with the 2017 Tax Cuts and Jobs Act. It has been widely expected that the current tax regime would be either extended or lowered, considering the Republican majority in Congress. Surprisingly, this month it has been reported that the White House has considered increasing the top individual marginal tax rate from 37% to 40% to offset the costs of other budgetary initiatives.

On Friday, the BLS reported nonfarm payrolls of 177,000, which exceeded expectations by 39,000. Despite broader concerns around federal funding cuts contributing to lower government payrolls, state and local payrolls have been resilient. According to the BLS data, YTD federal government payrolls declined 23,000, while state and local payrolls increased by 75,000.

Exhibit 1: Year-to-Date Change in Government Payrolls
Year-to-Date Change in Government Payrolls
Source: BLS, Bloomberg, Western Asset. As of 02 May 25. Select the image to expand the view.

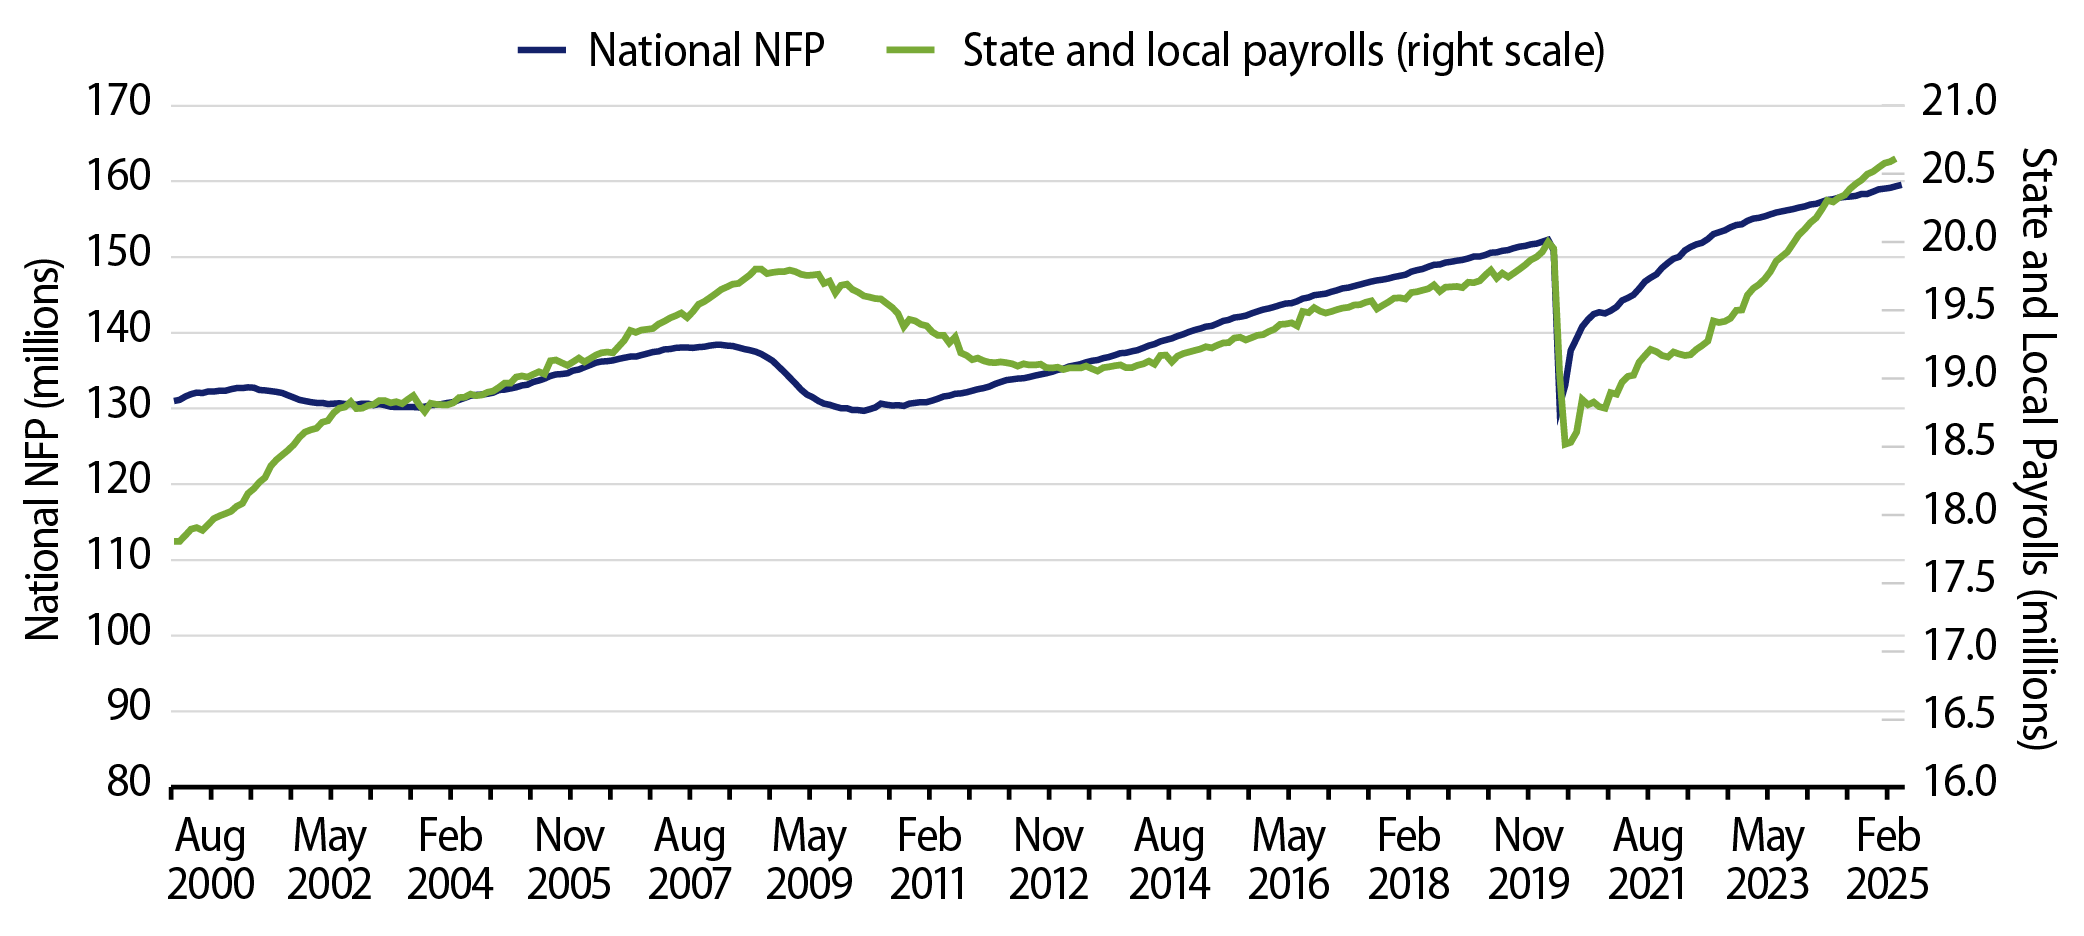
Heading into Friday’s payroll report, state and local payrolls have been growing at a faster pace than national nonfarm payrolls. From the end of 2022 through the first quarter of 2025, state and local payroll growth of 6% well exceeded the national pace of 3%. This faster pace of job growth contrasts with the slower state and local payroll growth observed immediately following the depths of the pandemic from April 2020 to the end of 2022, when state and local payrolls grew just 2% versus the national payroll trend of 18%. State and local payrolls currently exceed pre-pandemic highs by 3%, while national payrolls remain 5% above pre-pandemic high levels.

Exhibit 2: National vs. State and Local Payrolls
National vs. State and Local Payrolls
Source: BLS, Bloomberg, Western Asset. As of 02 May 25. Select the image to expand the view.

The relatively strong payroll print last week as well as the rebound in state of local payrolls are indicative of the favorable fundamental backdrop for municipal credit. However, as federal funding concerns transpire from the state and local levels and several large issuers record budget gaps, Western Asset anticipates that municipal payroll growth could slow going forward. We continue to believe municipal investors are rewarded for lower credit quality exposures that are supported by the strong economic trends, but at tighter spread levels, we expect that diligent credit selection is of increased importance.

Municipal Credit Curves and Relative Value

Exhibit 3: Muni Credit Curves
Muni Credit Curves
Source: Bloomberg, Western Asset. As of 02 May 25. Bloomberg Valuation Service (BVAL) Municipal Credit Indices (AAA, AA, A, BBB, respectively) and US Sovereign Curves. Taxable-Equivalent Muni Credit Curves consider the top marginal effective tax rate of 40.8%. AA Muni is represented by the US General Obligation AA Muni BVAL Yield Curve. The BVAL curve is populated with pricing from uninsured AA General Obligation bonds. A Muni is represented by the US General Obligation A Muni BVAL Yield Curve. The BVAL curve is populated with pricing from uninsured A General Obligation bonds. BBB Muni is represented by the US General Obligation BBB Muni BVAL Yield Curve. The BVAL curve is populated with pricing from uninsured BBB General Obligation bonds. Indices are unmanaged and one cannot directly invest in them. They do not include fees, expenses or sales charges. Past performance is not an indicator or a guarantee of future results. Select the image to expand the view.
Exhibit 4: Taxable-Equivalent Muni Credit Curves
Taxable-Equivalent Muni Credit Curves
Source: Bloomberg, Western Asset. As of 02 May 25. Bloomberg Valuation Service (BVAL) Municipal Credit Indices (AAA, AA, A, BBB, respectively) and US Sovereign Curves. Taxable-Equivalent Muni Credit Curves consider the top marginal effective tax rate of 40.8%. AA Muni is represented by the US General Obligation AA Muni BVAL Yield Curve. The BVAL curve is populated with pricing from uninsured AA General Obligation bonds. A Muni is represented by the US General Obligation A Muni BVAL Yield Curve. The BVAL curve is populated with pricing from uninsured A General Obligation bonds. BBB Muni is represented by the US General Obligation BBB Muni BVAL Yield Curve. The BVAL curve is populated with pricing from uninsured BBB General Obligation bonds. Indices are unmanaged and one cannot directly invest in them. They do not include fees, expenses or sales charges. Past performance is not an indicator or a guarantee of future results. Select the image to expand the view.
Exhibit 5: AAA Munis vs. Treasuries
AAA Munis vs. Treasuries
Source: Muni Yields: Thomson Reuters MMD, Treasury Yields: Bloomberg. As of 02 May 25. Past performance is not a guarantee of future results. It is not possible to invest directly in an index. Select the image to expand the view.
Exhibit 6: Tax-Exempt and Taxable Muni Valuations
Tax-Exempt and Taxable Muni Valuations
Source: Bloomberg, Western Asset. As of 02 May 25. Yield-to-worst (YTW) is the lowest potential yield that can be received on a bond without the issuer actually defaulting. AAA, AA, A, BBB Corporate Indices; After-Tax Yield assumes a top effective tax rate of 40.8%. Taxable Muni Index Corporate comparable used is the Global Corporate Aggregate (ex. BBB) to better align credit quality and duration. Select the image to expand the view.

Western Asset Key Themes for Muni Investors

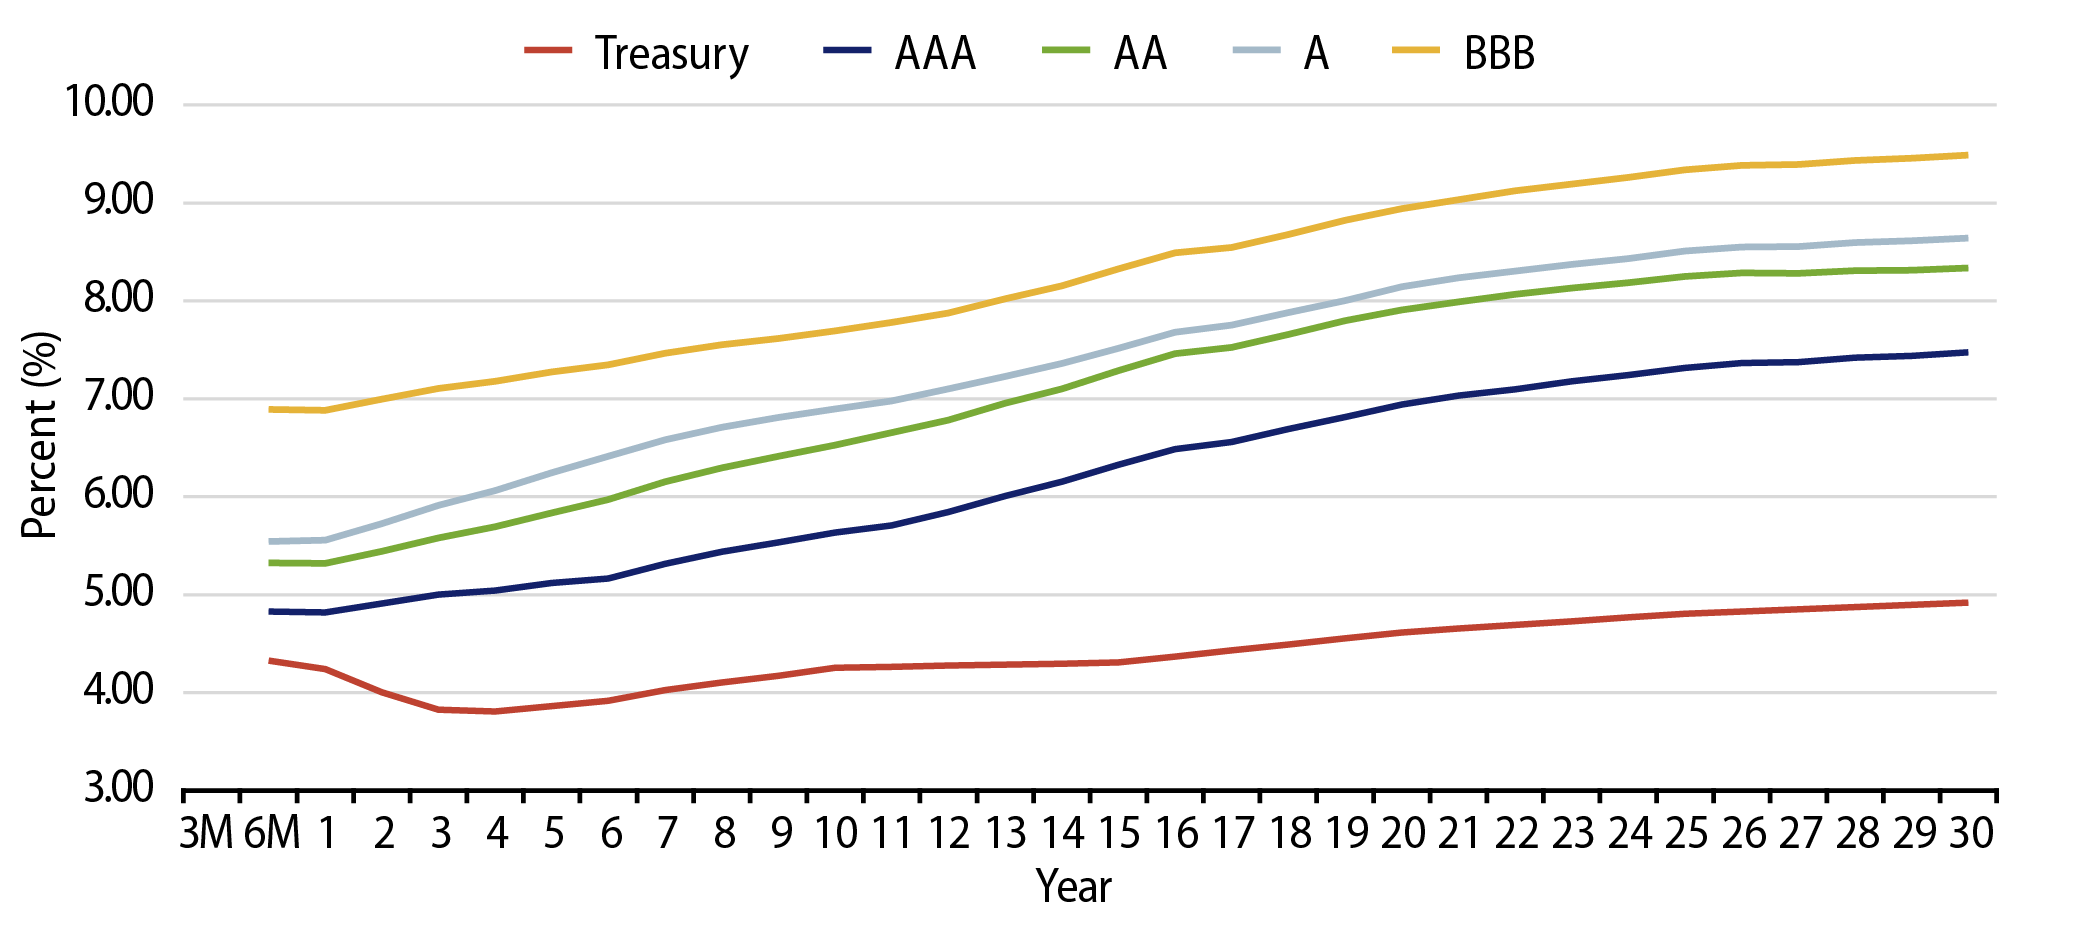
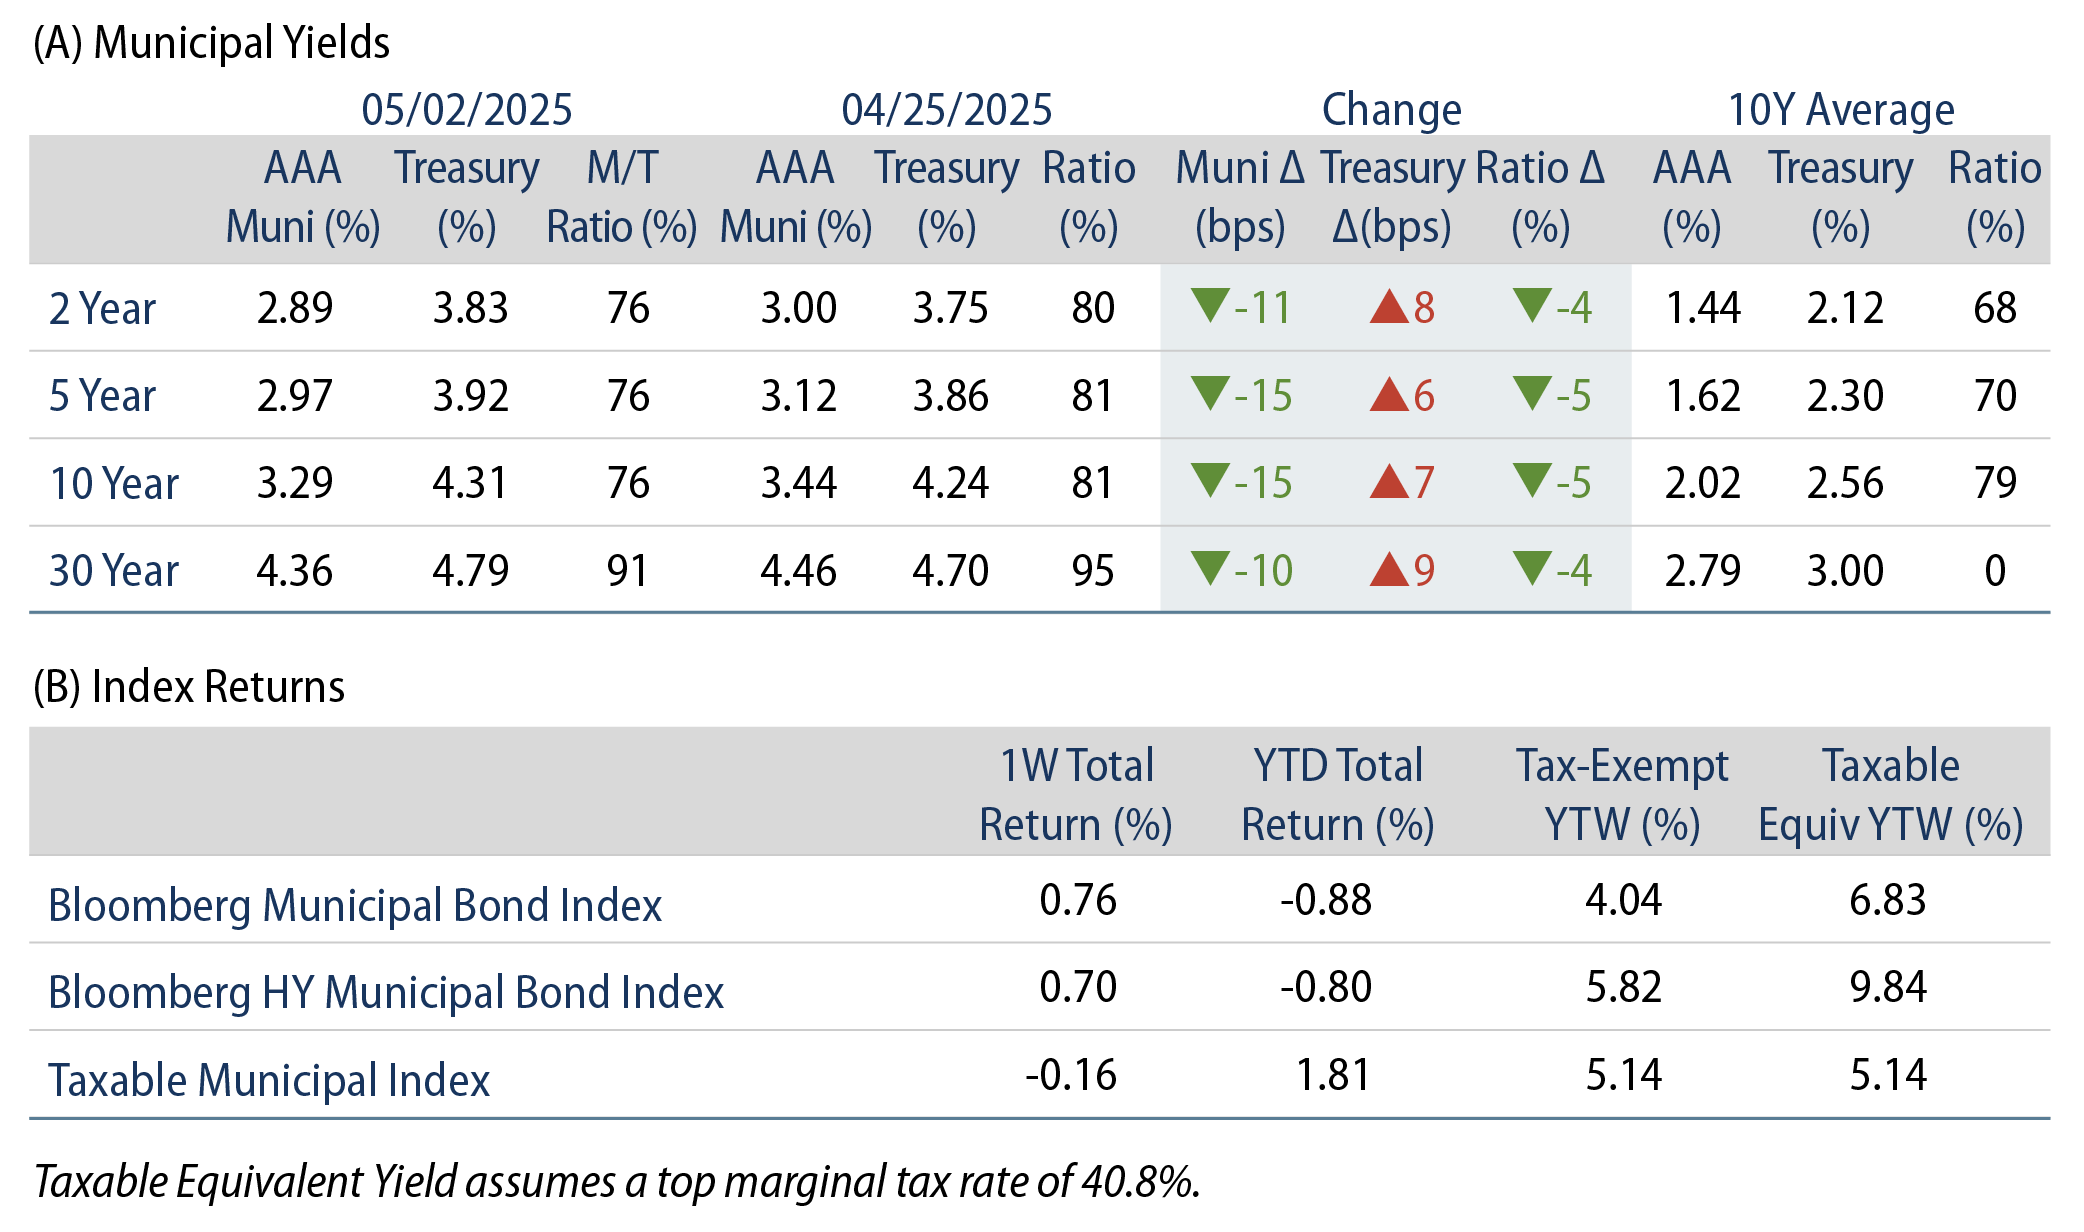
Theme #1: Municipal taxable-equivalent yields and income opportunities spiked to decade-high levels.

Exhibit 7: Muni and Taxable-Equivalent Muni Yield-to-Worst
Muni and Taxable-Equivalent Muni Yield-to-Worst
Source: Bloomberg, Western Asset. As of 02 May 25. Bloomberg Municipal Bond Index yield considering highest marginal tax rate of 40.8%. Indexes are unmanaged and one cannot directly invest in them. They do not include fees, expenses or sales charges. Past performance is not an indicator or a guarantee of future results. Select the image to expand the view.

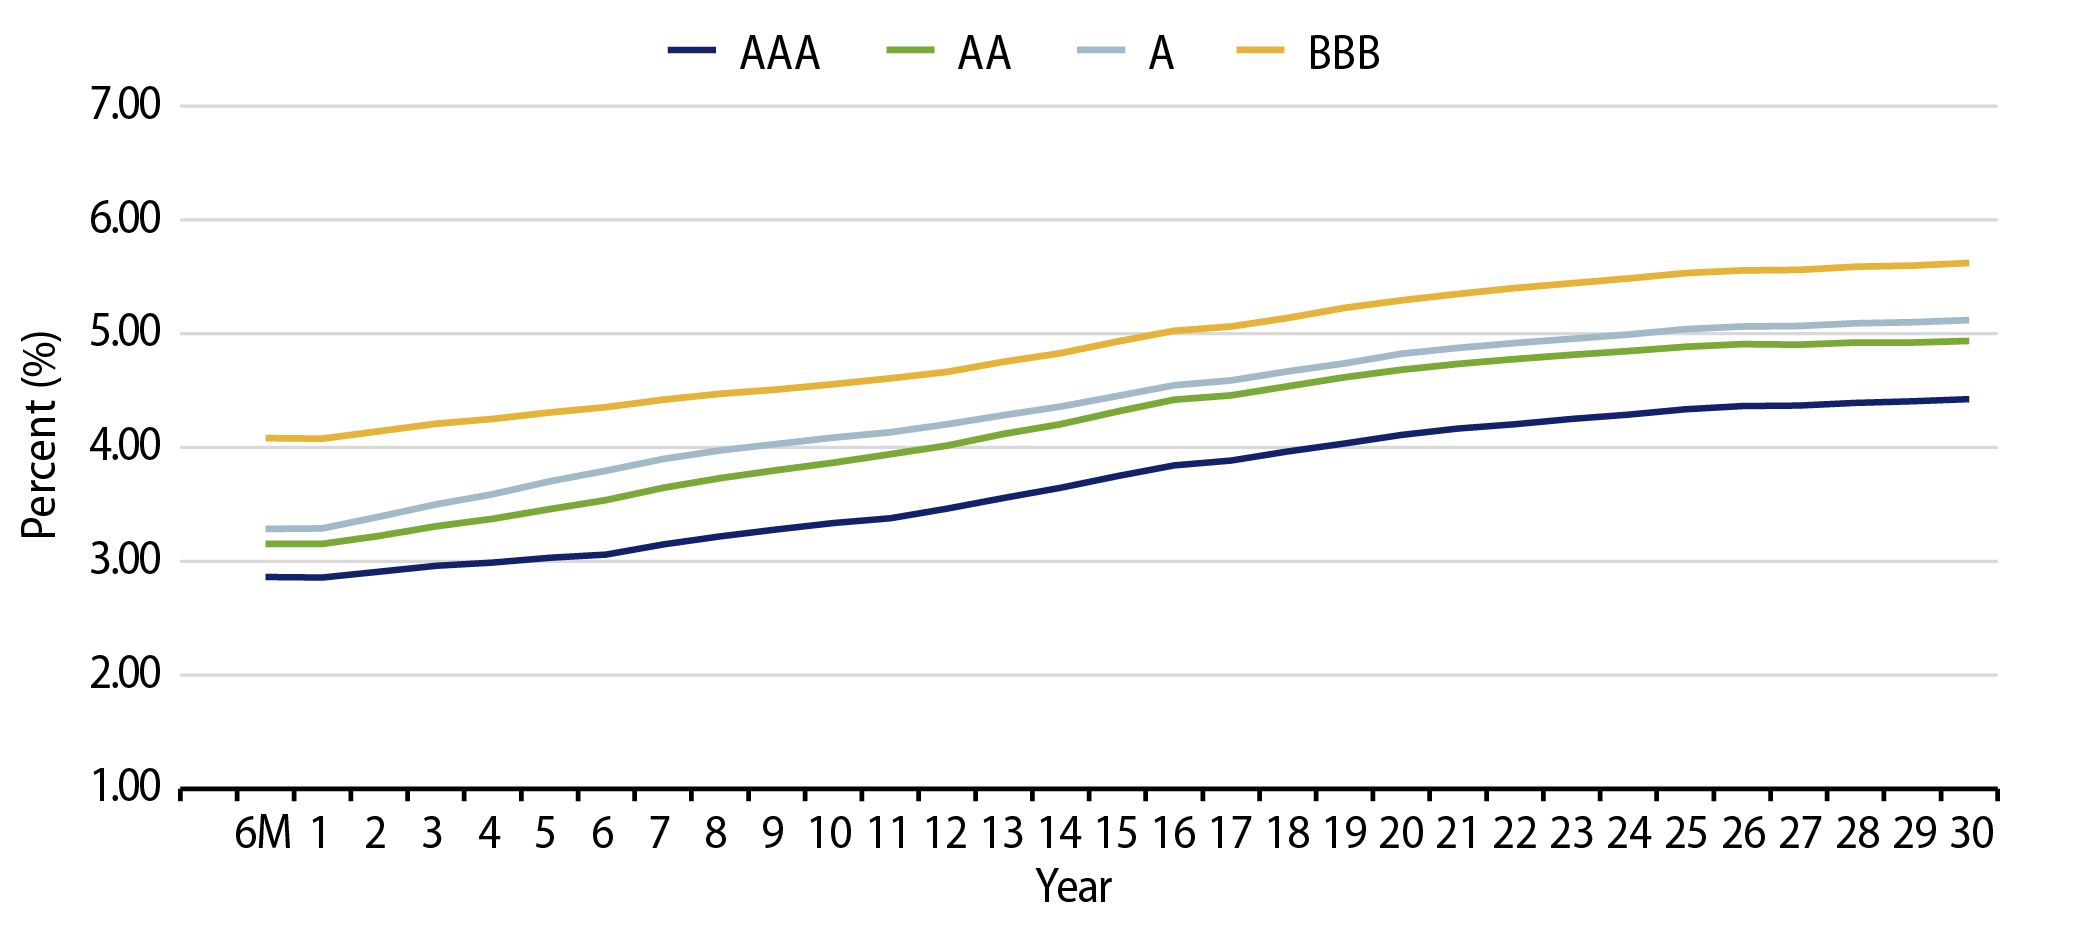
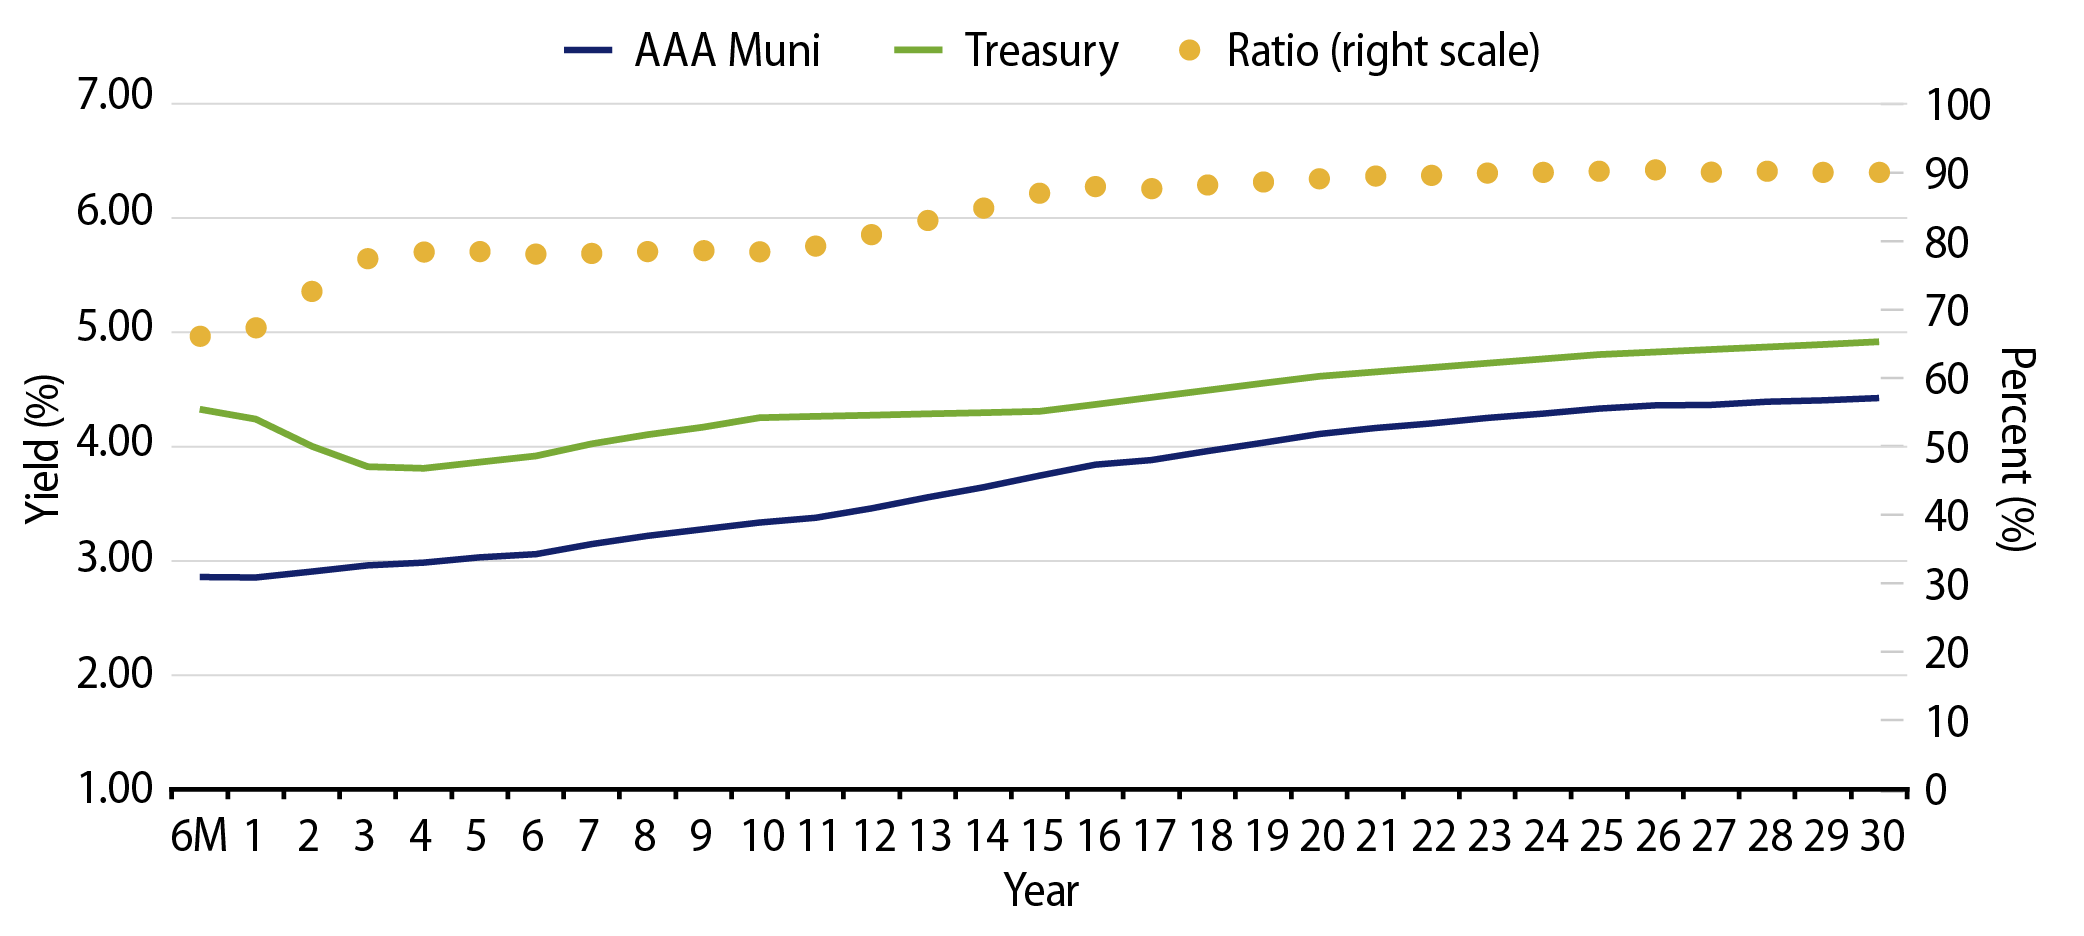
Theme #2: The muni curve has steepened, offering better value in intermediate and longer maturities.

Exhibit 8: AAA Municipal vs. Treasury Yield Curves
AAA Municipal vs. Treasury Yield Curves
Source: Bloomberg, Western Asset. As of 02 May 25. Bloomberg Valuation Service (BVAL) AAA Muni Curve and US On-/Off-the-Run Sovereign Curve. Indexes are unmanaged and one cannot directly invest in them. They do not include fees, expenses or sales charges. Past performance is not an indicator or a guarantee of future results. Select the image to expand the view.

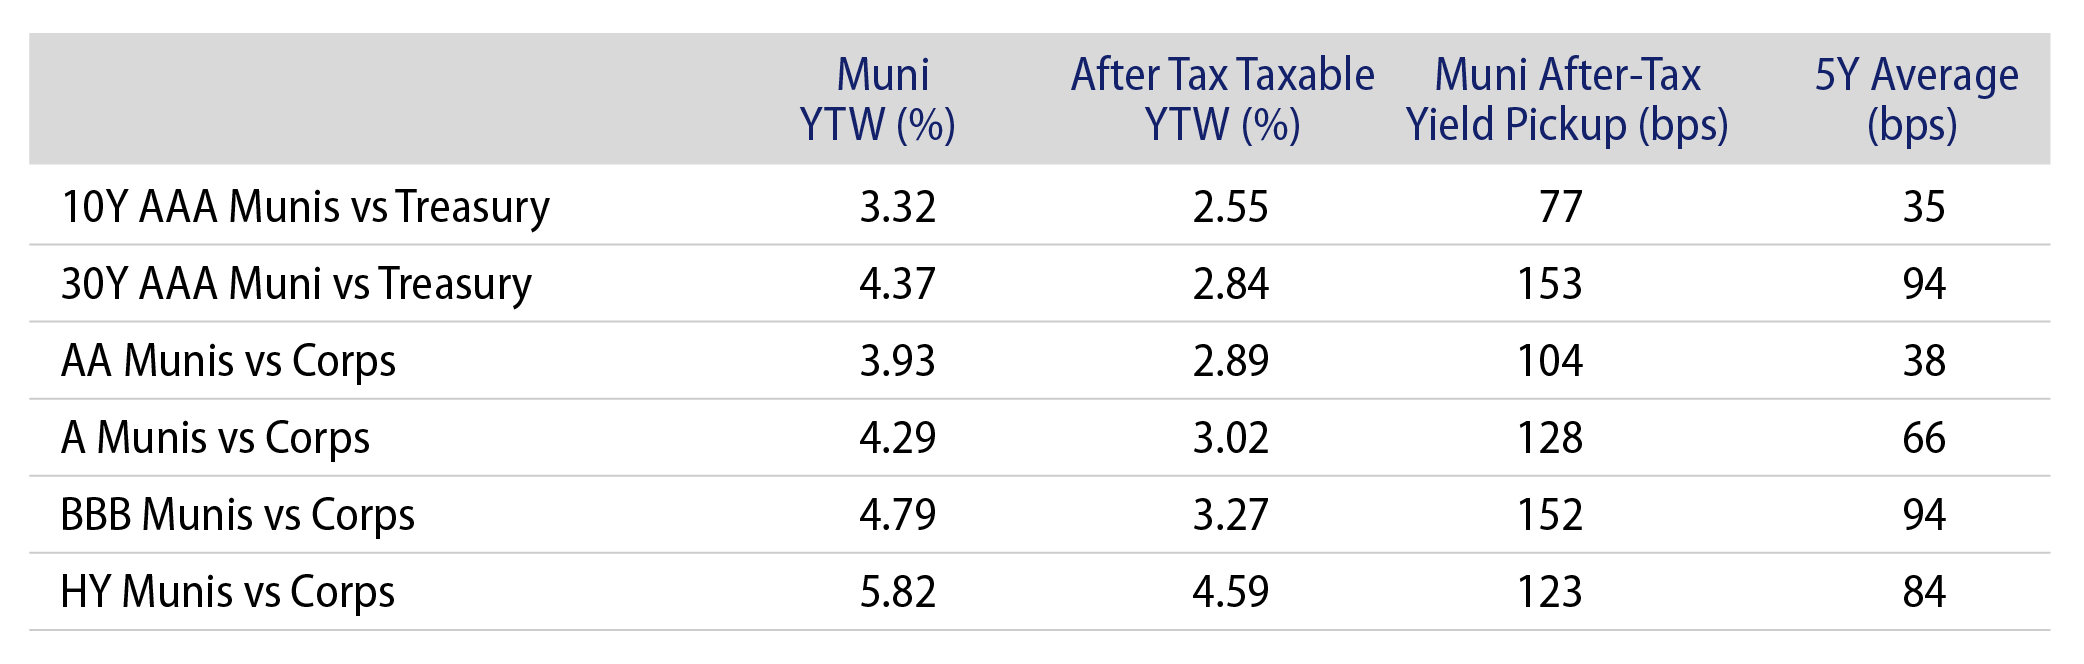
Theme #3: Munis offer attractive after-tax yield compared to taxable alternatives.

Exhibit 9: Municipal vs. Taxable Fixed-Income Yields by Quality
Municipal vs. Taxable Fixed-Income Yields by Quality
Source: Western Asset, Bloomberg. As of 02 May 25. 10- and 30-Year comparison reflects Bloomberg Valuation Service (BVAL) AAA Muni Curve and US On-/Off-the-Run Sovereign Curve. AA Muni reflects the Bloomberg AA Muni Bond Index. A Muni reflects the Bloomberg A Muni Bond Index. BBB Muni reflects the Bloomberg BBB Muni Bond Index. HY Muni reflects the Bloomberg High Yield Muni Bond Index. AA Corp reflects the Bloomberg AA Corporate Bond Index. A Corp reflects the Bloomberg A Corporate Bond Index. BBB Corp reflects the Bloomberg BBB Corporate Bond Index. After-tax yield considers top marginal tax rate of 40.8%. Indexes are unmanaged and one cannot directly invest in them. They do not include fees, expenses or sales charges. Past performance is not an indicator or a guarantee of future results. Select the image to expand the view.

© Western Asset Management Company, LLC 2025. The information contained in these materials ("the materials") is intended for the exclusive use of the designated recipient ("the recipient"). This information is proprietary and confidential and may contain commercially sensitive information, and may not be copied, reproduced or republished, in whole or in part, without the prior written consent of Western Asset Management Company ("Western Asset").
Past performance does not predict future returns. These materials should not be deemed to be a prediction or projection of future performance. These materials are intended for investment professionals including professional clients, eligible counterparties, and qualified investors only.
These materials have been produced for illustrative and informational purposes only. These materials contain Western Asset's opinions and beliefs as of the date designated on the materials; these views are subject to change and may not reflect real-time market developments and investment views.
Third party data may be used throughout the materials, and this data is believed to be accurate to the best of Western Asset's knowledge at the time of publication, but cannot be guaranteed. These materials may also contain strategy or product awards or rankings from independent third parties or industry publications which are based on unbiased quantitative and/or qualitative information determined independently by each third party or publication. In some cases, Western Asset may subscribe to these third party's standard industry services or publications. These standard subscriptions and services are available to all asset managers and do not influence rankings or awards in any way.
Investment strategies or products discussed herein may involve a high degree of risk, including the loss of some or all capital. Investments in any products or strategies described in these materials may be volatile, and investors should have the financial ability and willingness to accept such risks.
Unless otherwise noted, investment performance contained in these materials is reflective of a strategy composite. All other strategy data and information included in these materials reflects a representative portfolio which is an account in the composite that Western Asset believes most closely reflects the current portfolio management style of the strategy. Performance is not a consideration in the selection of the representative portfolio. The characteristics of the representative portfolio shown may differ from other accounts in the composite. Information regarding the representative portfolio and the other accounts in the composite are available upon request. Statements in these materials should not be considered investment advice. References, either general or specific, to securities and/or issuers in the materials are for illustrative purposes only and are not intended to be, and should not be interpreted as, recommendation to purchase or sell such securities. Employees and/or clients of Western Asset may have a position in the securities or issuers mentioned.
These materials are not intended to provide, and should not be relied on for, accounting, legal, tax, investment or other advice. The recipient should consult its own counsel, accountant, investment, tax, and any other advisers for this advice, including economic risks and merits, related to making an investment with Western Asset. The recipient is responsible for observing the applicable laws and regulations of their country of residence.
Founded in 1971, Western Asset Management Company is a global fixed-income investment manager with offices in Pasadena, New York, London, Singapore, Tokyo, Melbourne, São Paulo, Hong Kong, and Zürich. Western Asset is a wholly owned subsidiary of Franklin Resources, Inc. but operates autonomously. Western Asset is comprised of six legal entities across the globe, each with distinct regional registrations: Western Asset Management Company, LLC, a registered Investment Adviser with the Securities and Exchange Commission; Western Asset Management Company Ltda. is regulated by Comissão de Valores Mobiliários; Western Asset Management Company Pty Ltd ABN 41 117 767 923 is the holder of the Australian Financial Services License 303160; Western Asset Management Company Pte. Ltd. Co. Reg. No. 200007692R is a holder of a Capital Markets Services License for fund management and regulated by the Monetary Authority of Singapore; Western Asset Management Company Ltd, a registered Financial Instruments Business Operator and regulated by the Financial Services Agency of Japan; and Western Asset Management Company Limited is authorised and regulated by the Financial Conduct Authority ("FCA") (FRN 145930). This communication is intended for distribution to Professional Clients only if deemed to be a financial promotion in the UK as defined by the FCA. This communication may also be intended for certain EEA countries where Western Asset has been granted permission to do so. For the current list of the approved EEA countries please contact Western Asset at +44 (0)20 7422 3000.