skip navigation
Blog

Stay up to date on timely topics and market events. Subscribe to our Blog now.

MARKETS
July 29, 2025

Weekly Municipal Monitor—Stable Reserves Underscore State Budget Health

By Sam Weitzman

Stay up to date on timely topics and market events. Subscribe to our Blog now.

Macros, Markets and Munis

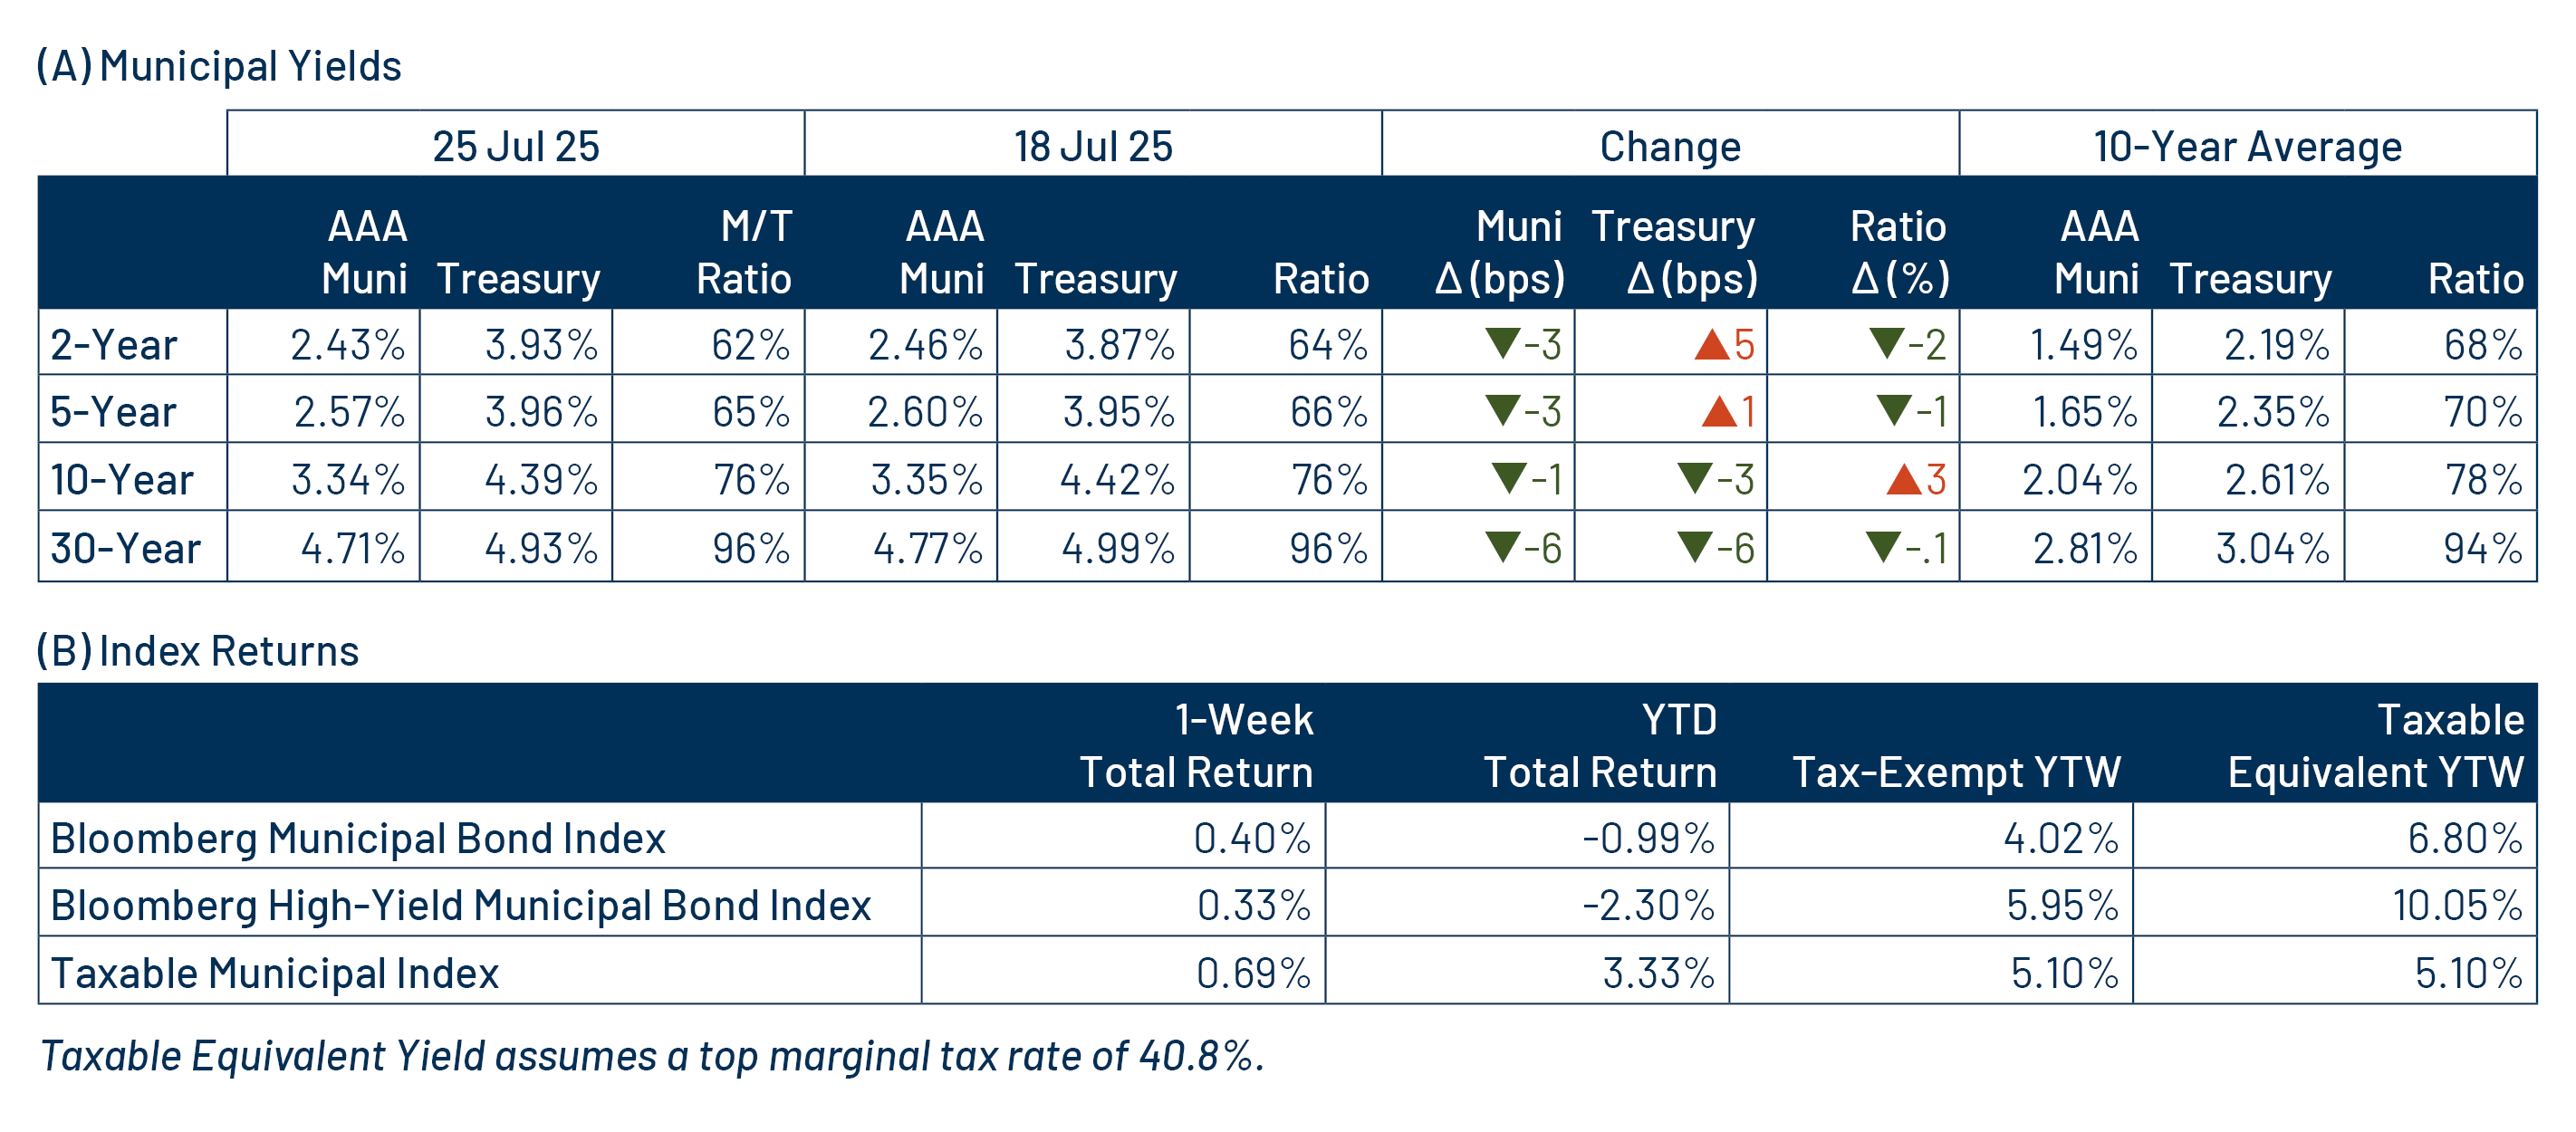
Municipals posted positive returns last week and outperformed Treasuries as the Treasury curve flattened, with yields moving higher in short maturities and lower in longer maturities. High-grade muni yields moved lower across the curve, also generally outperforming Treasuries. Markets were focused on tariff rhetoric ahead of this week’s August 1 deadline. The agreement between US and Japan regarding 15% tariffs was welcomed by markets as less severe than expected, and a potential framework for other agreements. This week’s economic calendar is much busier with JOLTs, payrolls, GDP and consumer confidence data as well as the Federal Open Market Committee (FOMC) meeting. Meanwhile, technicals strengthened as funds recorded inflows. As most states closed out fiscal year 2025 last month, here we review the health of state budgets heading into the new fiscal year.

Flows Turn Positive as the Upcoming New-Issue Calendar Slows

Fund Flows (up $572 million): During the week ending July 23, weekly reporting municipal mutual funds recorded $572 million of net inflows, according to Lipper. Intermediate funds recorded $475 million of net inflows, short and short/intermediate funds recorded $332 million of net inflows. Long-term and high-yield categories recorded $235 million and $202 million of net outflows, respectively. Last week’s inflows led year-to-date (YTD) inflows higher to $15 billion.

Supply (YTD supply of $327 billion; up 25% YoY): The muni market recorded $15 billion of new-issue supply last week, which was in line with the elevated pace also observed in the prior week. YTD new-issue supply of $327 billion is 27% higher than the prior year, with tax-exempt issuance up 27% year-over-year (YoY) and taxable issuance up 6%, respectively. This week’s calendar is expected to remain elevated at $12 billion. The largest deals include $3.5 billion Georgia SR 400 Express Lanes and $1.5 billion State of Washington General Obligation transactions.

This Week in Munis: Stable Reserves Underscore State Budget Health

June 30 marked the end of fiscal year 2025 for 46 states and the District of Columbia. As highlighted in our recent June 17 blog, state and local revenue collections have remained near record highs, supporting municipal credit in recent years. These robust tax collections have been driven by a favorable labor market, strong consumer activity and attractive real estate values which have bolstered property tax payments.

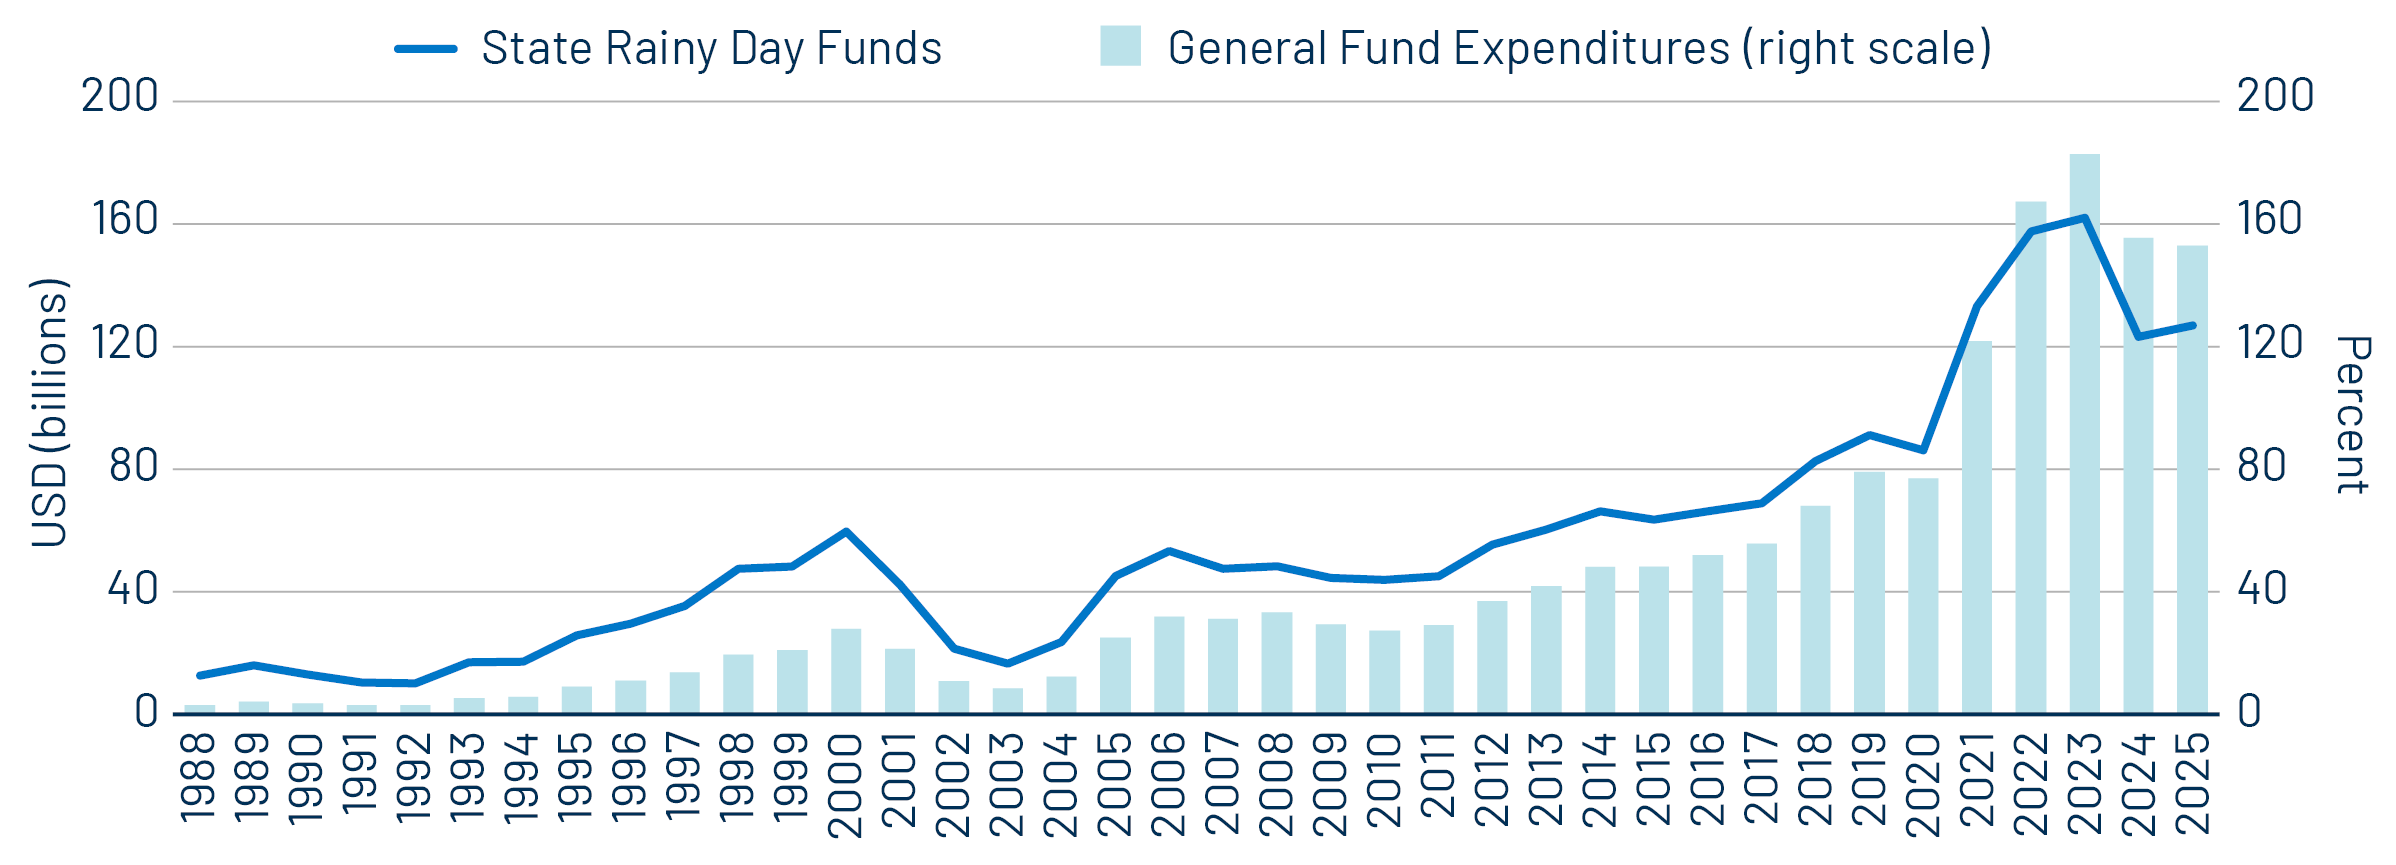
The strong revenue projections reported by the Census were corroborated by the National Association of State Budget Officers (NASBO) Spring survey, which noted that states’ fiscal 2025 general fund revenues exceeded expectations. However, the NASBO survey also pointed out that higher-than-expected spending of prior unanticipated surpluses contributed to a modest 1.6% YoY decline in fund balances. Despite this decline, rainy day funds remain five times higher than the balances held in 2007, prior to the global financial crisis. Overall, these reserves now comprise 13% of general fund expenditures, compared to just 4.7% in 2007.

Exhibit 1: State Rainy Day Funds vs. Expenditures
State Rainy Day Funds vs. Expenditures
Source: National Association of State Budget Officers, Western Asset. As of 18 Dec 24. Select the image to expand the view.

Western Asset believes that this data reflects the credit stability of traditional state and local credit and that most municipalities are better positioned to navigate a negative economic cycle than in previous downturns. As we move into fiscal year 2026, most state budgets are proposing tighter conditions in response to slower revenue growth and the winding down of federal Covid-related aid, along with other potential funding changes. We believe these considerations are prudent and may help moderate expenditure growth compared to recent years. Additionally, they provide the potential for upside surprises should growth remain resilient.

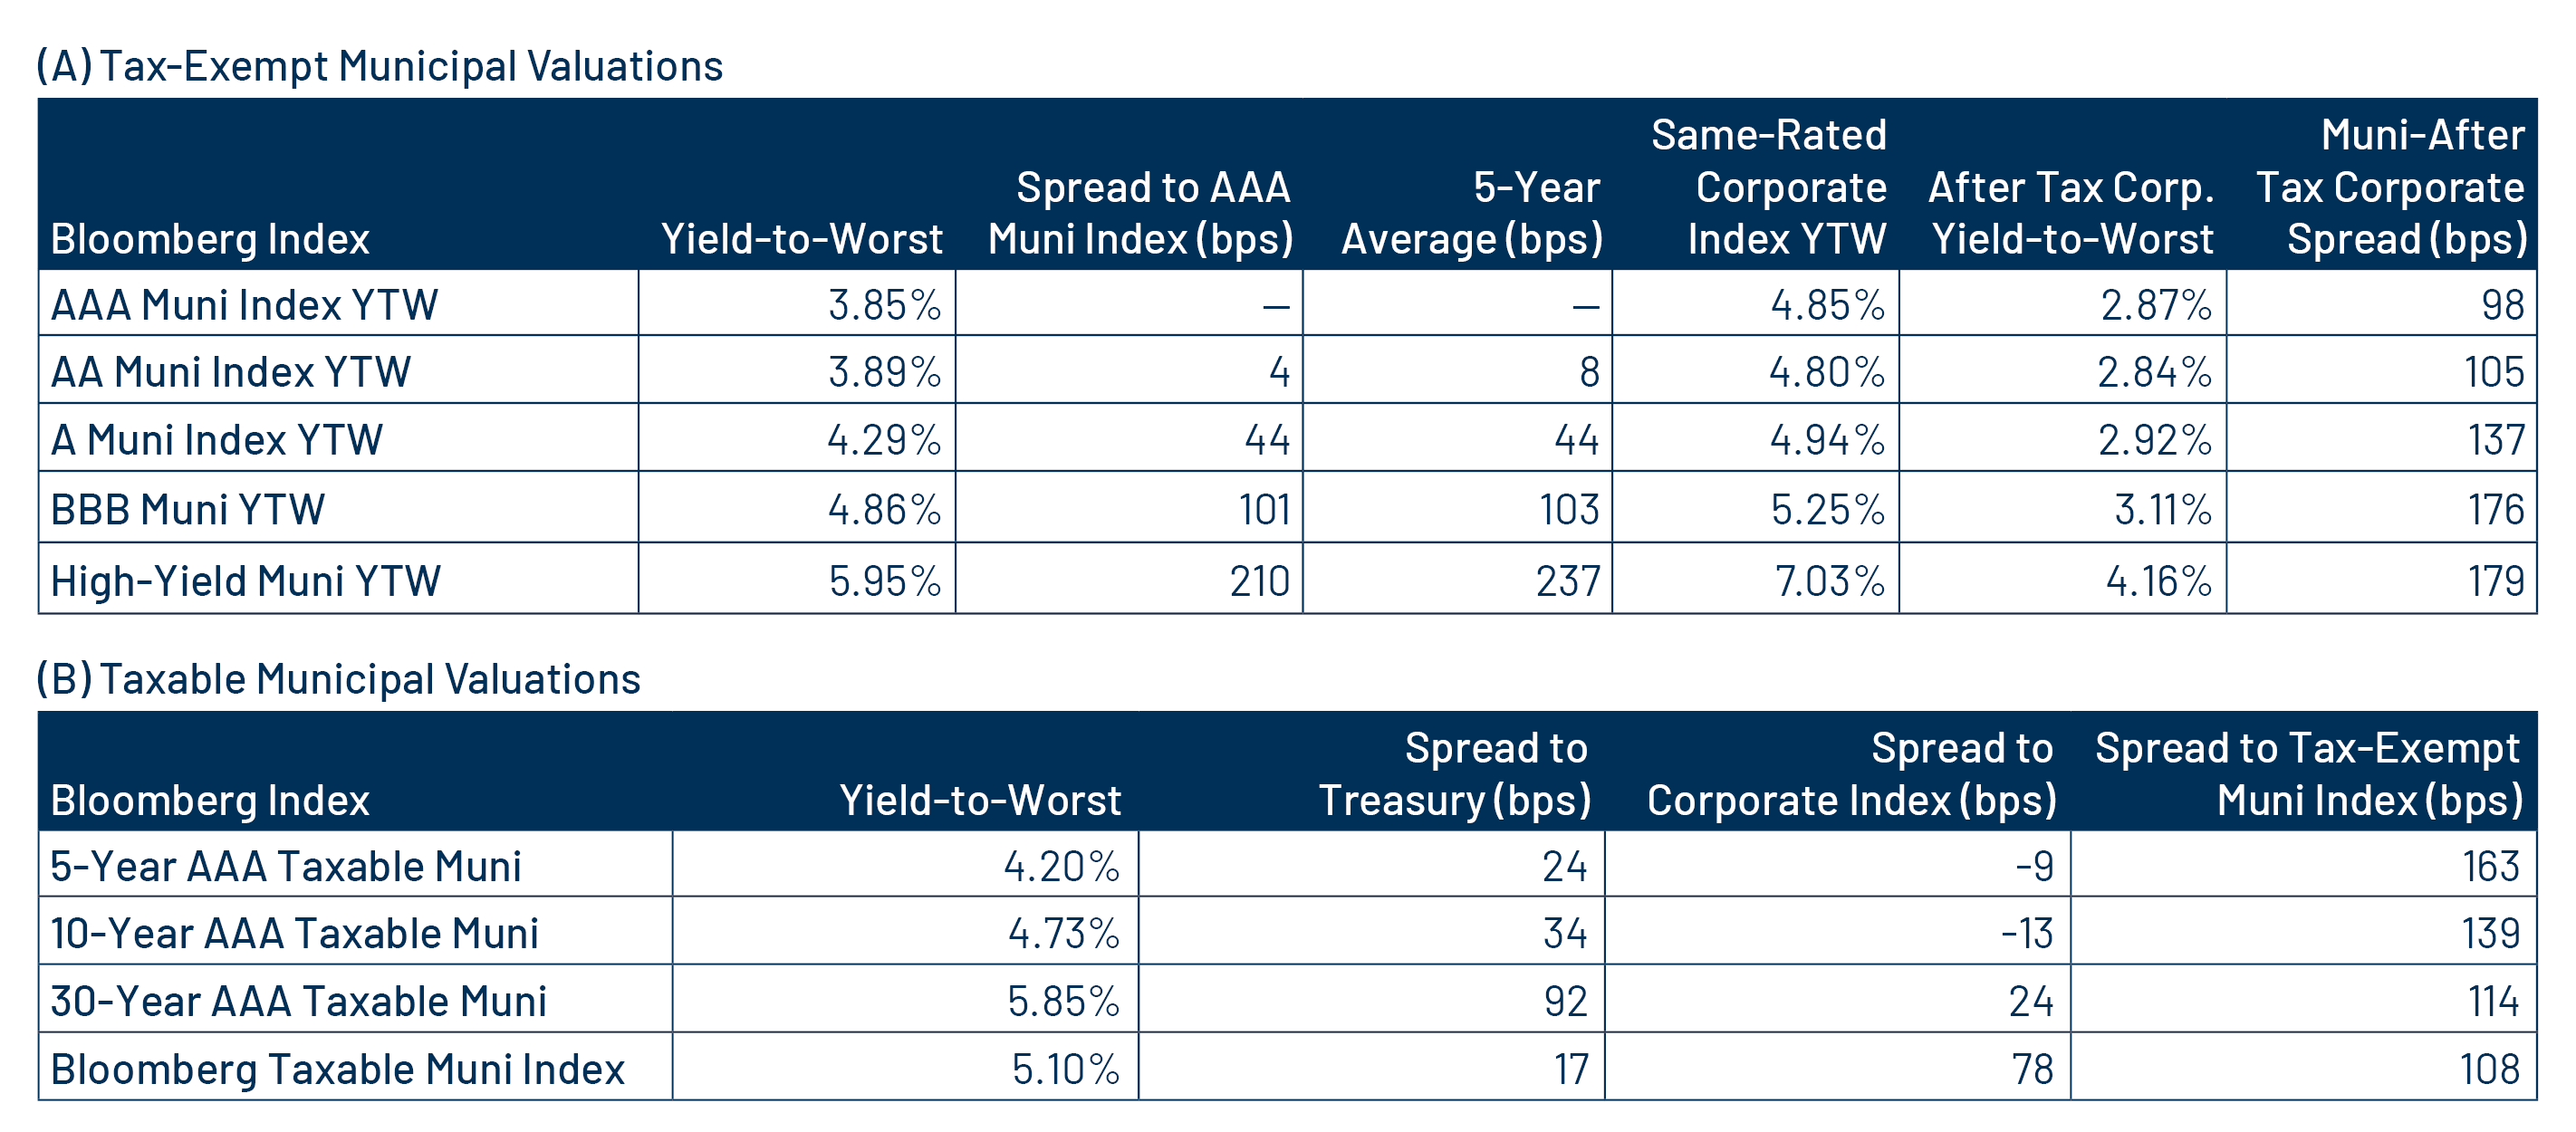
Municipal Credit Curves and Relative Value

Exhibit 2: Muni Credit Curves
Muni Credit Curves
Source: Bloomberg, Western Asset. As of 25 Jul 25. Bloomberg Valuation Service (BVAL) Municipal Credit Indices (AAA, AA, A, BBB, respectively) and US Sovereign Curves. Taxable-Equivalent Muni Credit Curves consider the top marginal effective tax rate of 40.8%. AA Muni is represented by the US General Obligation AA Muni BVAL Yield Curve. The BVAL curve is populated with pricing from uninsured AA General Obligation bonds. A Muni is represented by the US General Obligation A Muni BVAL Yield Curve. The BVAL curve is populated with pricing from uninsured A General Obligation bonds. BBB Muni is represented by the US General Obligation BBB Muni BVAL Yield Curve. The BVAL curve is populated with pricing from uninsured BBB General Obligation bonds. Indices are unmanaged and one cannot directly invest in them. They do not include fees, expenses or sales charges. Past performance is not an indicator or a guarantee of future results. Select the image to expand the view.
Exhibit 3: Taxable-Equivalent Muni Credit Curves
Taxable-Equivalent Muni Credit Curves
Source: Bloomberg, Western Asset. As of 25 Jul 25. Bloomberg Valuation Service (BVAL) Municipal Credit Indices (AAA, AA, A, BBB, respectively) and US Sovereign Curves. Taxable-Equivalent Muni Credit Curves consider the top marginal effective tax rate of 40.8%. AA Muni is represented by the US General Obligation AA Muni BVAL Yield Curve. The BVAL curve is populated with pricing from uninsured AA General Obligation bonds. A Muni is represented by the US General Obligation A Muni BVAL Yield Curve. The BVAL curve is populated with pricing from uninsured A General Obligation bonds. BBB Muni is represented by the US General Obligation BBB Muni BVAL Yield Curve. The BVAL curve is populated with pricing from uninsured BBB General Obligation bonds. Indices are unmanaged and one cannot directly invest in them. They do not include fees, expenses or sales charges. Past performance is not an indicator or a guarantee of future results. Select the image to expand the view.
Exhibit 4: AAA Munis vs. Treasuries
AAA Munis vs. Treasuries
Source: Muni Yields: Thomson Reuters MMD, Treasury Yields: Bloomberg. As of 25 Jul 25. Past performance is not a guarantee of future results. It is not possible to invest directly in an index. Select the image to expand the view.
Exhibit 5: Tax-Exempt and Taxable Muni Valuations
Tax-Exempt and Taxable Muni Valuations
Source: Bloomberg, Western Asset. As of 25 Jul 25. Yield-to-worst (YTW) is the lowest potential yield that can be received on a bond without the issuer actually defaulting. AAA, AA, A, BBB Corporate Indices; After-Tax Yield assumes a top effective tax rate of 40.8%. Taxable Muni Index Corporate comparable used is the Global Corporate Aggregate (ex. BBB) to better align credit quality and duration. Select the image to expand the view.

Western Asset Key Themes for Muni Investors

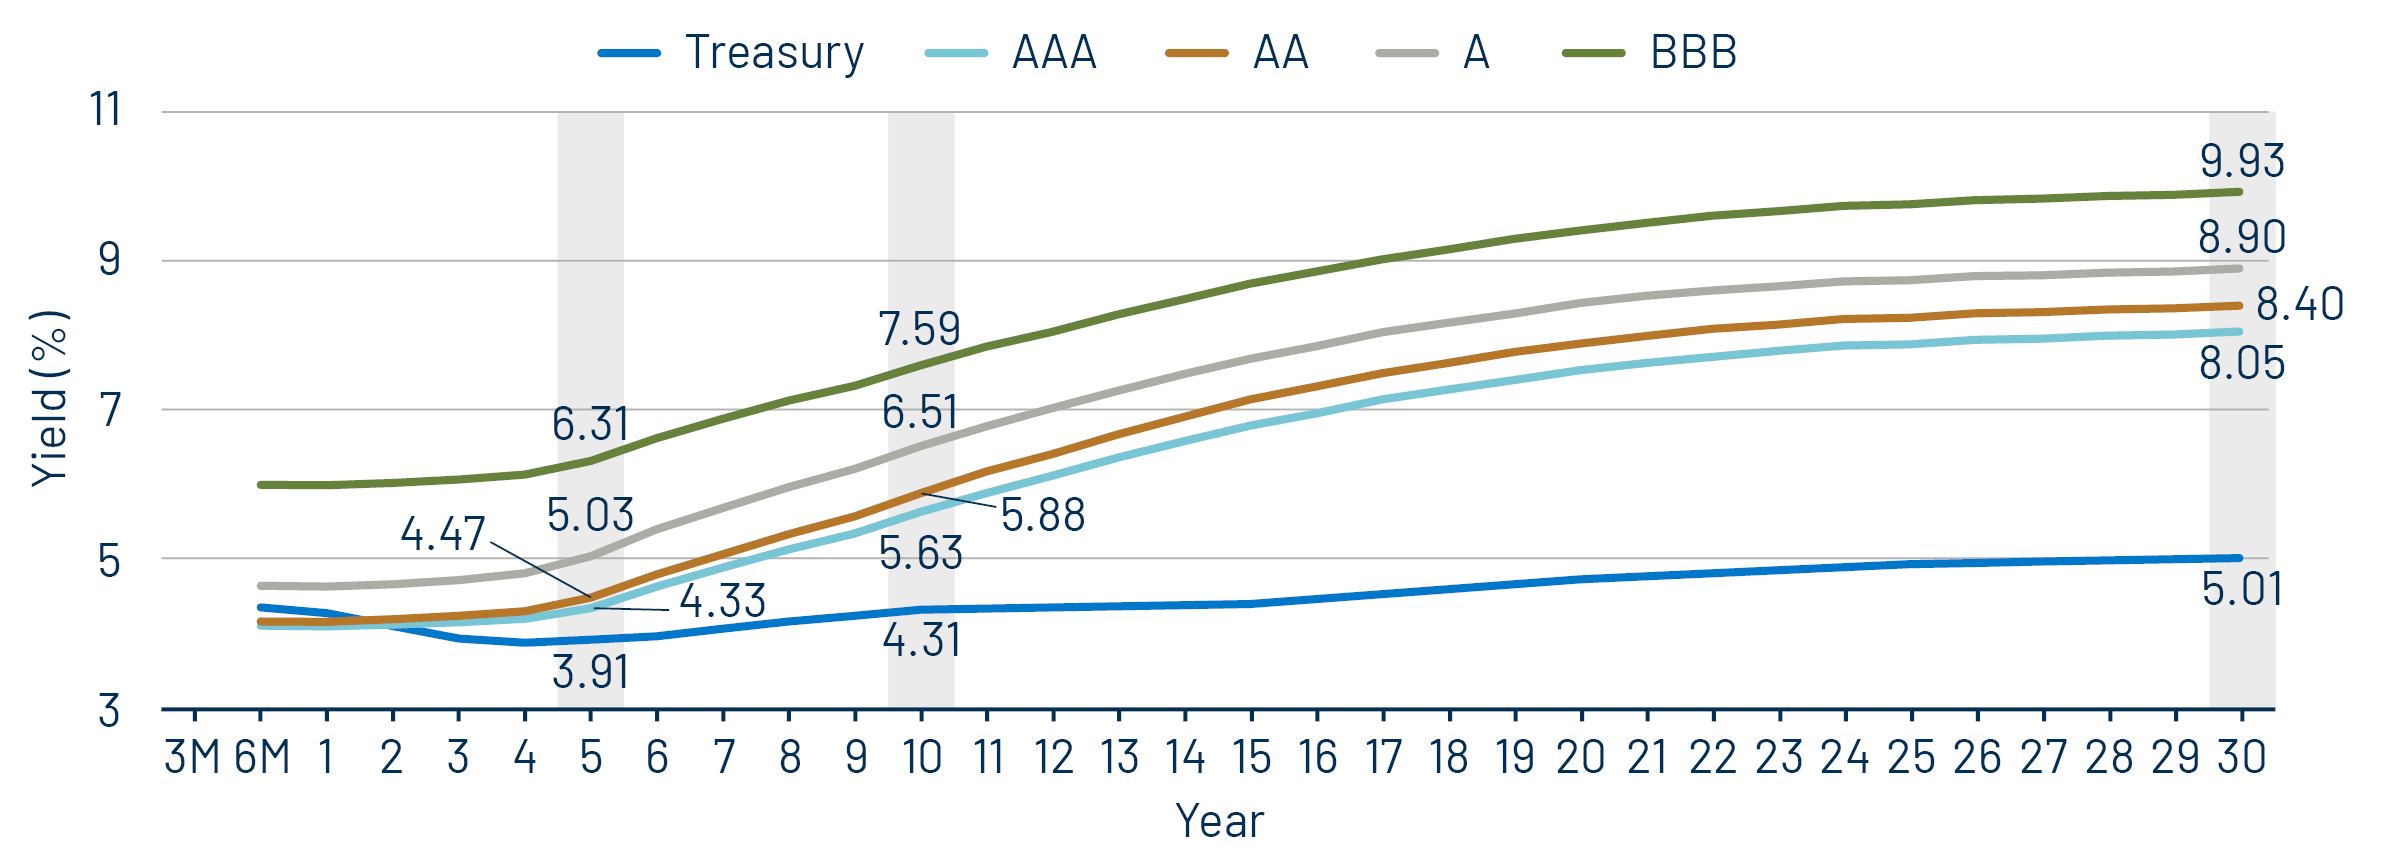
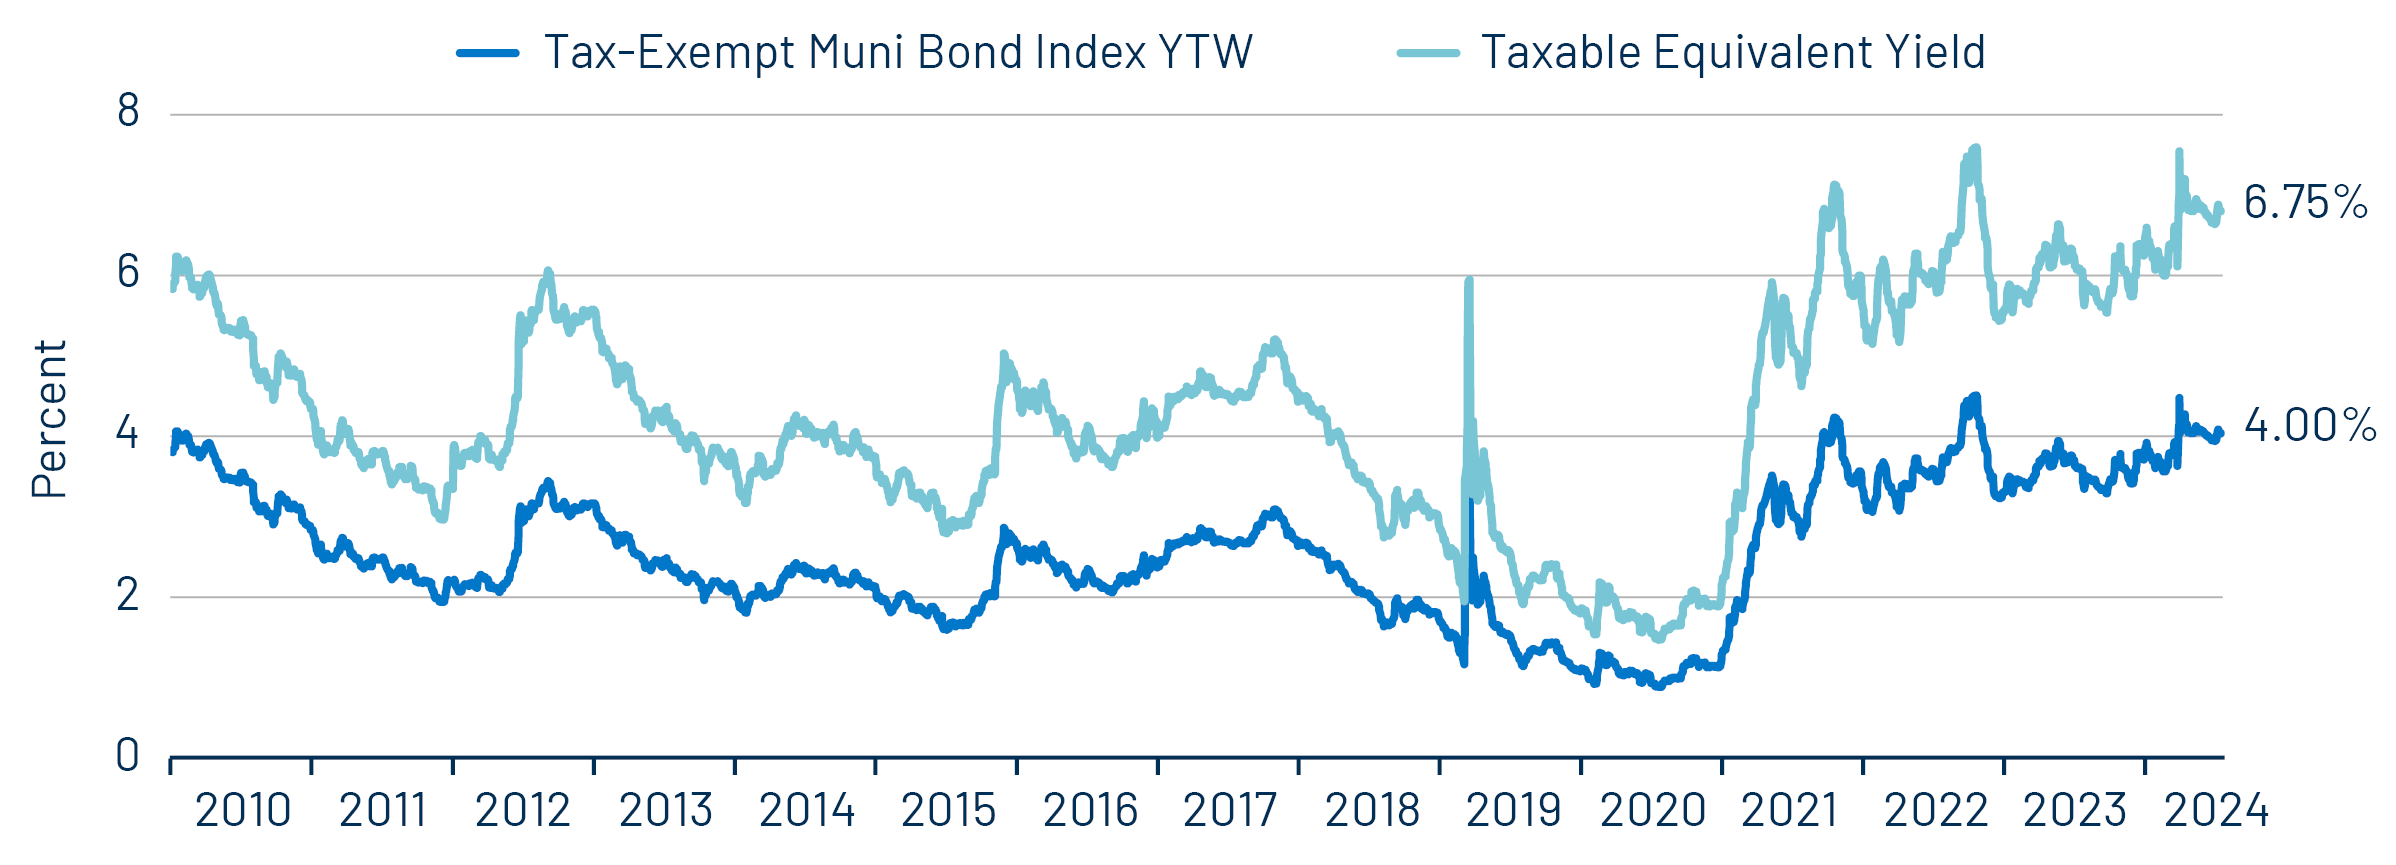
Theme #1: Municipal taxable-equivalent yields and income opportunities remain near decade-high levels.

Exhibit 6: Muni and Taxable-Equivalent Muni Yield-to-Worst
Muni and Taxable-Equivalent Muni Yield-to-Worst
Source: Bloomberg, Western Asset. As of 25 Jul 25. Bloomberg Municipal Bond Index yield considering highest marginal tax rate of 40.8%. Indexes are unmanaged and one cannot directly invest in them. They do not include fees, expenses or sales charges. Past performance is not an indicator or a guarantee of future results. Select the image to expand the view.

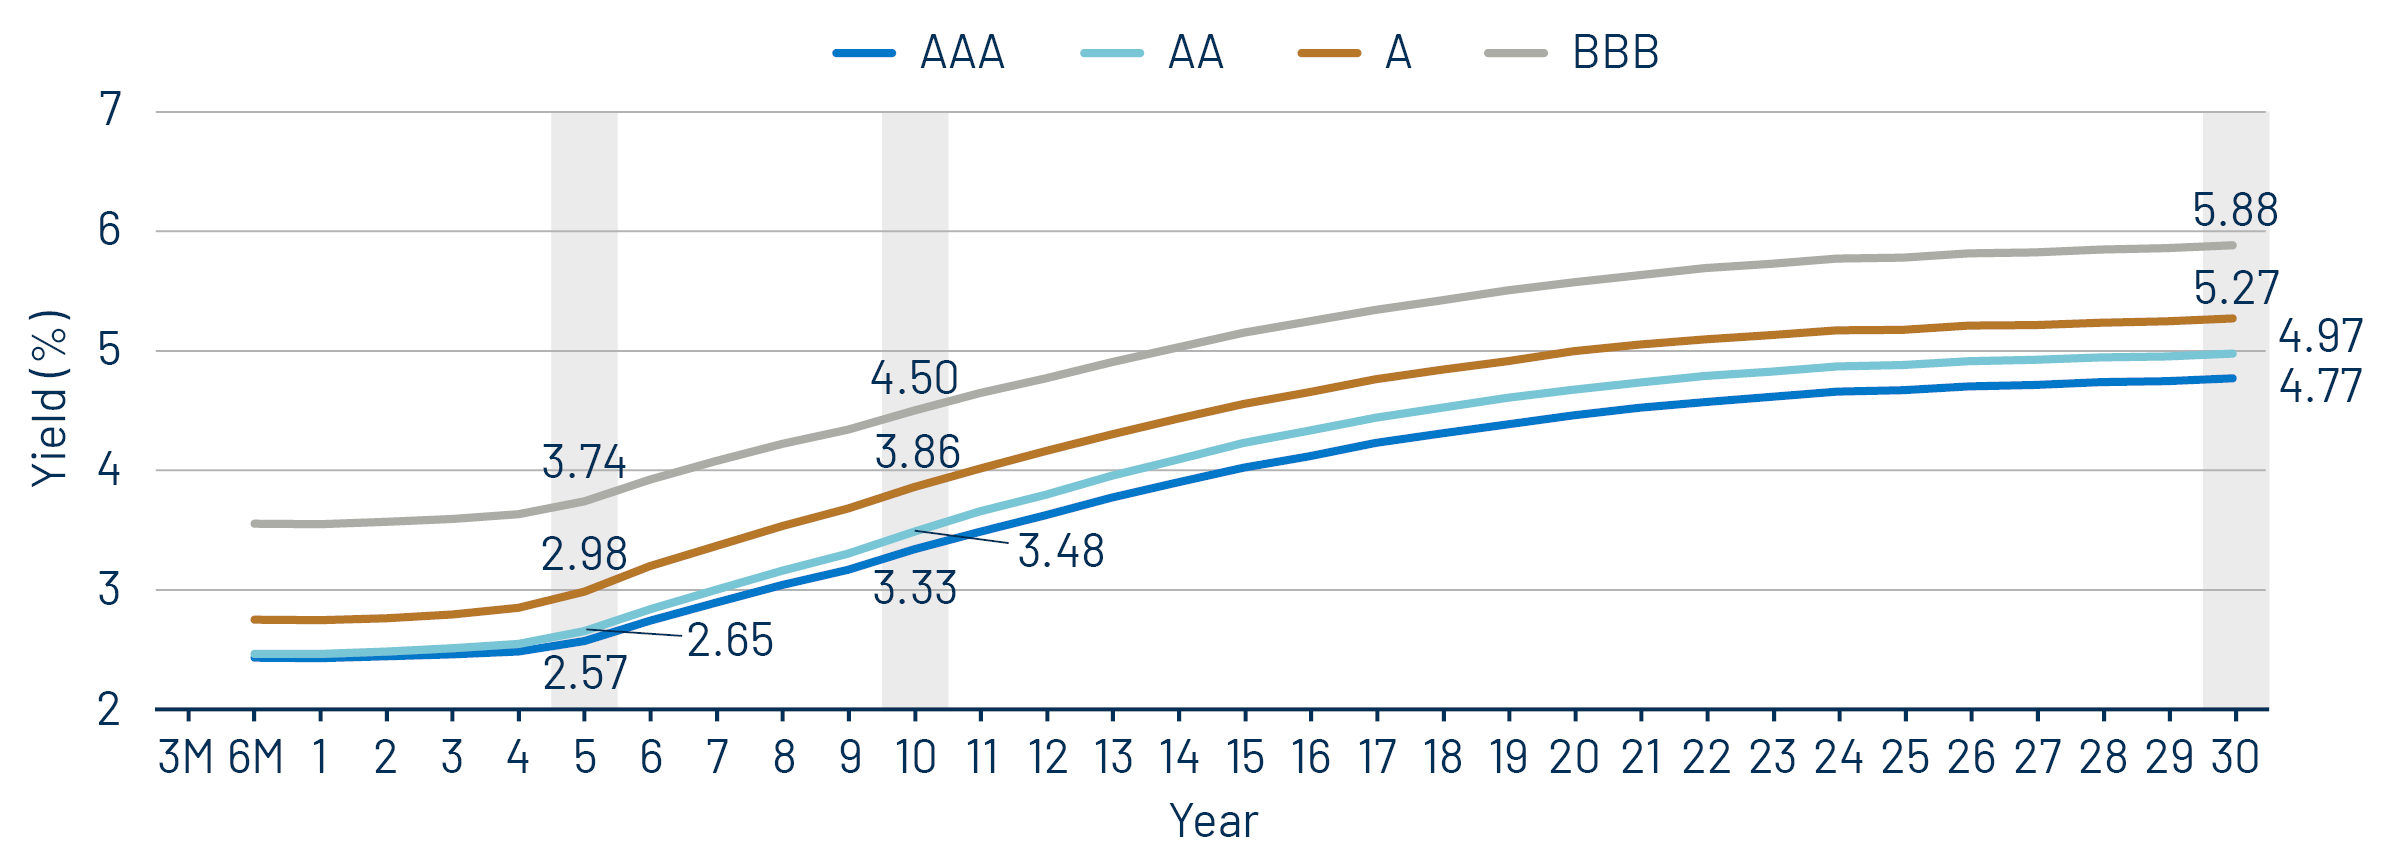
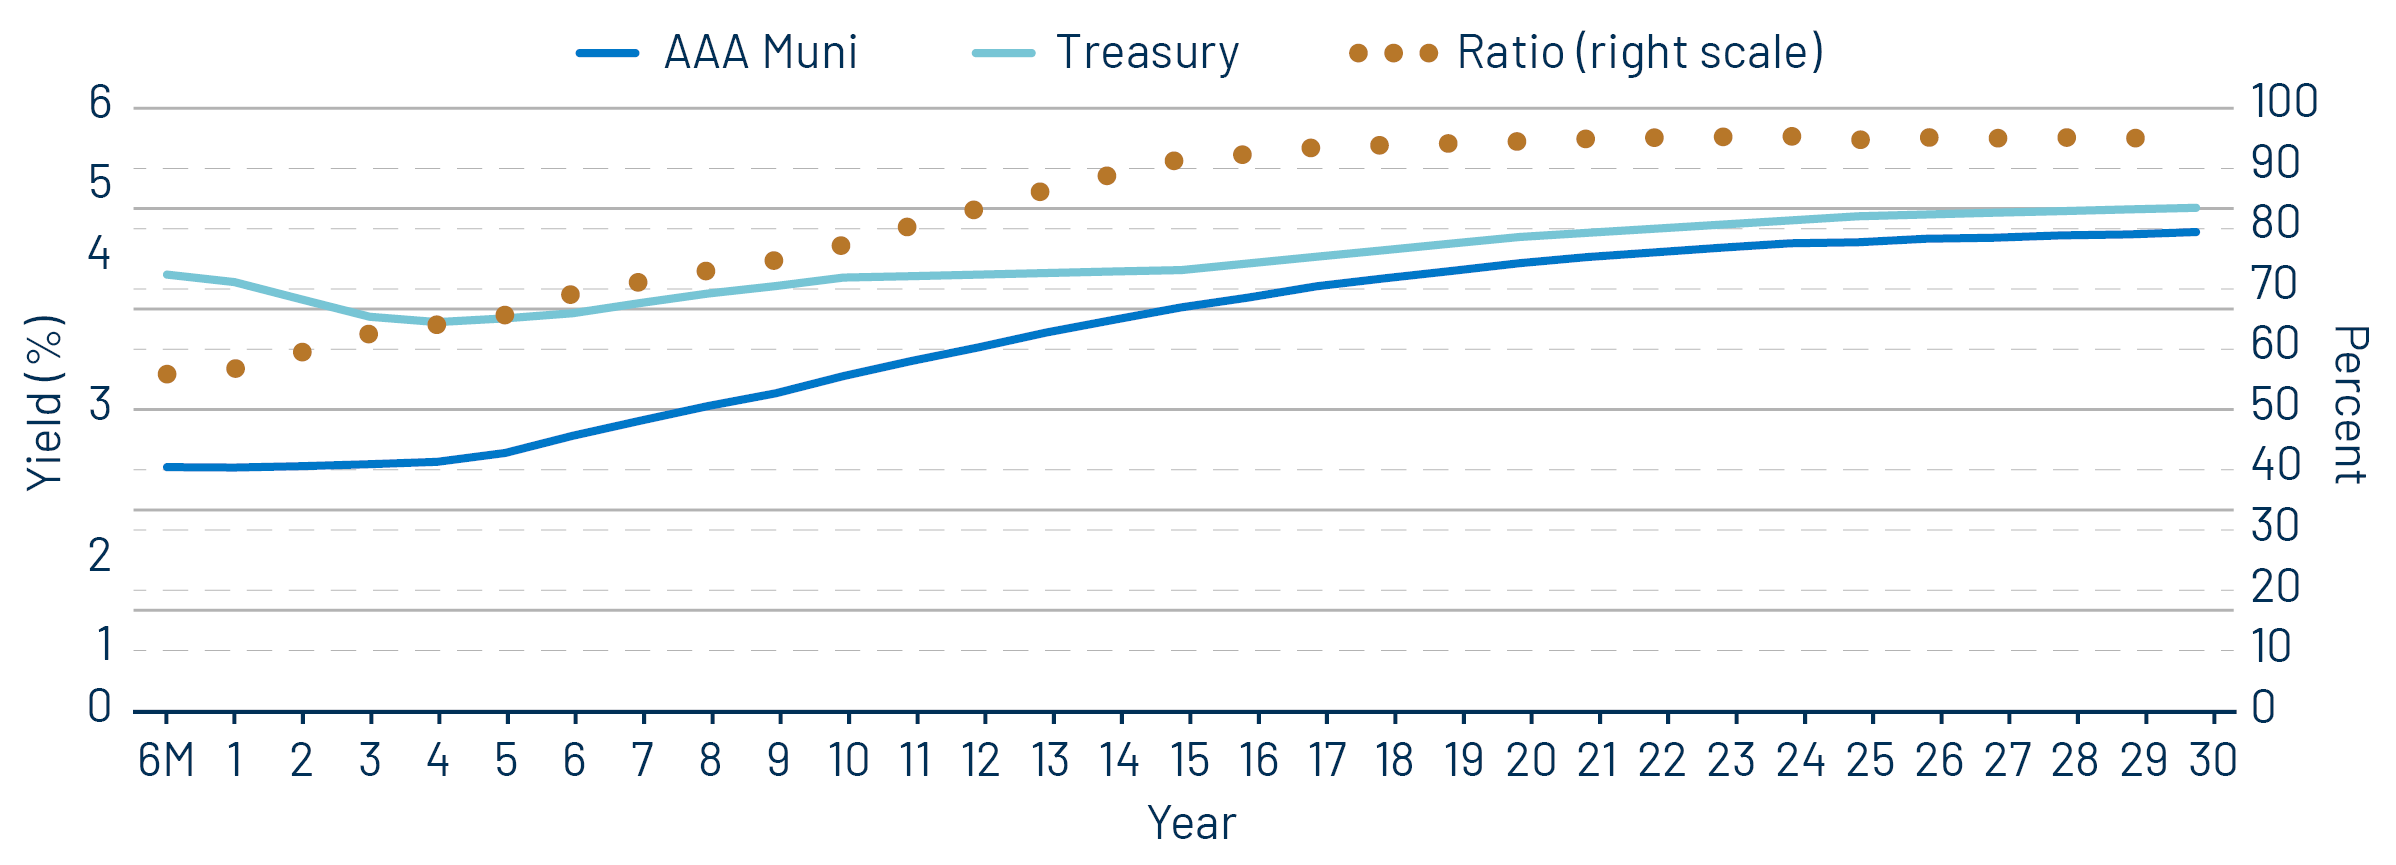
Theme #2: The AAA muni curve has steepened, offering better value in intermediate and longer maturities.

Exhibit 7: AAA Municipal vs. Treasury Yield Curves
AAA Municipal vs. Treasury Yield Curves
Source: Bloomberg, Western Asset. As of 25 Jul 25. Bloomberg Valuation Service (BVAL) AAA Muni Curve and US On-/Off-the-Run Sovereign Curve. Indexes are unmanaged and one cannot directly invest in them. They do not include fees, expenses or sales charges. Past performance is not an indicator or a guarantee of future results. Select the image to expand the view.

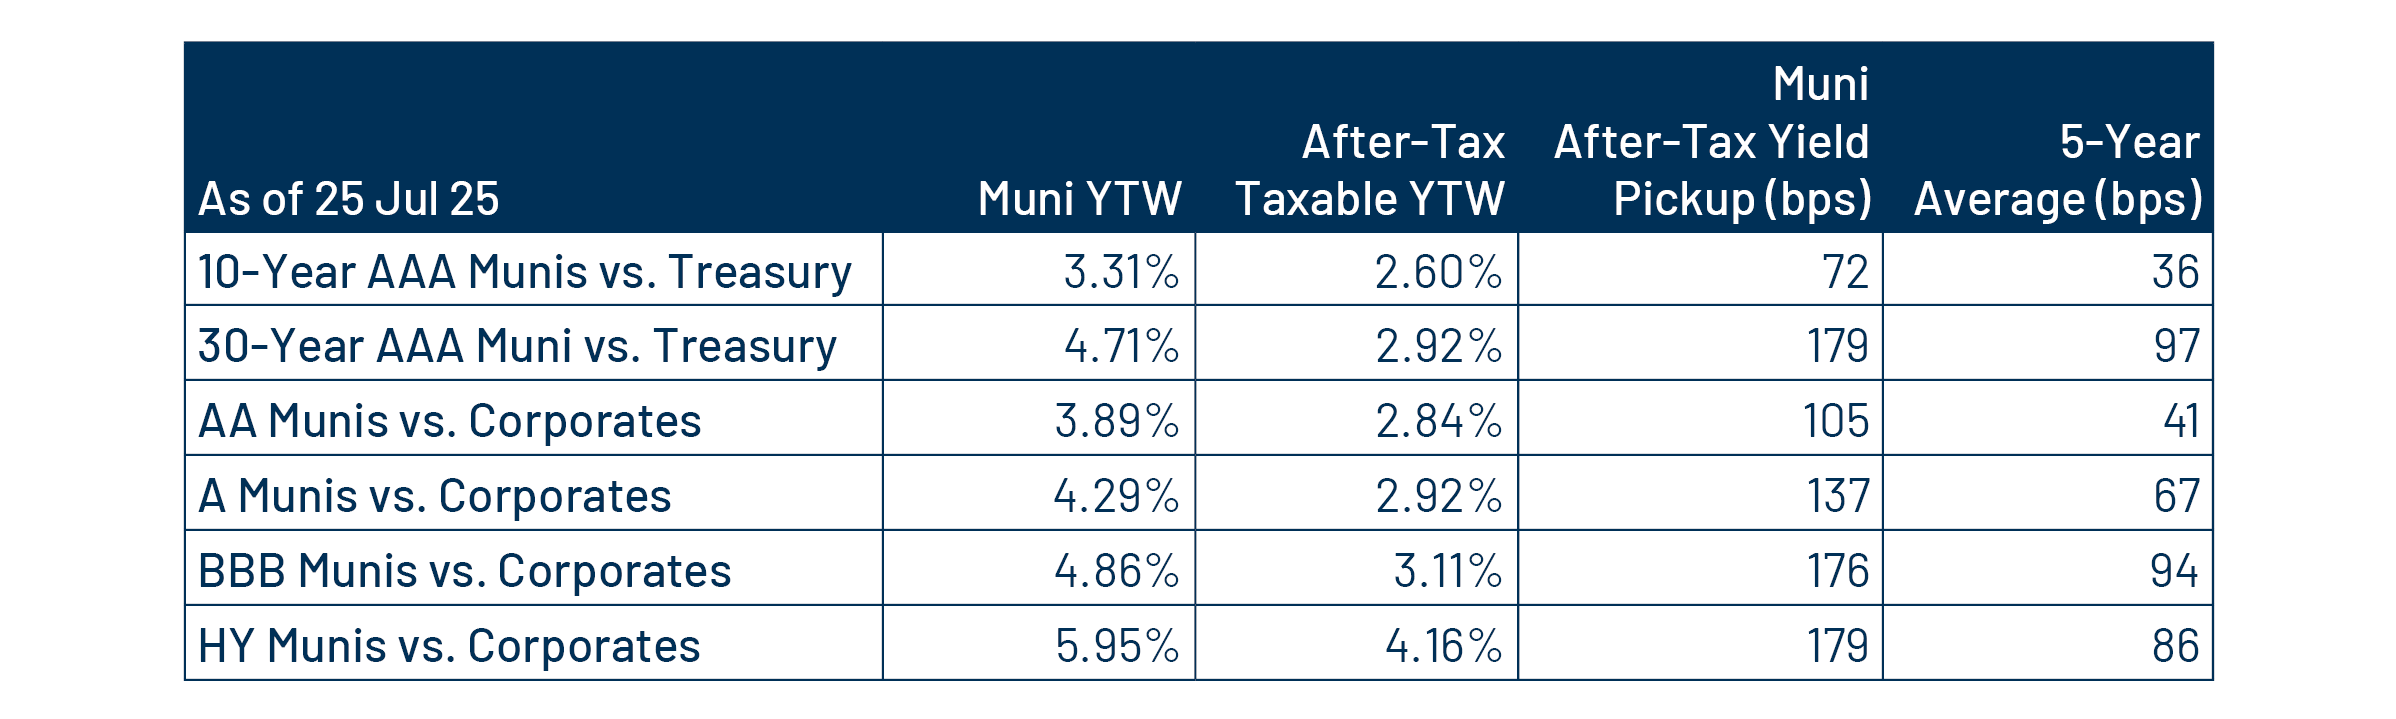
Theme #3: Munis offer attractive after-tax yield compared to taxable alternatives.

Exhibit 8: Municipal vs. Taxable Fixed-Income Yields by Quality
Municipal vs. Taxable Fixed-Income Yields by Quality
Source: Western Asset, Bloomberg. As 25 Jul 25. 10- and 30-Year comparison reflects Bloomberg Valuation Service (BVAL) AAA Muni Curve and US On-/Off-the-Run Sovereign Curve. AA Muni reflects the Bloomberg AA Muni Bond Index. A Muni reflects the Bloomberg A Muni Bond Index. BBB Muni reflects the Bloomberg BBB Muni Bond Index. HY Muni reflects the Bloomberg High Yield Muni Bond Index. AA Corp reflects the Bloomberg AA Corporate Bond Index. A Corp reflects the Bloomberg A Corporate Bond Index. BBB Corp reflects the Bloomberg BBB Corporate Bond Index. After-tax yield considers the top marginal tax rate of 40.8%. Indexes are unmanaged and one cannot directly invest in them. They do not include fees, expenses or sales charges. Past performance is not an indicator or a guarantee of future results. Select the image to expand the view.

© Western Asset Management Company, LLC 2025. The information contained in these materials ("the materials") is intended for the exclusive use of the designated recipient ("the recipient"). This information is proprietary and confidential and may contain commercially sensitive information, and may not be copied, reproduced or republished, in whole or in part, without the prior written consent of Western Asset Management Company ("Western Asset").
Past performance does not predict future returns. These materials should not be deemed to be a prediction or projection of future performance. These materials are intended for investment professionals including professional clients, eligible counterparties, and qualified investors only.
These materials have been produced for illustrative and informational purposes only. These materials contain Western Asset's opinions and beliefs as of the date designated on the materials; these views are subject to change and may not reflect real-time market developments and investment views.
Third party data may be used throughout the materials, and this data is believed to be accurate to the best of Western Asset's knowledge at the time of publication, but cannot be guaranteed. These materials may also contain strategy or product awards or rankings from independent third parties or industry publications which are based on unbiased quantitative and/or qualitative information determined independently by each third party or publication. In some cases, Western Asset may subscribe to these third party's standard industry services or publications. These standard subscriptions and services are available to all asset managers and do not influence rankings or awards in any way.
Investment strategies or products discussed herein may involve a high degree of risk, including the loss of some or all capital. Investments in any products or strategies described in these materials may be volatile, and investors should have the financial ability and willingness to accept such risks.
Unless otherwise noted, investment performance contained in these materials is reflective of a strategy composite. All other strategy data and information included in these materials reflects a representative portfolio which is an account in the composite that Western Asset believes most closely reflects the current portfolio management style of the strategy. Performance is not a consideration in the selection of the representative portfolio. The characteristics of the representative portfolio shown may differ from other accounts in the composite. Information regarding the representative portfolio and the other accounts in the composite are available upon request. Statements in these materials should not be considered investment advice. References, either general or specific, to securities and/or issuers in the materials are for illustrative purposes only and are not intended to be, and should not be interpreted as, recommendation to purchase or sell such securities. Employees and/or clients of Western Asset may have a position in the securities or issuers mentioned.
These materials are not intended to provide, and should not be relied on for, accounting, legal, tax, investment or other advice. The recipient should consult its own counsel, accountant, investment, tax, and any other advisers for this advice, including economic risks and merits, related to making an investment with Western Asset. The recipient is responsible for observing the applicable laws and regulations of their country of residence.
Founded in 1971, Western Asset Management Company is a global fixed-income investment manager with offices in Pasadena, New York, London, Singapore, Tokyo, Melbourne, São Paulo, Hong Kong, and Zürich. Western Asset is a wholly owned subsidiary of Franklin Resources, Inc. but operates autonomously. Western Asset is comprised of six legal entities across the globe, each with distinct regional registrations: Western Asset Management Company, LLC, a registered Investment Adviser with the Securities and Exchange Commission; Western Asset Management Company Ltda. is regulated by Comissão de Valores Mobiliários; Western Asset Management Company Pty Ltd ABN 41 117 767 923 is the holder of the Australian Financial Services License 303160; Western Asset Management Company Pte. Ltd. Co. Reg. No. 200007692R is a holder of a Capital Markets Services License for fund management and regulated by the Monetary Authority of Singapore; Western Asset Management Company Ltd, a registered Financial Instruments Business Operator and regulated by the Financial Services Agency of Japan; and Western Asset Management Company Limited is authorised and regulated by the Financial Conduct Authority ("FCA") (FRN 145930). This communication is intended for distribution to Professional Clients only if deemed to be a financial promotion in the UK as defined by the FCA. This communication may also be intended for certain EEA countries where Western Asset has been granted permission to do so. For the current list of the approved EEA countries please contact Western Asset at +44 (0)20 7422 3000.