skip navigation
Blog

Stay up to date on timely topics and market events. Subscribe to our Blog now.

MARKETS
August 12, 2025

Weekly Municipal Monitor—Spread Tightening Amid Negative Headlines

By Michael Linko, Sam Weitzman

Stay up to date on timely topics and market events. Subscribe to our Blog now.

Macros, Markets and Munis

Investment-grade munis posted positive returns and outperformed Treasuries last week. Amid a quiet week of economic data, strong equity market performance and improving sentiment, Treasury yields moved higher across the curve. High-grade municipal yields fell across the curve, outperforming Treasuries as demand improved during the week. Meanwhile, strong fund flows contributed to positive market sentiment, despite near-record supply. This week we touch on muni spread tightening amid headlines about the ability of select high-yield muni borrowers to sustain debt service.

Muni Funds Post Inflows Amid Near Record Supply Conditions

Fund Flows (up $1.7 billion): During the week ending August 6, weekly reporting municipal mutual funds recorded $1.7 billion of net inflows, according to Lipper. Intermediate funds recorded $365 million, short and short/intermediate funds recorded $716 million, long-term funds recorded $574 million and high-yield funds recorded $224 million of net inflows. Last week’s inflows led year-to-date (YTD) inflows higher to $21 billion.

Supply (YTD supply of $360 billion; up 24% YoY): The muni market recorded $22 billion of new-issue supply last week, a near record level and the largest weekly level of issuance this year. YTD new-issue supply of $360 billion is 24% higher than the prior year, with tax-exempt issuance up 25% year-over-year (YoY) and taxable issuance up 6%, respectively. This week’s calendar is expected to remain elevated at $11 billion. The largest deals include $1.1 billion Port Authority of NY/NJ and $450 million Miami-Dade School District transactions.

This Week in Munis: Spread Tightening and High-Yield Headlines Underscore Selection

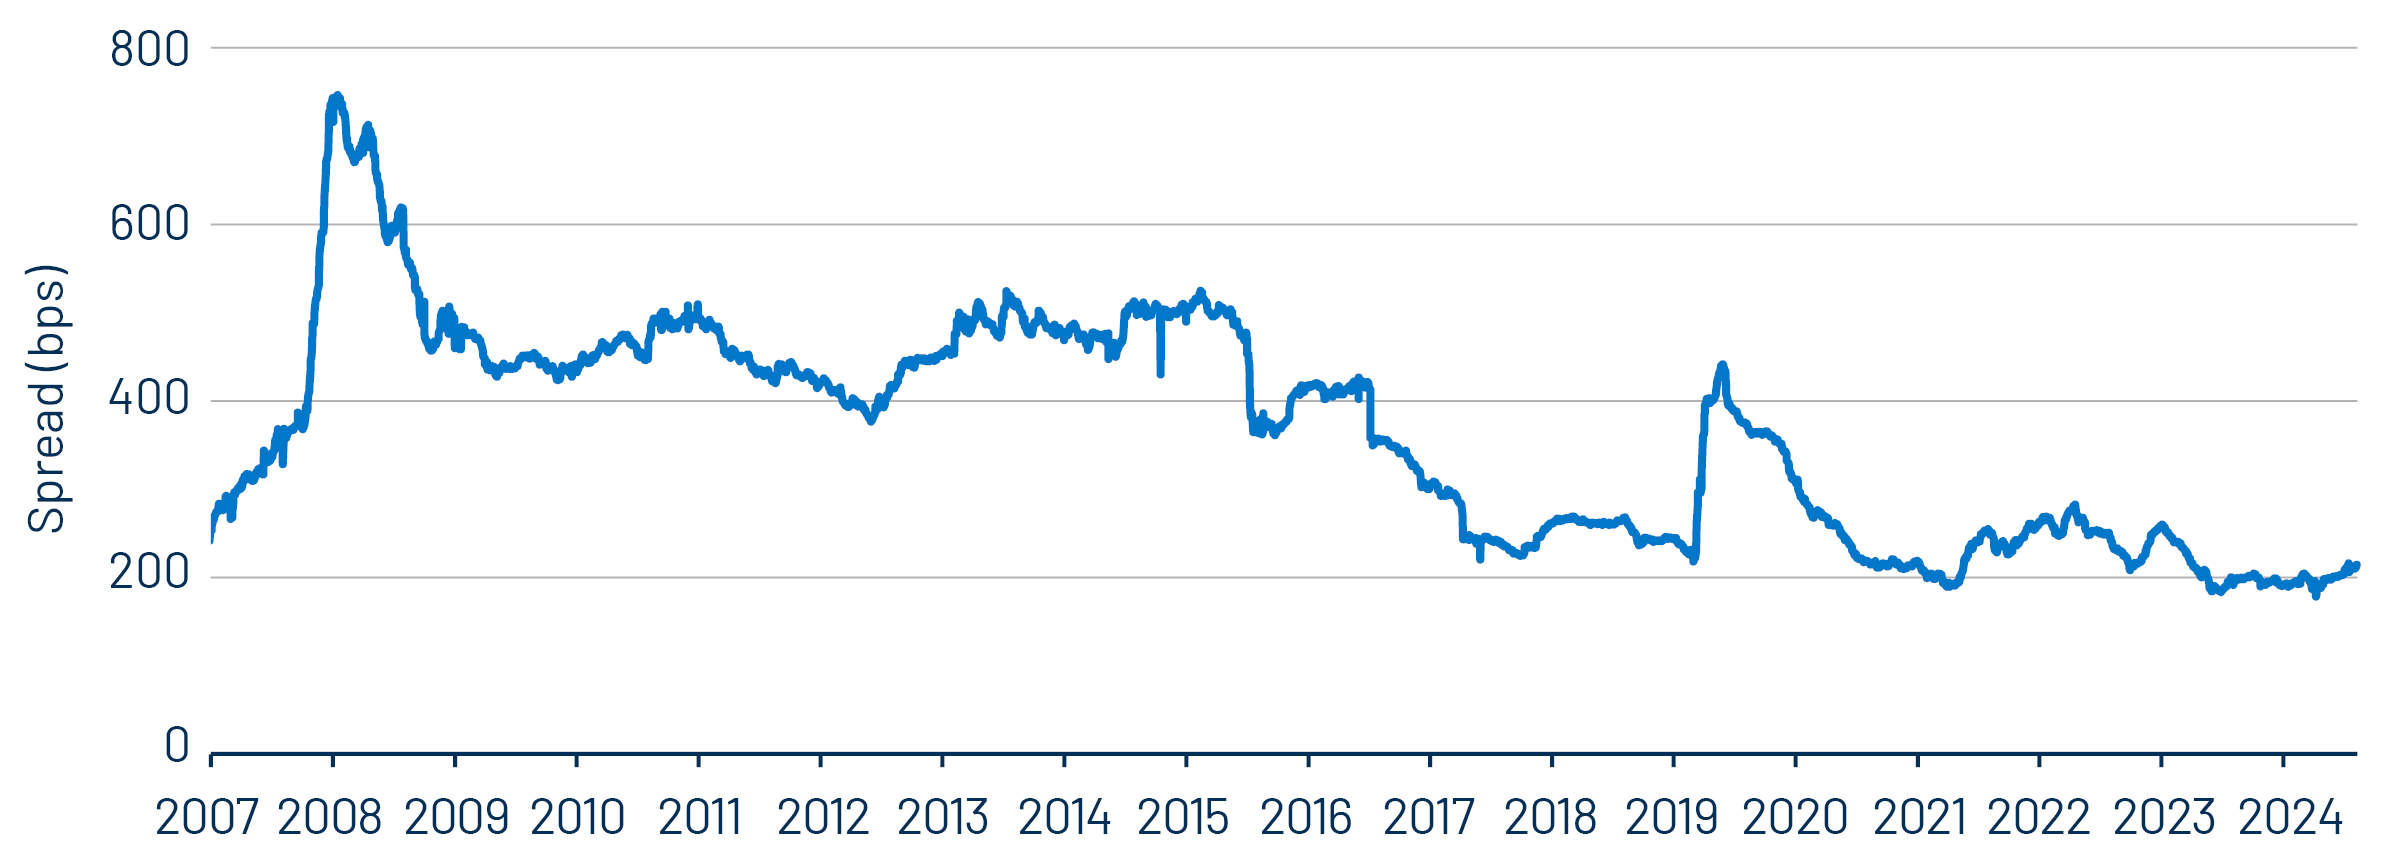
Fixed-income markets have experienced credit spread tightening this year, and the municipal market has followed suit. The yield differential between the Bloomberg High Yield Municipal Bond Index and the Bloomberg AAA Municipal Bond Index has narrowed significantly over the past decade, dropping from 502 basis points (bps) in December 2015 to a low of 178 bps in April 2025 and averaging 204 bps this year. This tightening reflects resilient US credit fundamentals and strong investor demand, supported by $4 billion in net inflows into high-yield municipal funds during the first half of 2025 (22% of total municipal fund inflows) following a robust $14 billion in net inflows (31% of inflows) in 2024.

Exhibit 1: High-Yield Muni Spreads Remain Near Decade Lows (Bloomberg High-Yield Muni Index YTW vs. Bloomberg AAA Muni Index YTW)
High-Yield Muni Spreads Remain Near Decade Lows  (Bloomberg High-Yield Muni Index YTW vs. Bloomberg AAA Muni Index YTW)
Source: Bloomberg. As of 08 Aug 25. Yield-to-worst (YTW) is the lowest potential yield that can be received on a bond without the issuer actually defaulting. Select the image to expand the view.

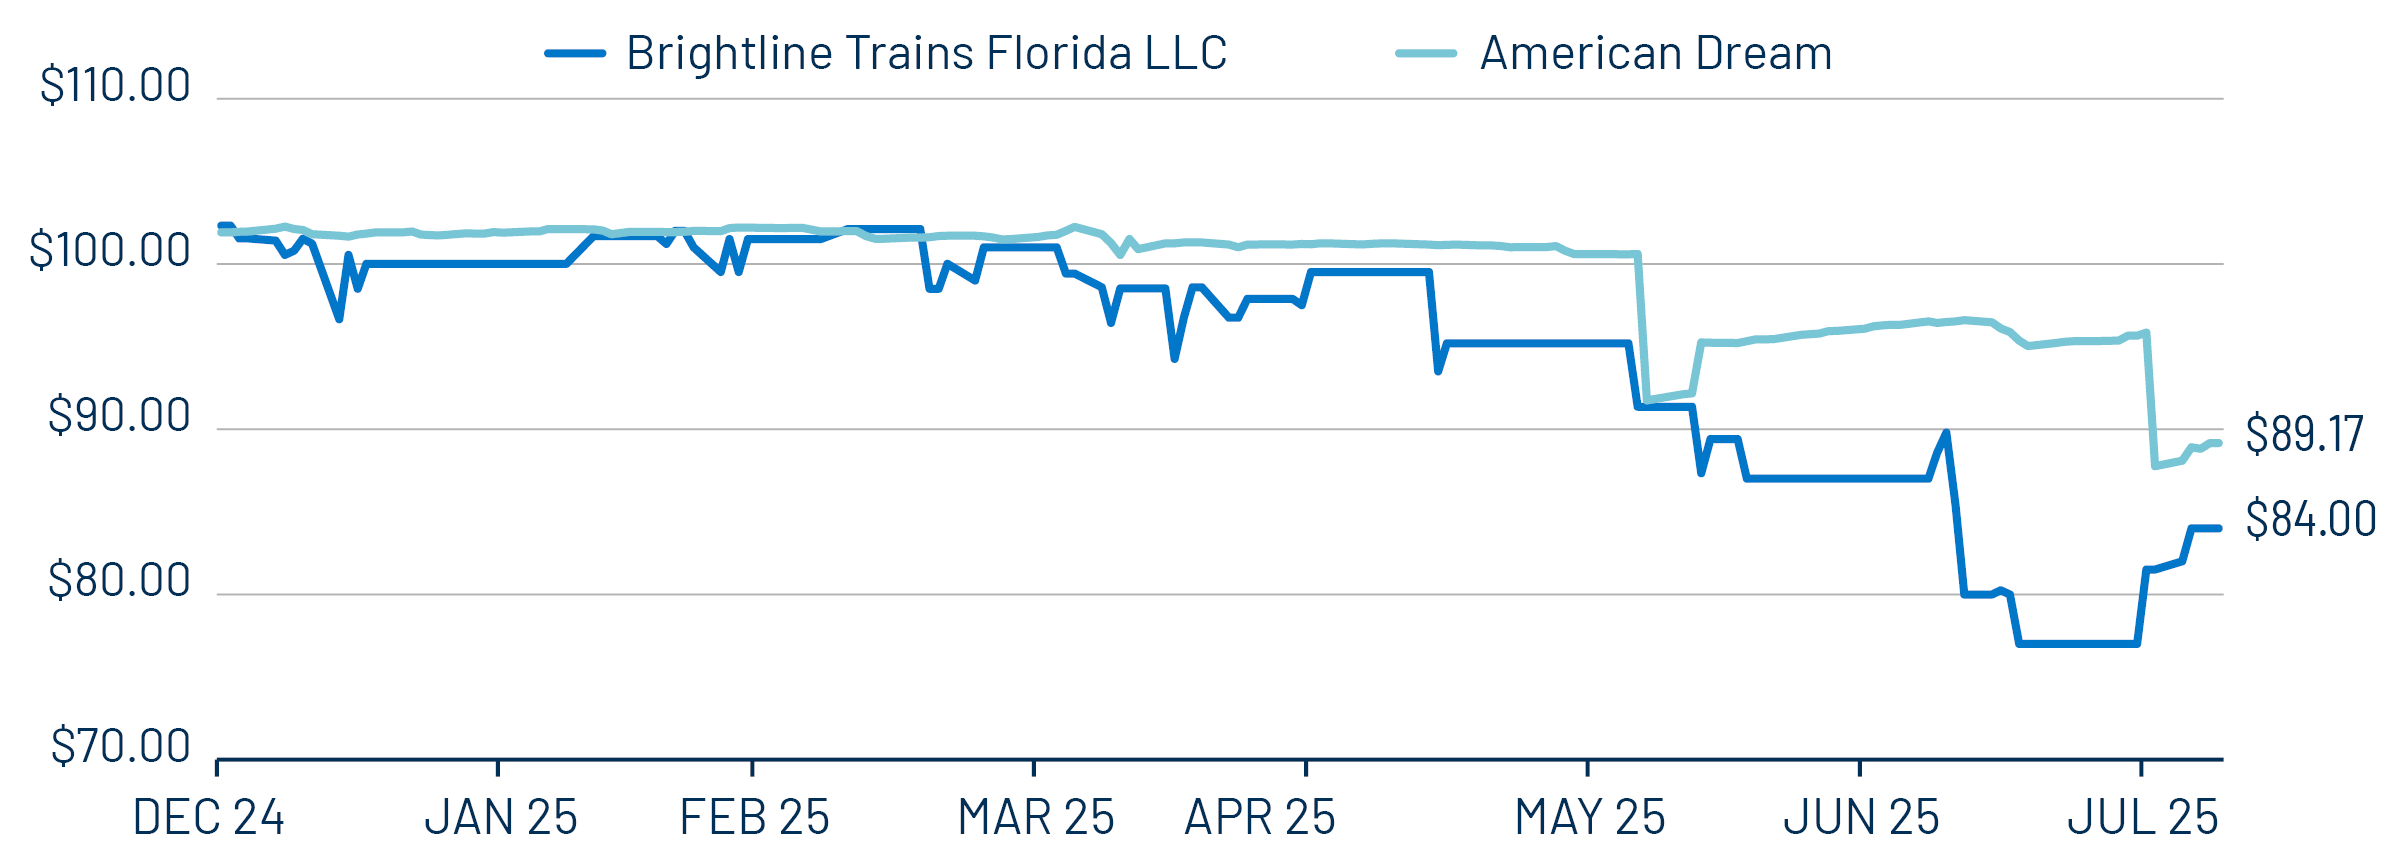
High-yield muni fund flow strength has persisted despite increasing credit headlines in the high-yield muni market. Two of the top 20 issuers in the High Yield Municipal Index, Brightline Trains (Florida) and American Dream Mall (New Jersey), have been in the headlines this year over concerns around the ability to sustain debt service. Brightline’s senior operating lien bonds, initially issued in 2024 with a BBB- rating by Fitch, were downgraded to B by the agency on July 30 as Brightline’s lower-than-anticipated ridership and fares contributed to revenue concerns. S&P followed suit with a two-notch downgrade to BB- last week. Meanwhile American Dream’s tax-backed bonds, initially backed by an assessed value of $3.3 billion, have had its assessment cut to $1.65 billion and affirmed by a judge on July 31.

These concerns have contributed to significant price drawdowns for securities issued by these obligors this year. According to Bloomberg, a representative Brightline security (5.5%, 2053) has dropped 17.5% YTD to $84.00, while a representative American Dream (7.0%, 2050) security has fallen 12.5% to $89.17, each significantly underperforming the Bloomberg High Yield Municipal Index return of -1.41% YTD. The volatility and relative illiquidity of these issuers, which account for 0.5%-1.5% of the index but can represent a larger share of certain municipal portfolios, highlight the need for thorough credit research when navigating the high-yield municipal market, particularly at these tighter spread levels where investors could be less compensated for such risk.

Exhibit 2: American Dream vs. Brightline Security
American Dream vs. Brightline Security
Source: Bloomberg, Western Asset. As of 07 Aug 25. Brightline representative security: CUSIP 340618DT1, Coupon: 5.5% Maturity: July 1, 2053; American Dream representative Security: CUSIP: 74446HAD1, Coupon: 7.0%, Maturity: December 1, 2050. Select the image to expand the view.

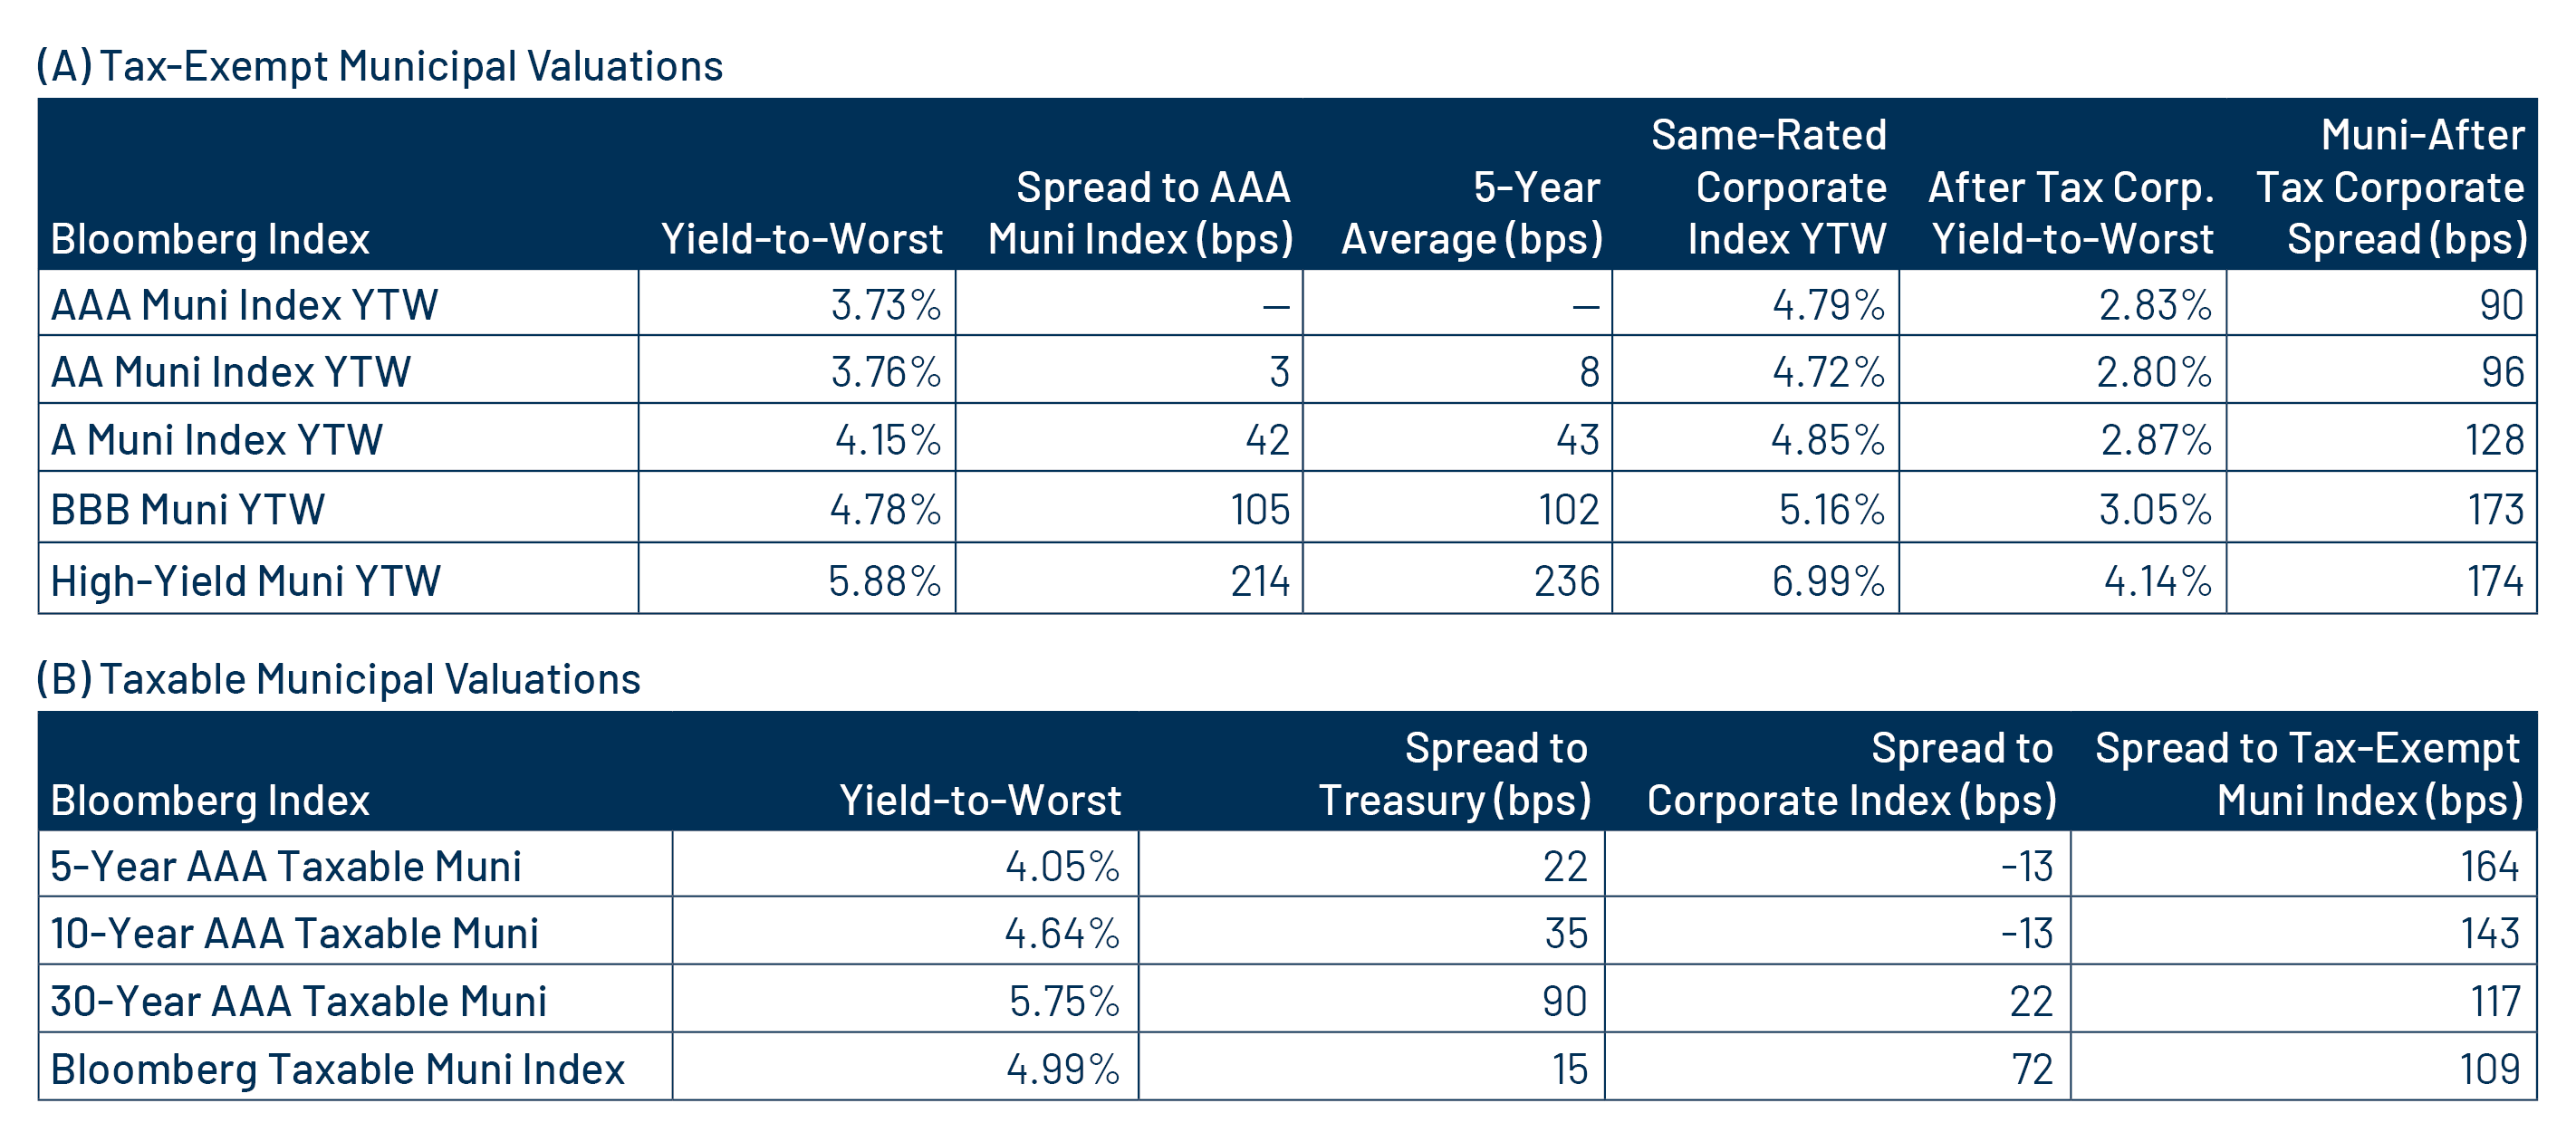
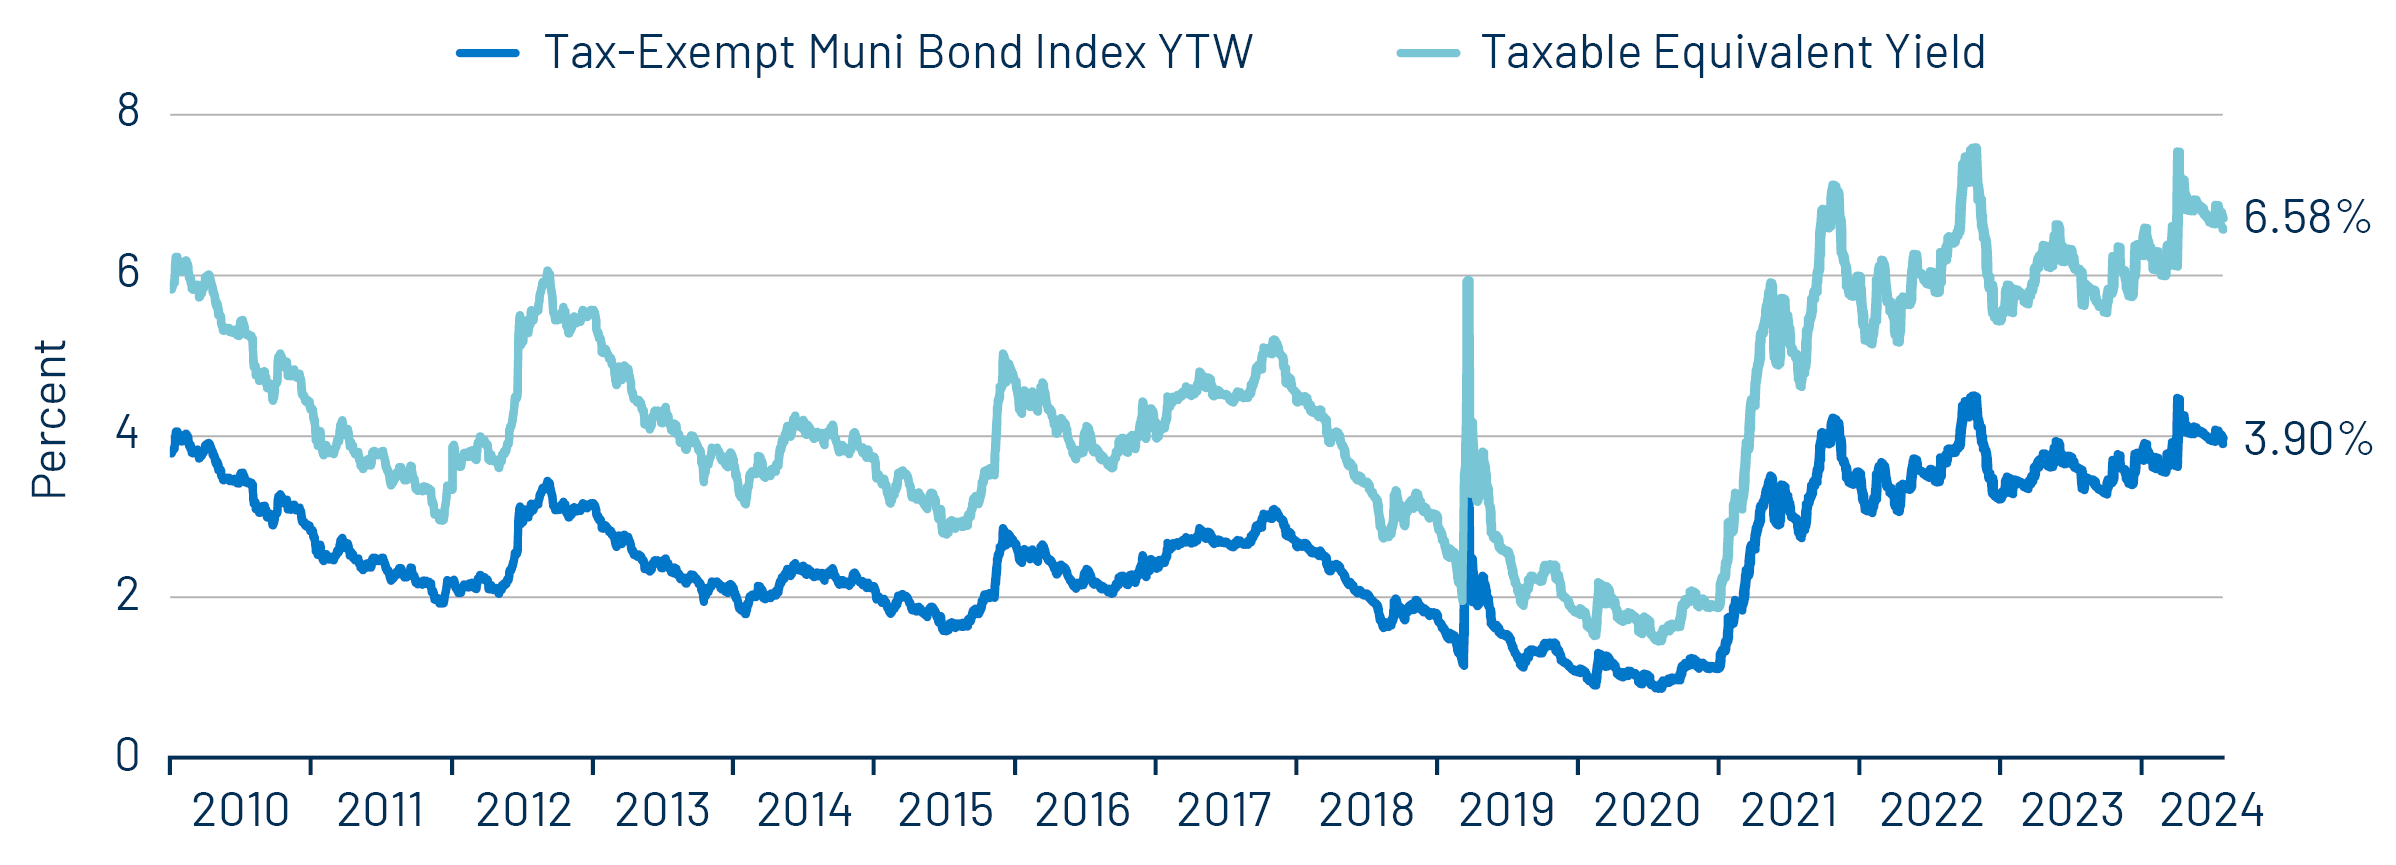
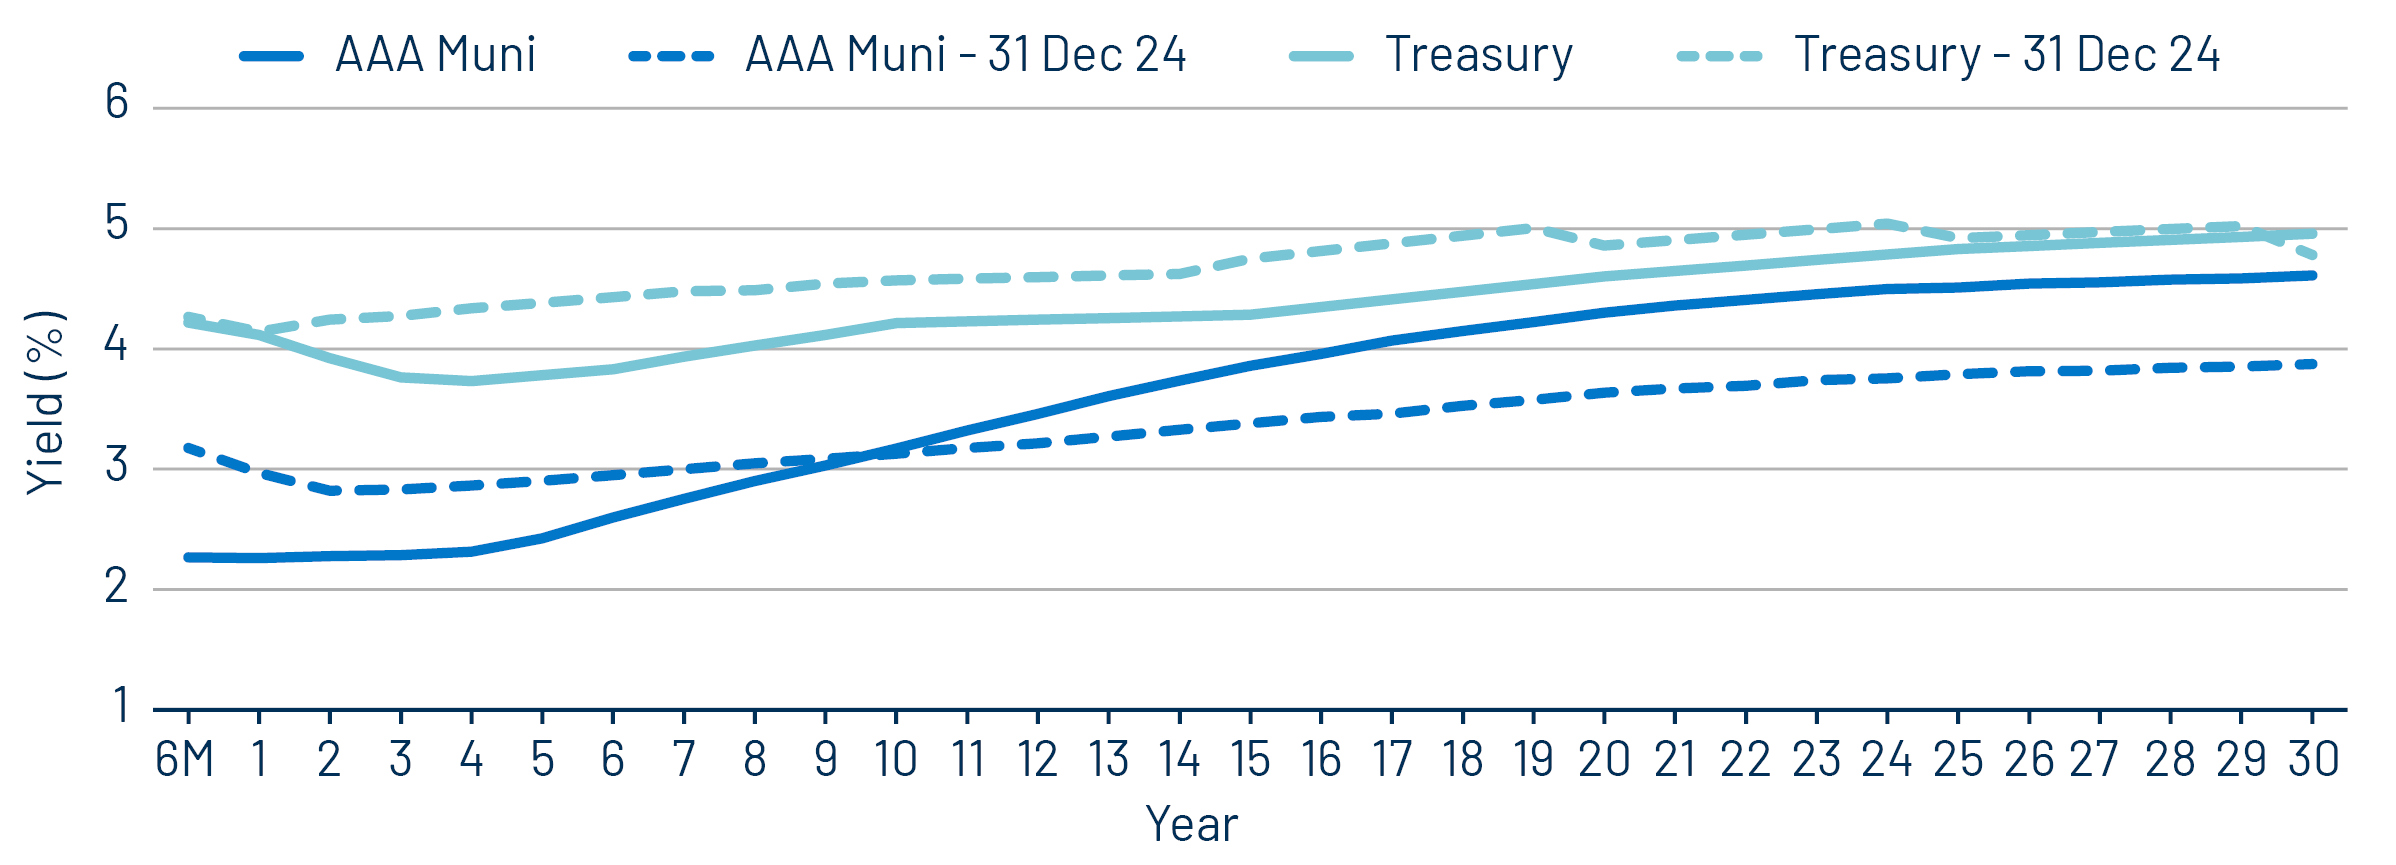
Municipal Credit Curves and Relative Value

Exhibit 3: Muni Credit Curves
Muni Credit Curves
Source: Bloomberg, Western Asset. As of 08 Aug 25. Bloomberg Valuation Service (BVAL) Municipal Credit Indices (AAA, AA, A, BBB, respectively) and US Sovereign Curves. Taxable-Equivalent Muni Credit Curves consider the top marginal effective tax rate of 40.8%. AA Muni is represented by the US General Obligation AA Muni BVAL Yield Curve. The BVAL curve is populated with pricing from uninsured AA General Obligation bonds. A Muni is represented by the US General Obligation A Muni BVAL Yield Curve. The BVAL curve is populated with pricing from uninsured A General Obligation bonds. BBB Muni is represented by the US General Obligation BBB Muni BVAL Yield Curve. The BVAL curve is populated with pricing from uninsured BBB General Obligation bonds. Indices are unmanaged and one cannot directly invest in them. They do not include fees, expenses or sales charges. Past performance is not an indicator or a guarantee of future results. Select the image to expand the view.
Exhibit 4: Taxable-Equivalent Muni Credit Curves
Taxable-Equivalent Muni Credit Curves
Source: Bloomberg, Western Asset. As of 08 Aug 25. Bloomberg Valuation Service (BVAL) Municipal Credit Indices (AAA, AA, A, BBB, respectively) and US Sovereign Curves. Taxable-Equivalent Muni Credit Curves consider the top marginal effective tax rate of 40.8%. AA Muni is represented by the US General Obligation AA Muni BVAL Yield Curve. The BVAL curve is populated with pricing from uninsured AA General Obligation bonds. A Muni is represented by the US General Obligation A Muni BVAL Yield Curve. The BVAL curve is populated with pricing from uninsured A General Obligation bonds. BBB Muni is represented by the US General Obligation BBB Muni BVAL Yield Curve. The BVAL curve is populated with pricing from uninsured BBB General Obligation bonds. Indices are unmanaged and one cannot directly invest in them. They do not include fees, expenses or sales charges. Past performance is not an indicator or a guarantee of future results. Select the image to expand the view.
Exhibit 5: AAA Munis vs. Treasuries
AAA Munis vs. Treasuries
Source: Muni Yields: Thomson Reuters MMD, Treasury Yields: Bloomberg. As of 08 Aug 25. Past performance is not a guarantee of future results. It is not possible to invest directly in an index. Select the image to expand the view.
Exhibit 6: Tax-Exempt and Taxable Muni Valuations
Tax-Exempt and Taxable Muni Valuations
Source: Bloomberg, Western Asset. As of 08 Aug 25. Yield-to-worst (YTW) is the lowest potential yield that can be received on a bond without the issuer actually defaulting. AAA, AA, A, BBB Corporate Indices; After-Tax Yield assumes a top effective tax rate of 40.8%. Taxable Muni Index Corporate comparable used is the Global Corporate Aggregate (ex. BBB) to better align credit quality and duration. Select the image to expand the view.

Western Asset Key Themes for Muni Investors

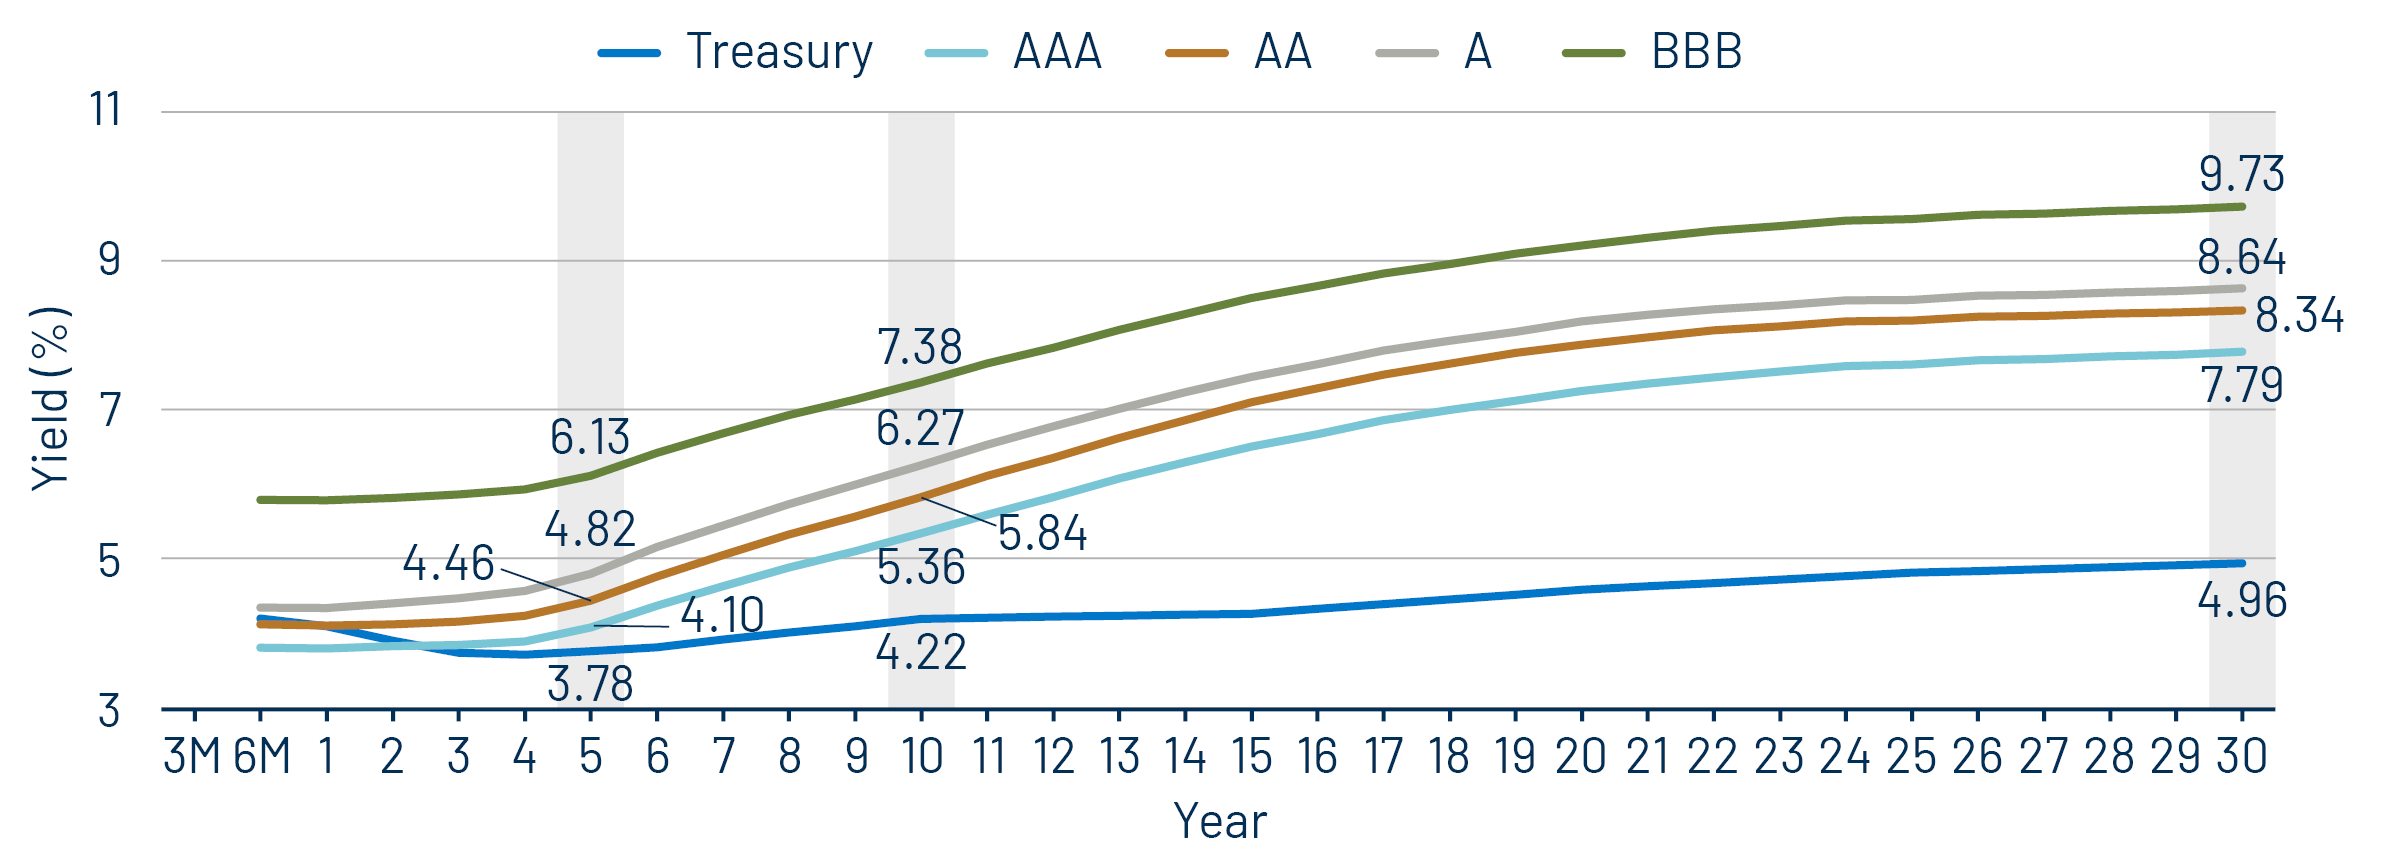
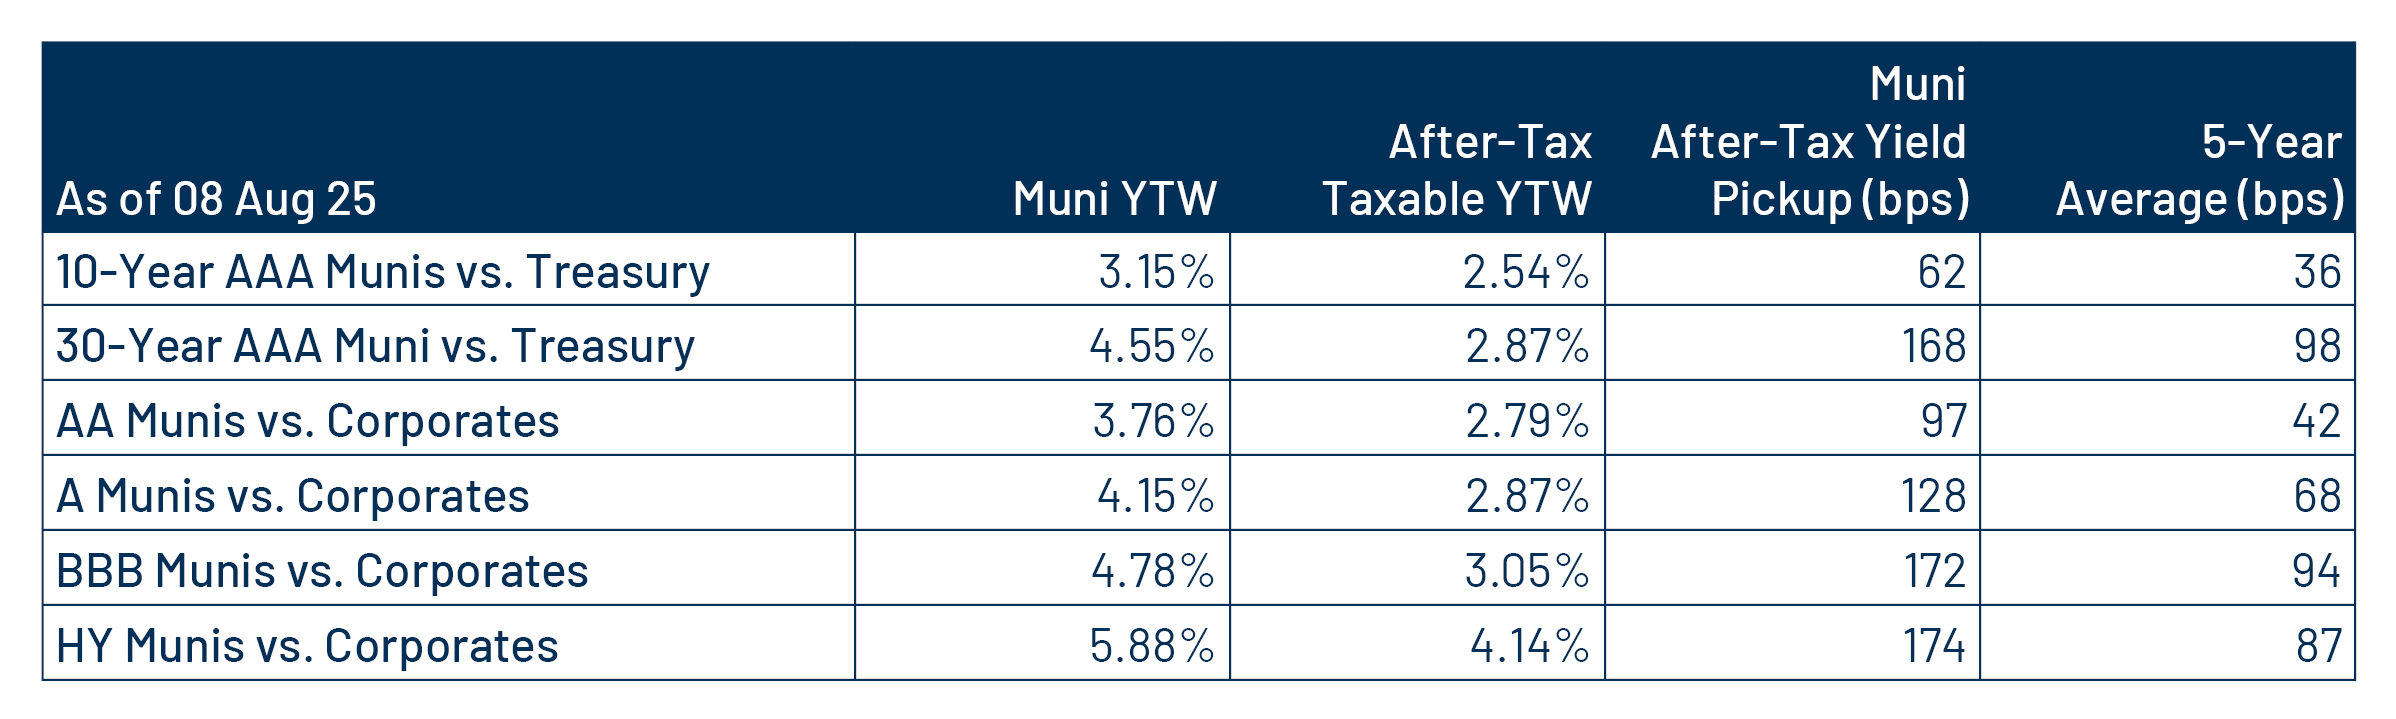
Theme #1: Municipal taxable-equivalent yields and income opportunities remain near decade-high levels.

Exhibit 7: Muni and Taxable-Equivalent Muni Yield-to-Worst
Muni and Taxable-Equivalent Muni Yield-to-Worst
Source: Bloomberg, Western Asset. As of 08 Aug 25. Bloomberg Municipal Bond Index yield considering highest marginal tax rate of 40.8%. Indexes are unmanaged and one cannot directly invest in them. They do not include fees, expenses or sales charges. Past performance is not an indicator or a guarantee of future results. Select the image to expand the view.

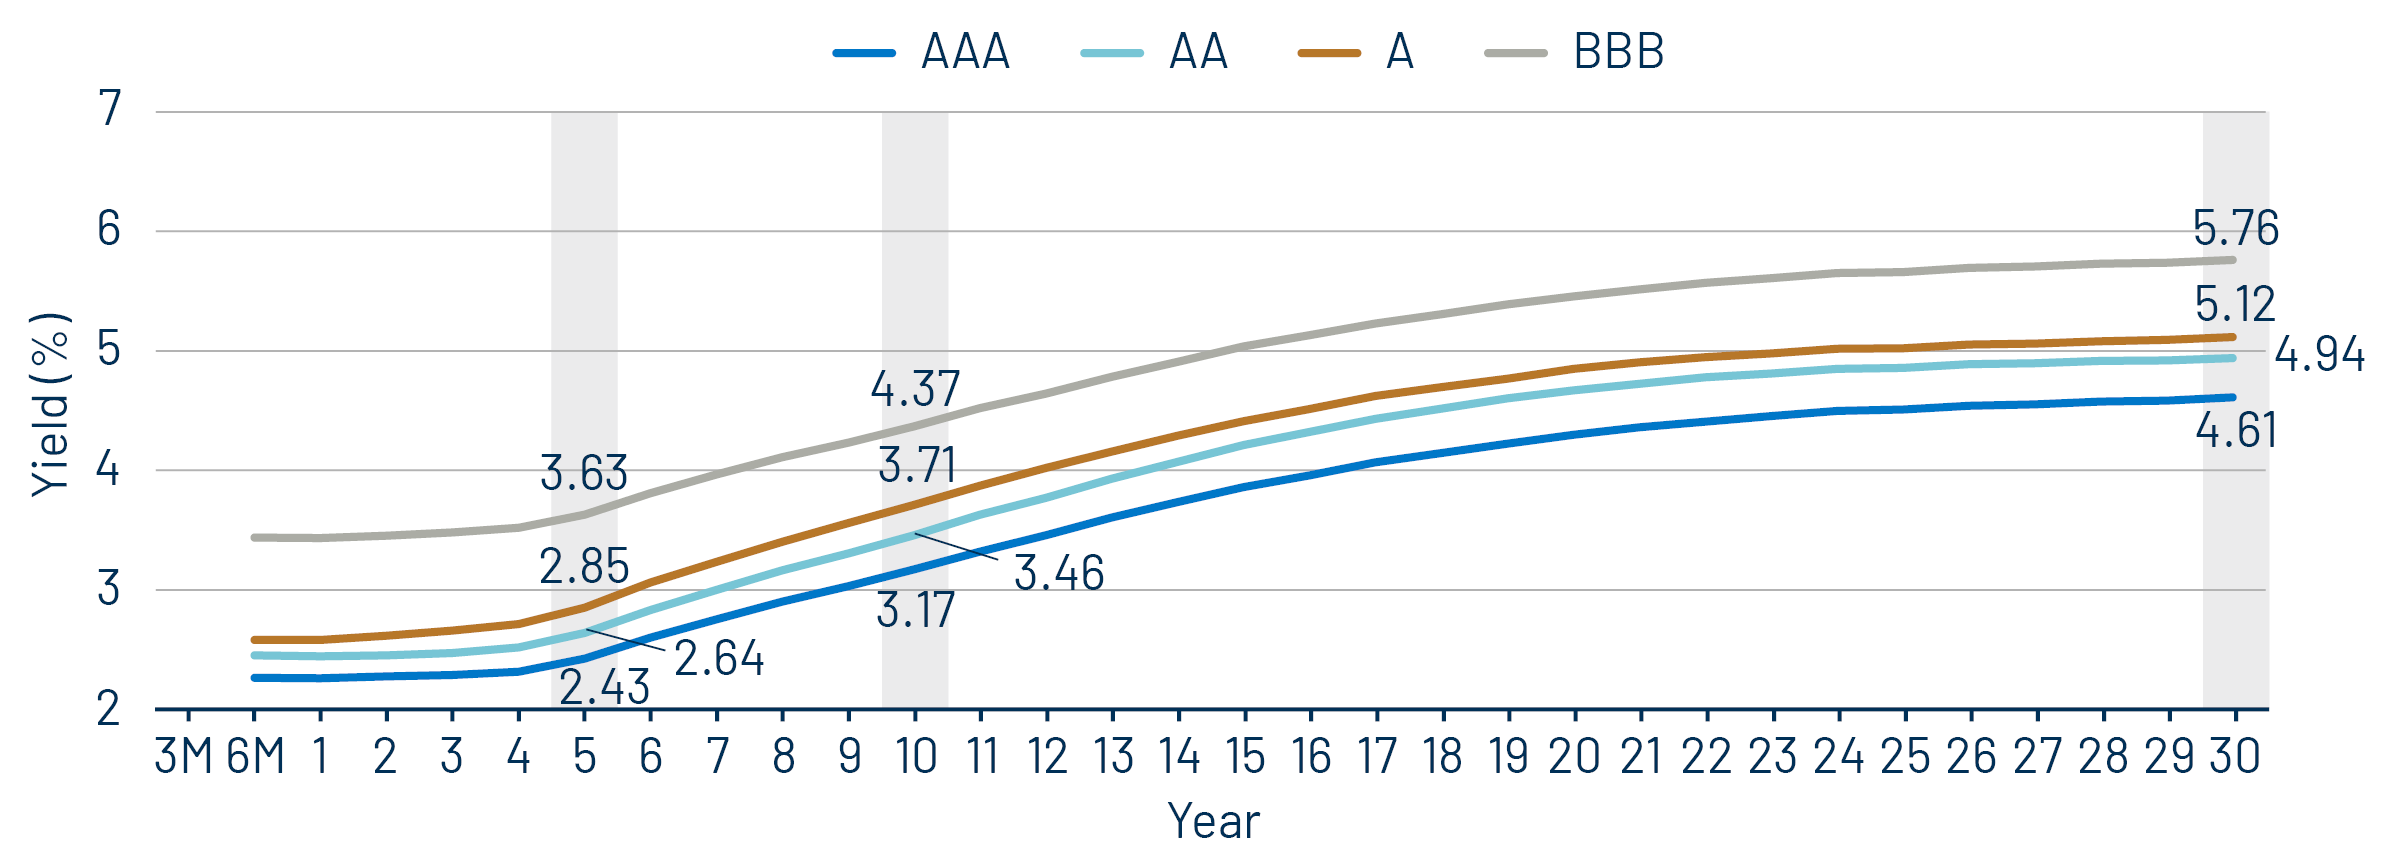
Theme #2: The AAA muni curve has steepened, offering better value in intermediate and longer maturities.

Exhibit 8: AAA Municipal vs. Treasury Yield Curves
AAA Municipal vs. Treasury Yield Curves
Source: Bloomberg, Western Asset. As of 08 Aug 25. Bloomberg Valuation Service (BVAL) AAA Muni Curve and US On-/Off-the-Run Sovereign Curve. Indexes are unmanaged and one cannot directly invest in them. They do not include fees, expenses or sales charges. Past performance is not an indicator or a guarantee of future results. Select the image to expand the view.

Theme #3: Munis offer attractive after-tax yield compared to taxable alternatives.

Exhibit 9: Municipal vs. Taxable Fixed-Income Yields by Quality
Municipal vs. Taxable Fixed-Income Yields by Quality
Source: Western Asset, Bloomberg. As of 08 Aug 25. 10- and 30-Year comparison reflects Bloomberg Valuation Service (BVAL) AAA Muni Curve and US On-/Off-the-Run Sovereign Curve. AA Muni reflects the Bloomberg AA Muni Bond Index. A Muni reflects the Bloomberg A Muni Bond Index. BBB Muni reflects the Bloomberg BBB Muni Bond Index. HY Muni reflects the Bloomberg High Yield Muni Bond Index. AA Corp reflects the Bloomberg AA Corporate Bond Index. A Corp reflects the Bloomberg A Corporate Bond Index. BBB Corp reflects the Bloomberg BBB Corporate Bond Index. After-tax yield considers the top marginal tax rate of 40.8%. Indexes are unmanaged and one cannot directly invest in them. They do not include fees, expenses or sales charges. Past performance is not an indicator or a guarantee of future results. Select the image to expand the view.

© Western Asset Management Company, LLC 2025. The information contained in these materials ("the materials") is intended for the exclusive use of the designated recipient ("the recipient"). This information is proprietary and confidential and may contain commercially sensitive information, and may not be copied, reproduced or republished, in whole or in part, without the prior written consent of Western Asset Management Company ("Western Asset").
Past performance does not predict future returns. These materials should not be deemed to be a prediction or projection of future performance. These materials are intended for investment professionals including professional clients, eligible counterparties, and qualified investors only.
These materials have been produced for illustrative and informational purposes only. These materials contain Western Asset's opinions and beliefs as of the date designated on the materials; these views are subject to change and may not reflect real-time market developments and investment views.
Third party data may be used throughout the materials, and this data is believed to be accurate to the best of Western Asset's knowledge at the time of publication, but cannot be guaranteed. These materials may also contain strategy or product awards or rankings from independent third parties or industry publications which are based on unbiased quantitative and/or qualitative information determined independently by each third party or publication. In some cases, Western Asset may subscribe to these third party's standard industry services or publications. These standard subscriptions and services are available to all asset managers and do not influence rankings or awards in any way.
Investment strategies or products discussed herein may involve a high degree of risk, including the loss of some or all capital. Investments in any products or strategies described in these materials may be volatile, and investors should have the financial ability and willingness to accept such risks.
Unless otherwise noted, investment performance contained in these materials is reflective of a strategy composite. All other strategy data and information included in these materials reflects a representative portfolio which is an account in the composite that Western Asset believes most closely reflects the current portfolio management style of the strategy. Performance is not a consideration in the selection of the representative portfolio. The characteristics of the representative portfolio shown may differ from other accounts in the composite. Information regarding the representative portfolio and the other accounts in the composite are available upon request. Statements in these materials should not be considered investment advice. References, either general or specific, to securities and/or issuers in the materials are for illustrative purposes only and are not intended to be, and should not be interpreted as, recommendation to purchase or sell such securities. Employees and/or clients of Western Asset may have a position in the securities or issuers mentioned.
These materials are not intended to provide, and should not be relied on for, accounting, legal, tax, investment or other advice. The recipient should consult its own counsel, accountant, investment, tax, and any other advisers for this advice, including economic risks and merits, related to making an investment with Western Asset. The recipient is responsible for observing the applicable laws and regulations of their country of residence.
Founded in 1971, Western Asset Management Company is a global fixed-income investment manager with offices in Pasadena, New York, London, Singapore, Tokyo, Melbourne, São Paulo, Hong Kong, and Zürich. Western Asset is a wholly owned subsidiary of Franklin Resources, Inc. but operates autonomously. Western Asset is comprised of six legal entities across the globe, each with distinct regional registrations: Western Asset Management Company, LLC, a registered Investment Adviser with the Securities and Exchange Commission; Western Asset Management Company Ltda. is regulated by Comissão de Valores Mobiliários; Western Asset Management Company Pty Ltd ABN 41 117 767 923 is the holder of the Australian Financial Services License 303160; Western Asset Management Company Pte. Ltd. Co. Reg. No. 200007692R is a holder of a Capital Markets Services License for fund management and regulated by the Monetary Authority of Singapore; Western Asset Management Company Ltd, a registered Financial Instruments Business Operator and regulated by the Financial Services Agency of Japan; and Western Asset Management Company Limited is authorised and regulated by the Financial Conduct Authority ("FCA") (FRN 145930). This communication is intended for distribution to Professional Clients only if deemed to be a financial promotion in the UK as defined by the FCA. This communication may also be intended for certain EEA countries where Western Asset has been granted permission to do so. For the current list of the approved EEA countries please contact Western Asset at +44 (0)20 7422 3000.