skip navigation
Blog

Stay up to date on timely topics and market events. Subscribe to our Blog now.

MARKETS
June 25, 2024

Weekly Municipal Monitor—Revenue Growth Remains Resilient

By Sam Weitzman

Stay up to date on timely topics and market events. Subscribe to our Blog now.

Muni Returns Were Relatively Unchanged During the Week

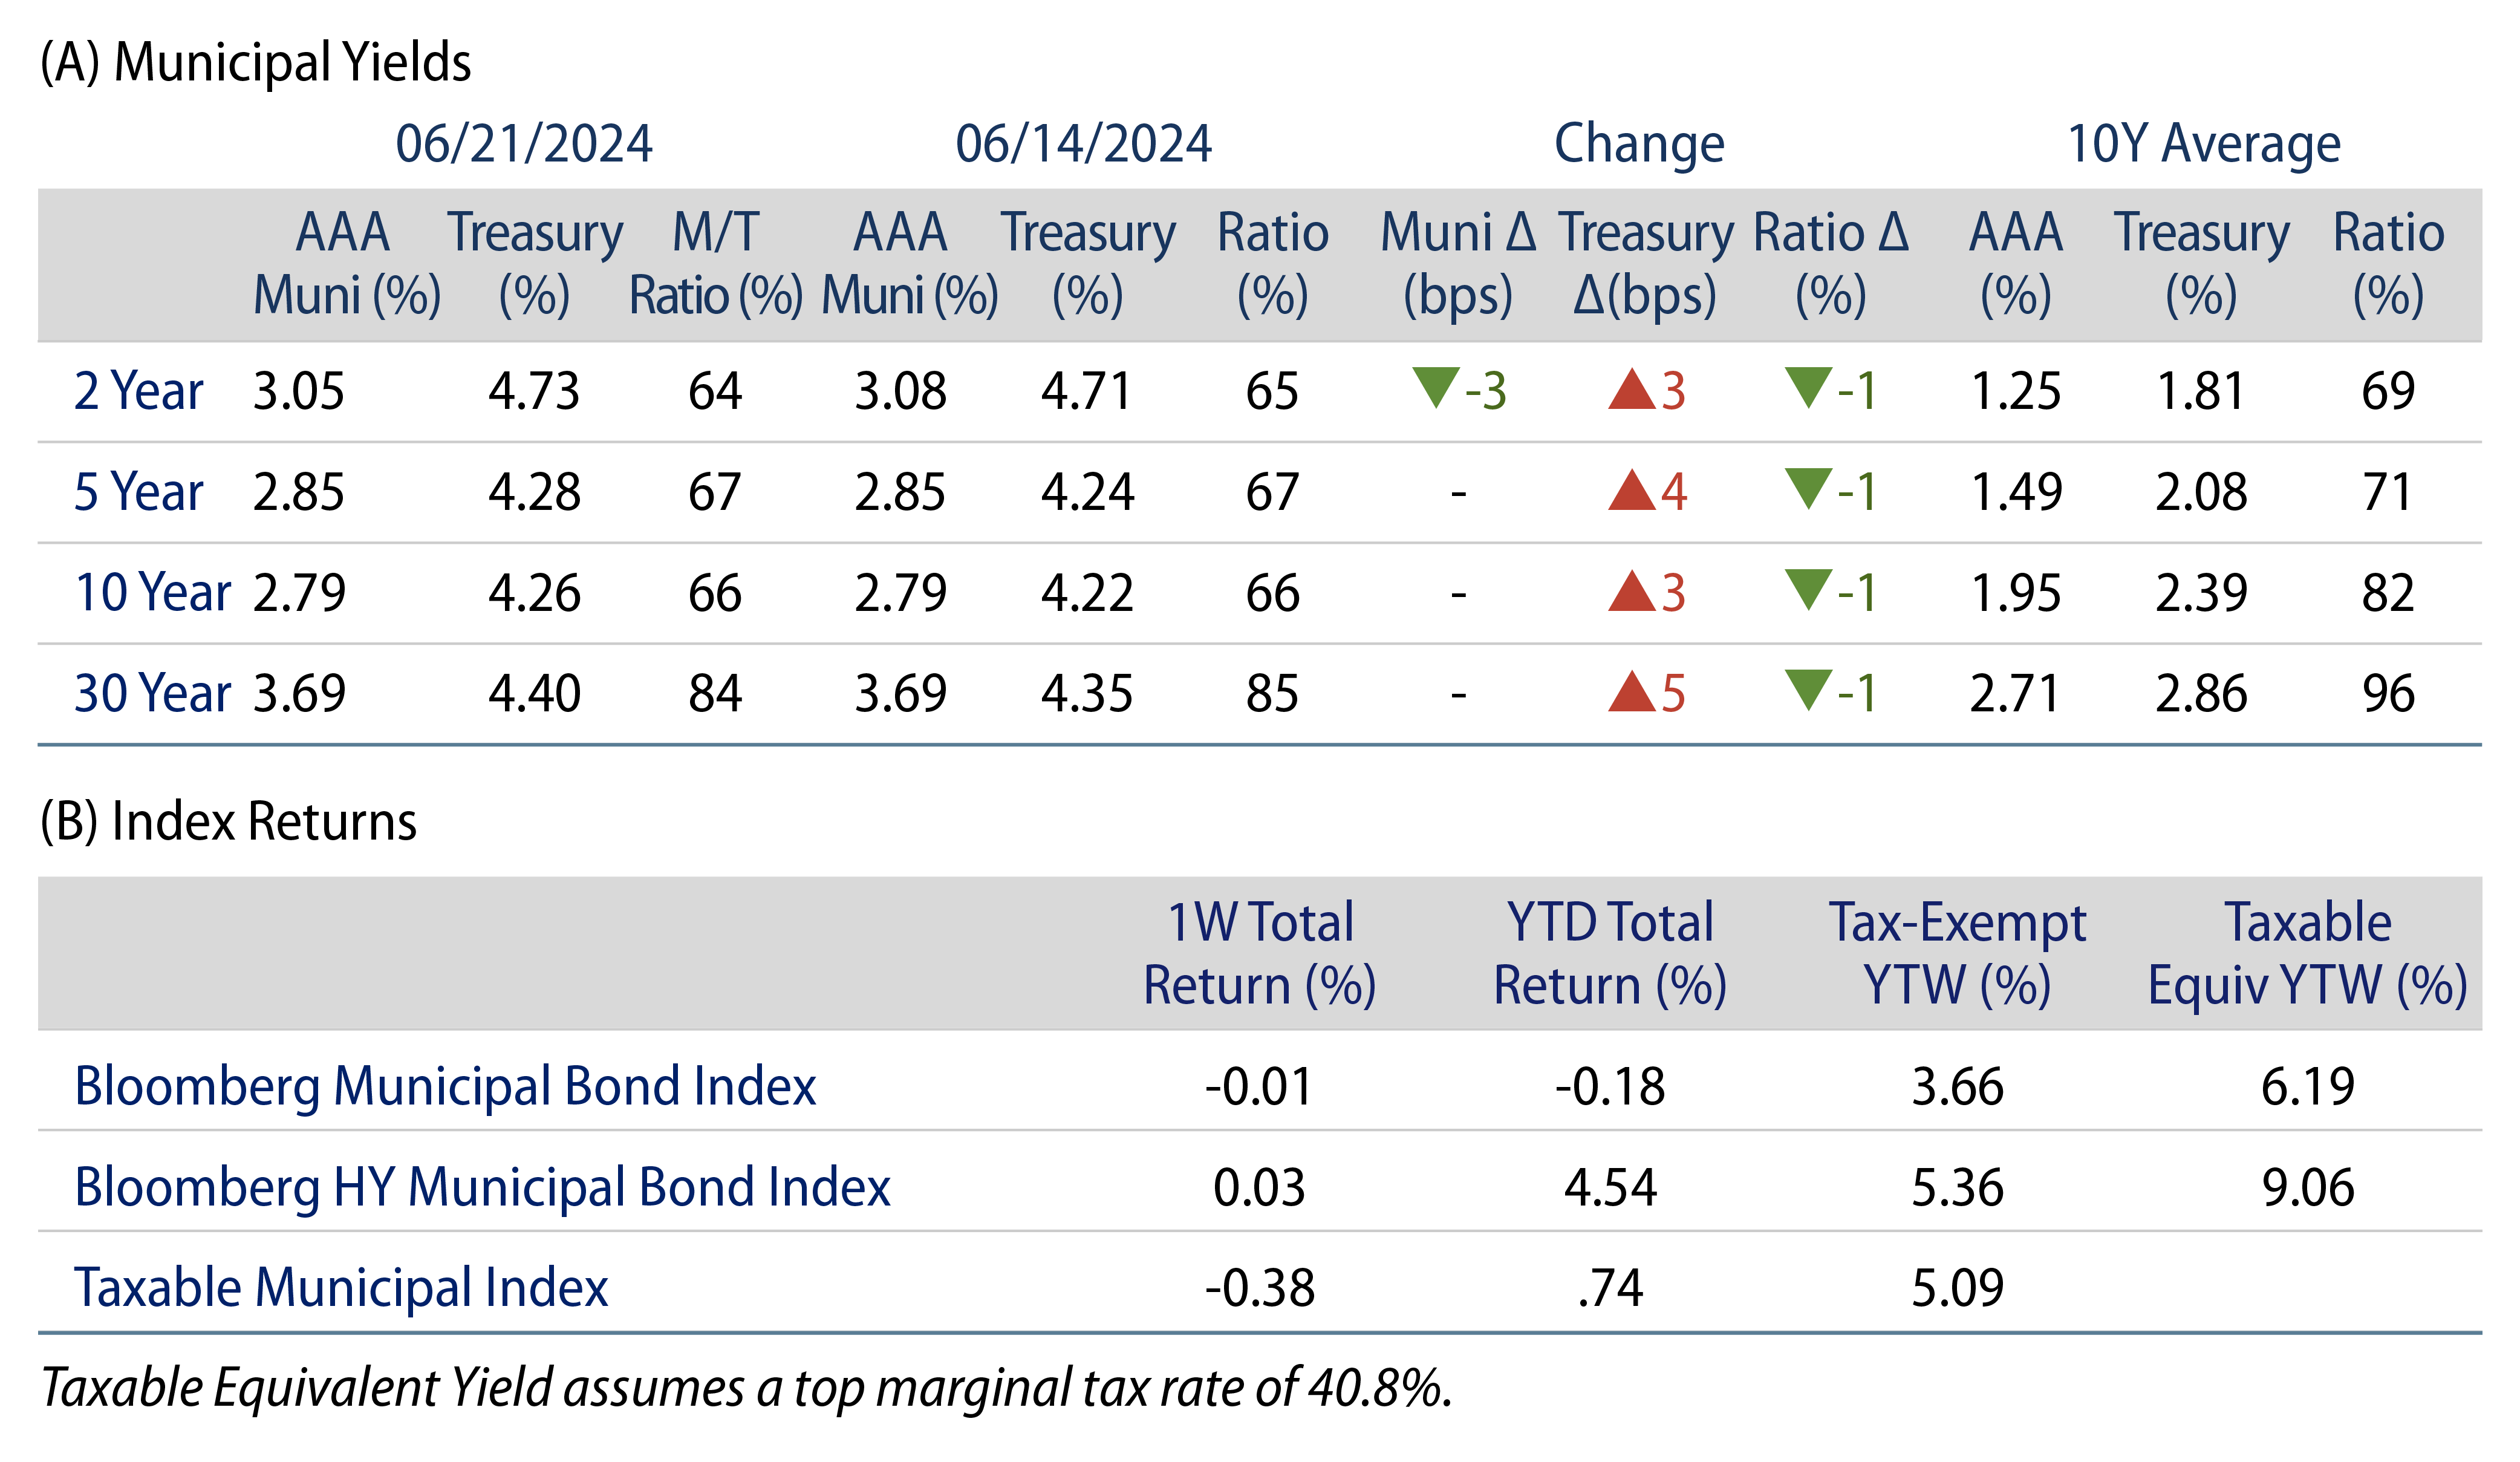
Municipal returns were relatively unchanged but outperformed Treasuries, which moved higher during the week on relatively hawkish Federal Reserve (Fed) dialogue. Supply declined week-over-week but remained near elevated levels. The Bloomberg Municipal Index returned -0.01% during the week, the High Yield Muni Index returned 0.03 % and the Taxable Muni Index returned -0.38%. This week we provide an update on state and local tax collections.

Supply Remained Elevated Amid Modest Fund Inflows

Fund Flows (up $16 million): During the week ending June 19, weekly reporting municipal mutual funds recorded $16 million of net inflows, according to Lipper. Long-term funds recorded $189 million of inflows and high-yield funds recorded $249 million of inflows. Meanwhile, intermediate funds recorded $3 million of outflows and short-term funds recorded $123 million of outflows. This week’s inflows led estimated year-to-date (YTD) net inflows higher to $11.8 billion.

Supply (YTD supply of $226 billion, up 44% YoY): The muni market recorded $9 billion of new-issue volume last week, up 6% from the prior week. YTD issuance of $226 billion is 44% higher than last year’s level, with tax-exempt issuance 48% higher and taxable issuance 6% higher year-over-year (YoY). This week’s calendar is expected to remain elevated at $12 billion. Largest deals include $1.5 billion City of Los Angeles Tax and Revenue Anticipation Notes and $1.0 billion Massachusetts Bay Transportation Authority transactions.

This Week in Munis: State and Local Revenue Growth Remains Resilient

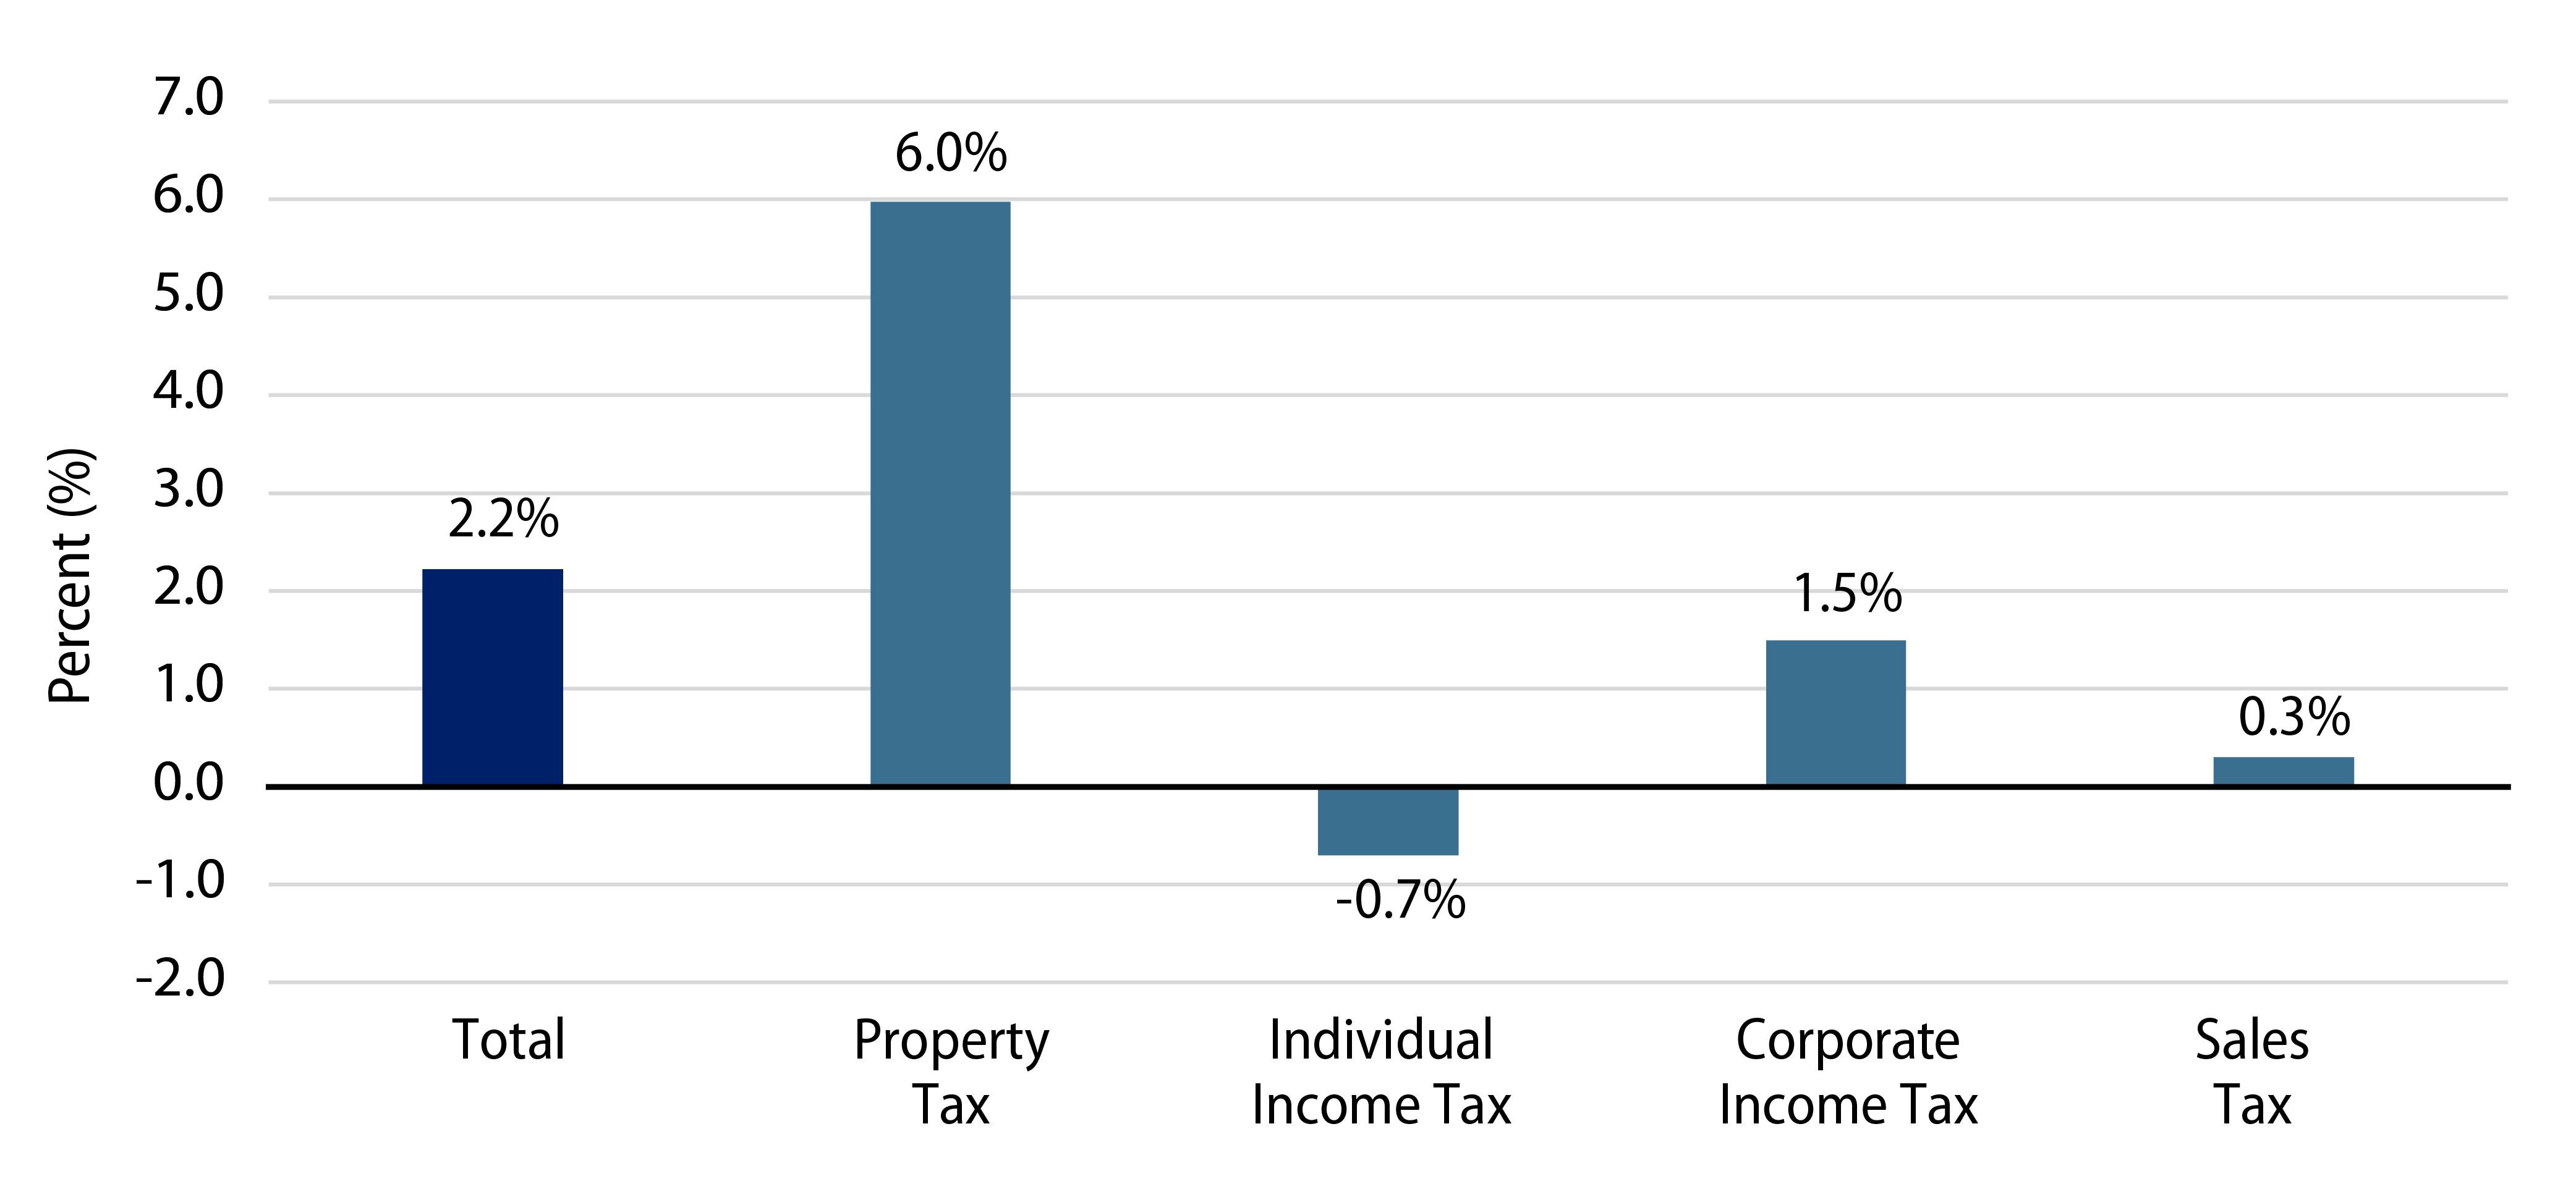
Earlier this month, the Census released 1Q24 state and local revenue estimates, highlighting resiliency in overall state and local tax collections. First quarter major state and local government tax collections grew 2.2% from 1Q23 levels, to $487 billion. Among the major state revenue sources, individual income taxes declined 0.7% YoY, while corporate income and sales tax collections increased 1.5% and 0.3% YoY, respectively. Property tax collections, the primary source of revenues for local governments, increased 6.0% YoY to $195 billion.

Exhibit 1: 1Q24 YoY Revenue Growth
1Q24 YoY Revenue Growth
Source: Western Asset, Census NSA major state and local tax revenue. As of 11 Jun 24. Select the image to expand the view.

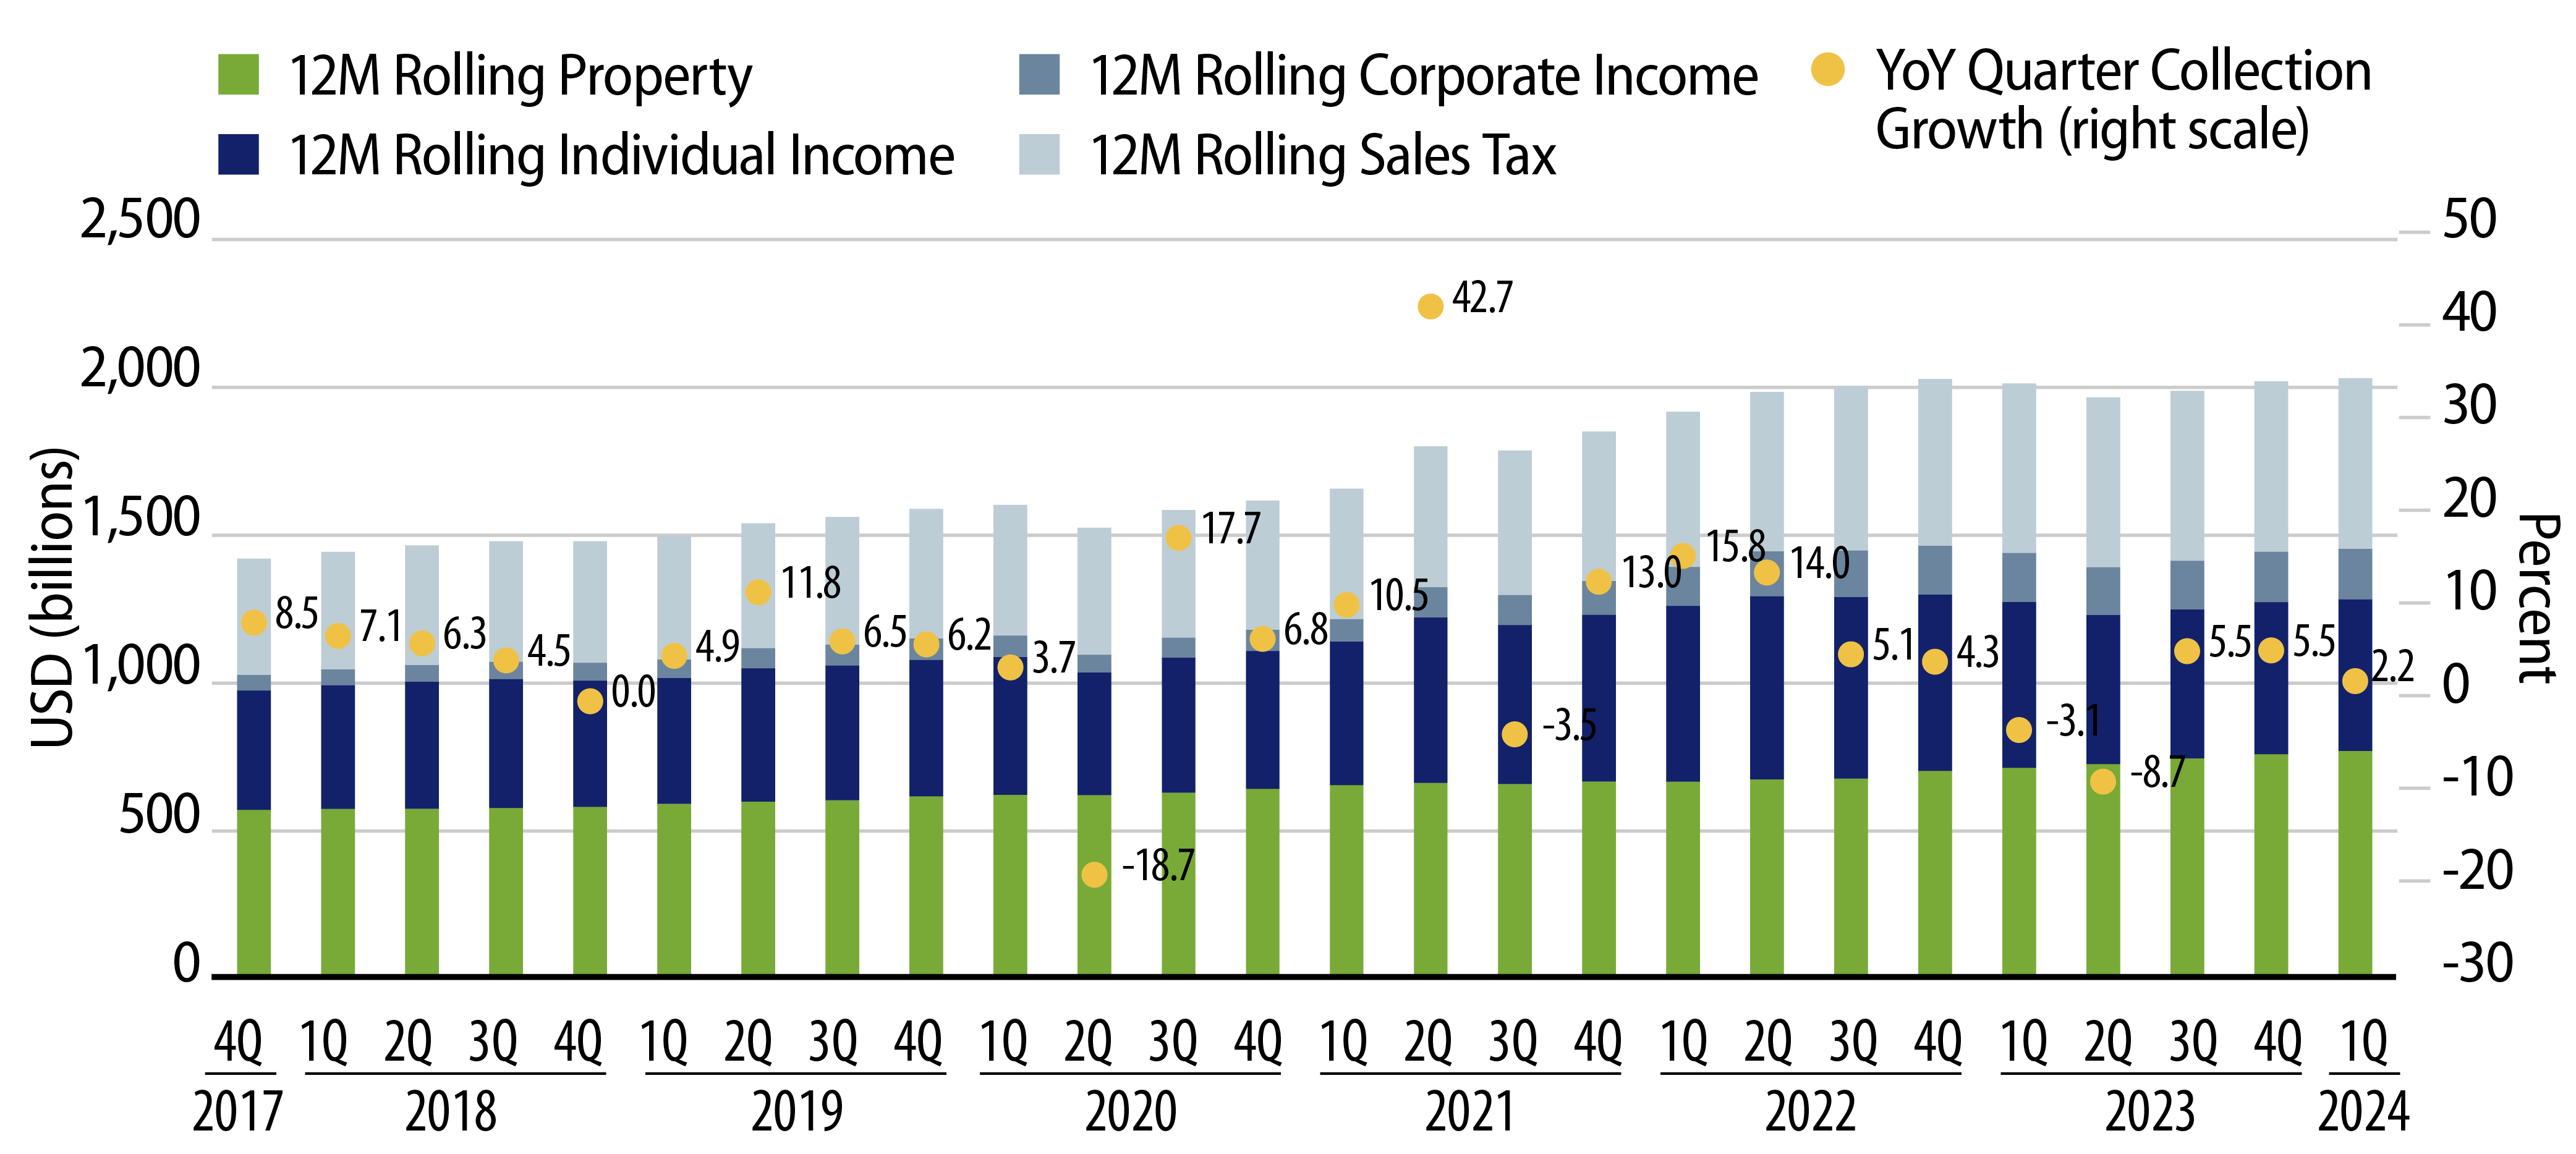
Four-quarter trailing tax collections increased 0.9% YoY to $2.03 trillion. On a 12-month trailing basis, individual income tax collections declined 8.6% YoY, while corporate income tax and sales tax collections increased 3.3% and 0.6%, respectively. Property tax collections also recorded the strongest trend higher, growing 8.0% YoY.

Exhibit 2: 12-Month Trailing State and Local Revenue Collections
12-Month Trailing State and Local Revenue Collections
Source: Western Asset, Census NSA major state and local tax revenue. As of 11 Jun 24. Select the image to expand the view.

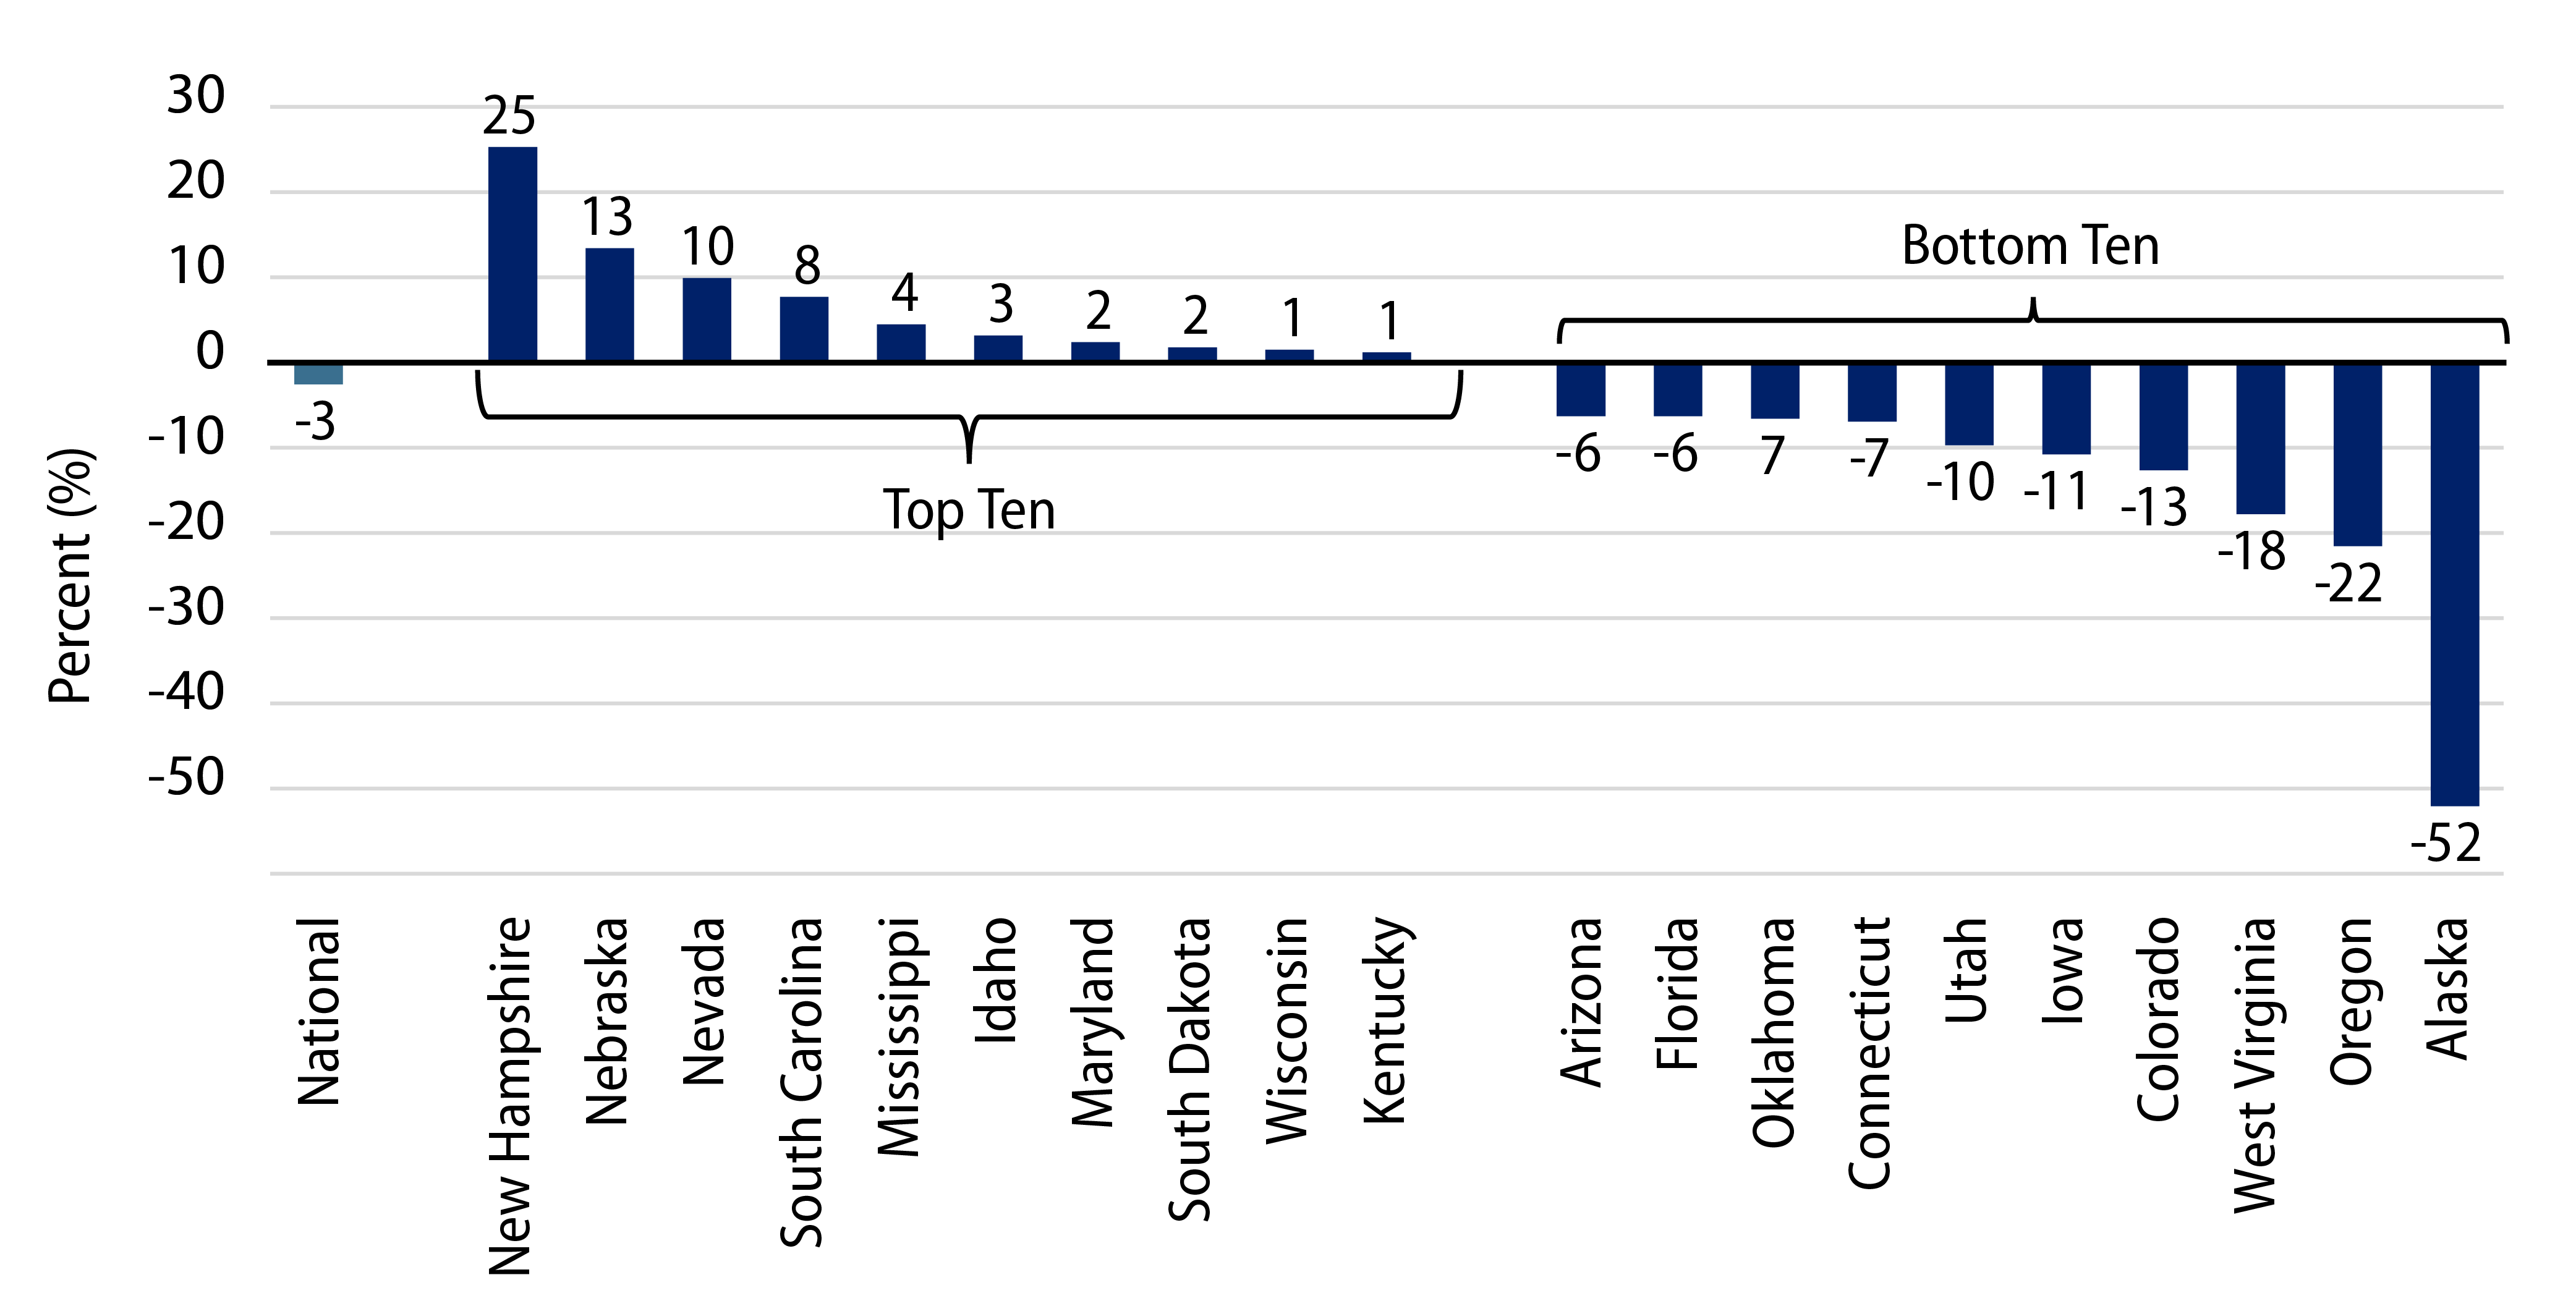
From a state perspective, the Census estimates that the majority of states recorded revenue declines in the four quarters ending March 31, and average state revenues declined 2.6% during the year. On a YoY basis, New Hampshire (+25%), Nebraska (+13%) and Nevada (+10%) recorded the highest growth in estimated tax revenue, while Alaska (-52%), Oregon (-22%) and West Virginia (-18%) recorded the greatest tax collection declines.

Exhibit 3: YoY Change in 12-Month Trailing Collections
YoY Change in 12-Month Trailing Collections
Source: Western Asset, Census NSA major state and local tax revenue. As of 11 Jun 24. Select the image to expand the view.

The continued growth of tax collections highlights the resiliency of municipal credit, despite signs of slower economic growth. The local government sector remains the largest sector of the municipal market and continues to be supported by a strong real estate market and robust property tax collections. While most states recorded YoY tax revenue declines, a sound labor market and a strong consumer base should be supportive of revenues. We expect elevated cash balances to support municipal credit over the medium term.

Municipal Credit Curves and Relative Value

Exhibit 4: Muni Credit Curves
Muni Credit Curves
Source: Bloomberg, Western Asset. As of 21 Jun 24. Bloomberg BVAL Municipal Credit Indices (AAA, AA, A, BBB, respectively) and US Sovereign Curves. Taxable-Equivalent Muni Credit Curves consider the top marginal effective tax rate of 40.8%. Select the image to expand the view.
Exhibit 5: Taxable-Equivalent Muni Credit Curves
Taxable-Equivalent Muni Credit Curves
Source: Bloomberg, Western Asset. As of 21 Jun 24. Bloomberg BVAL Municipal Credit Indices (AAA, AA, A, BBB, respectively) and US Sovereign Curves. Taxable-Equivalent Muni Credit Curves consider the top marginal effective tax rate of 40.8%. Select the image to expand the view.
Exhibit 6: AAA Munis vs. Treasuries
AAA Munis vs. Treasuries
Source: Muni Yields: Thomson Reuters MMD, Treasury Yields: Bloomberg. As of 21 Jun 24. Past performance is not a guarantee of future results. It is not possible to invest directly in an Index. Select the image to expand the view.
Exhibit 7: Tax-Exempt and Taxable Muni Valuations
Tax-Exempt and Taxable Muni Valuations
Source: Bloomberg. Yield-to-worst (YTW) is the lowest potential yield that can be received on a bond without the issuer actually defaulting. As of 21 Jun 24. Select the image to expand the view.

Western Asset Key Themes for Muni Investors

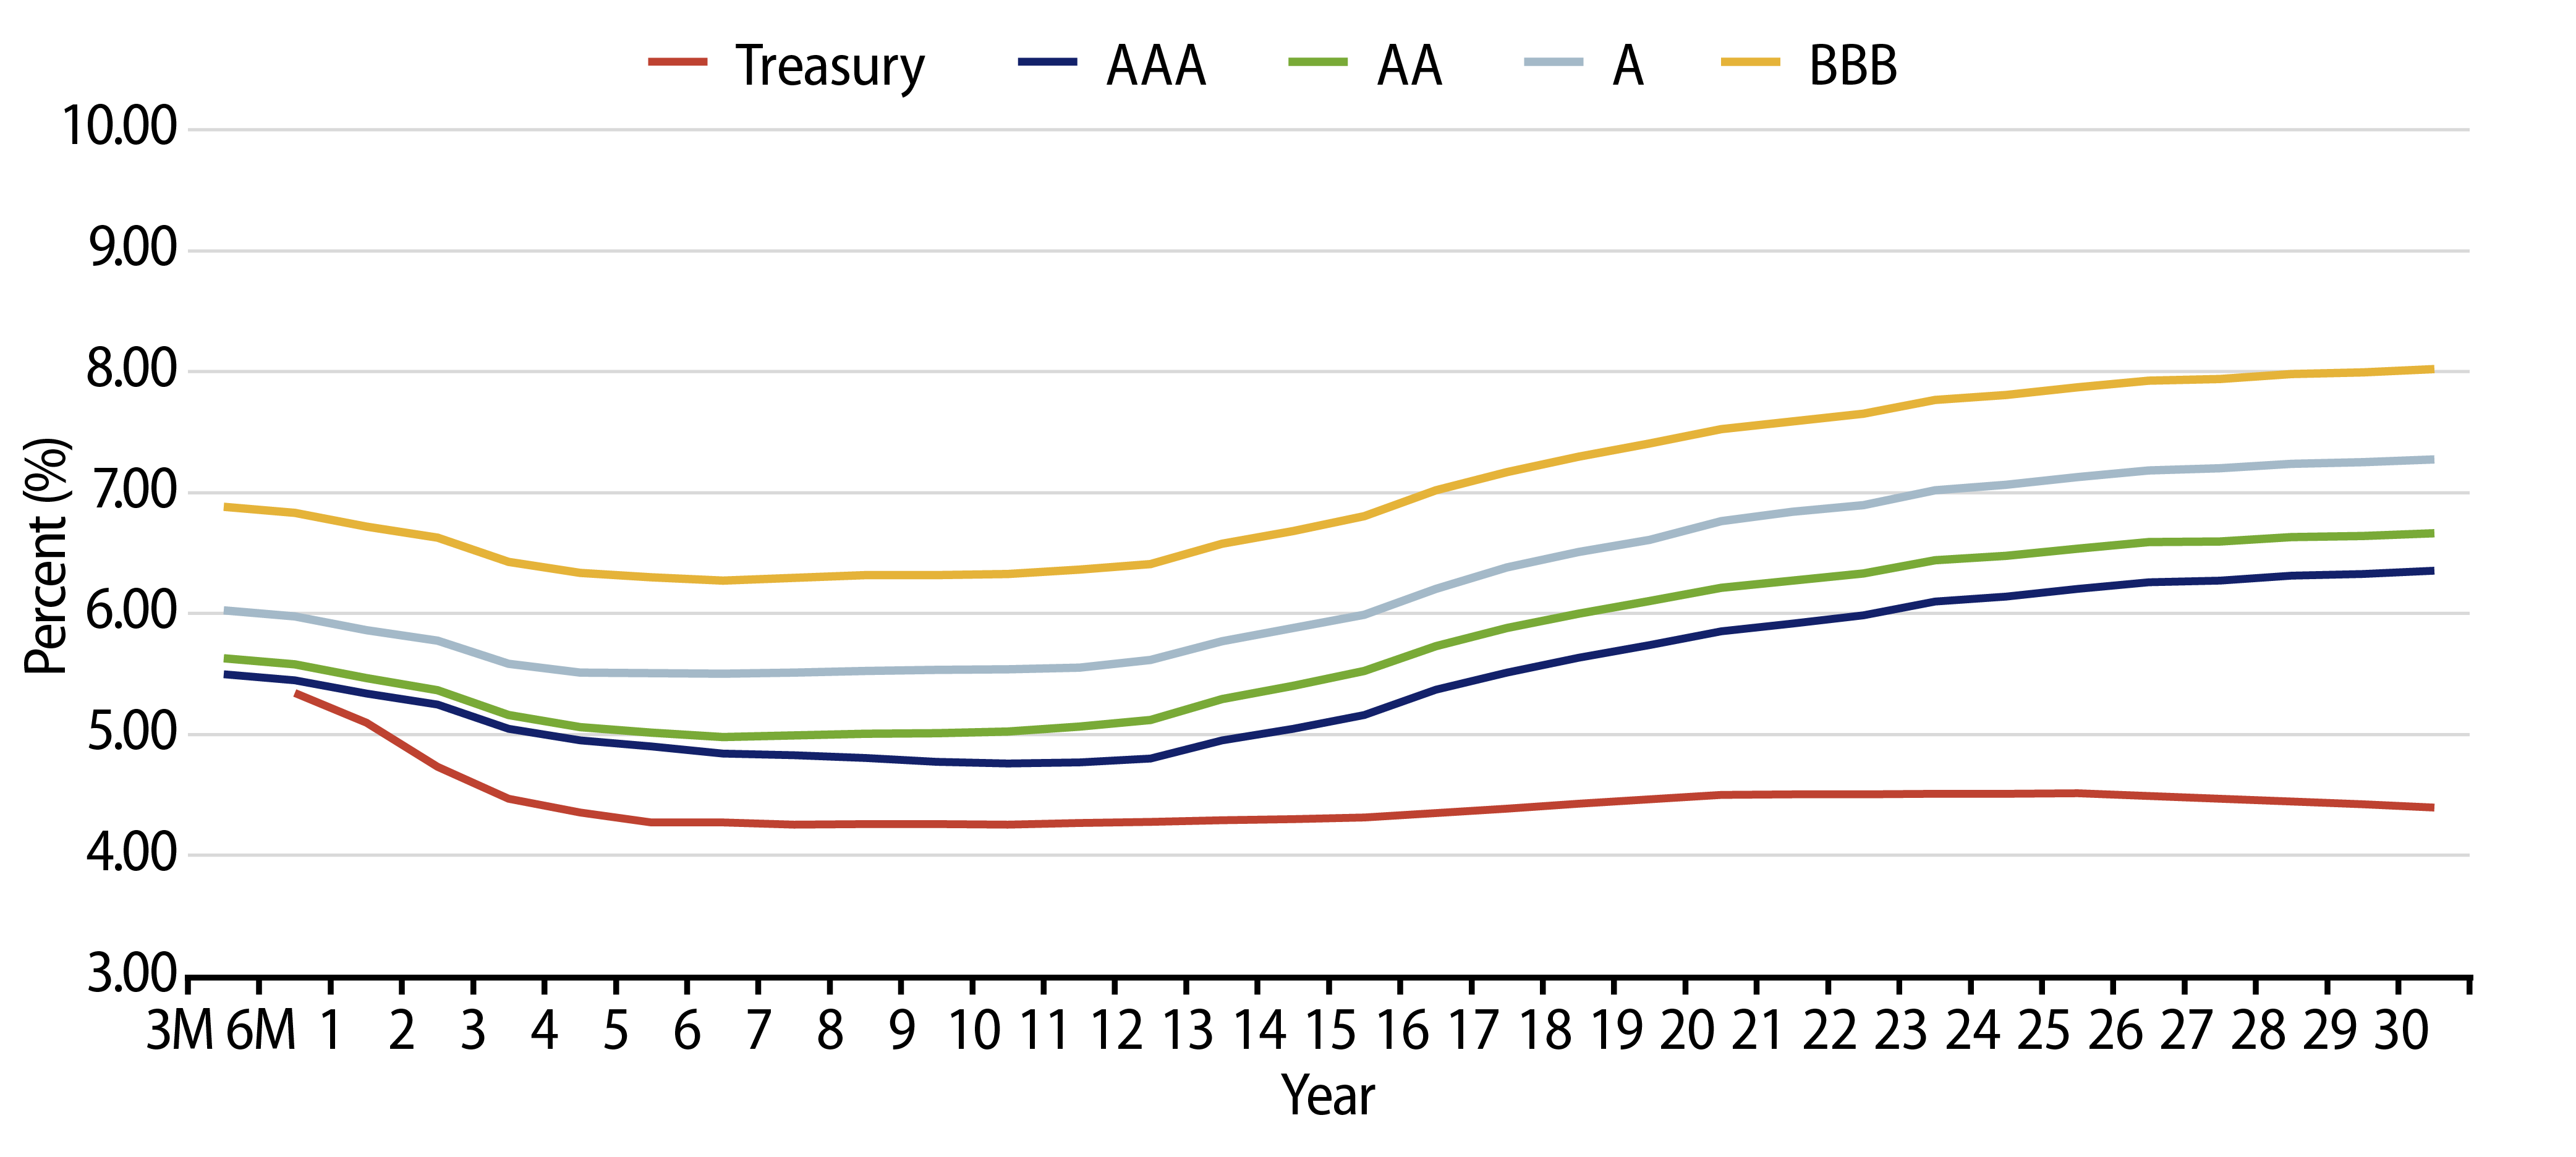
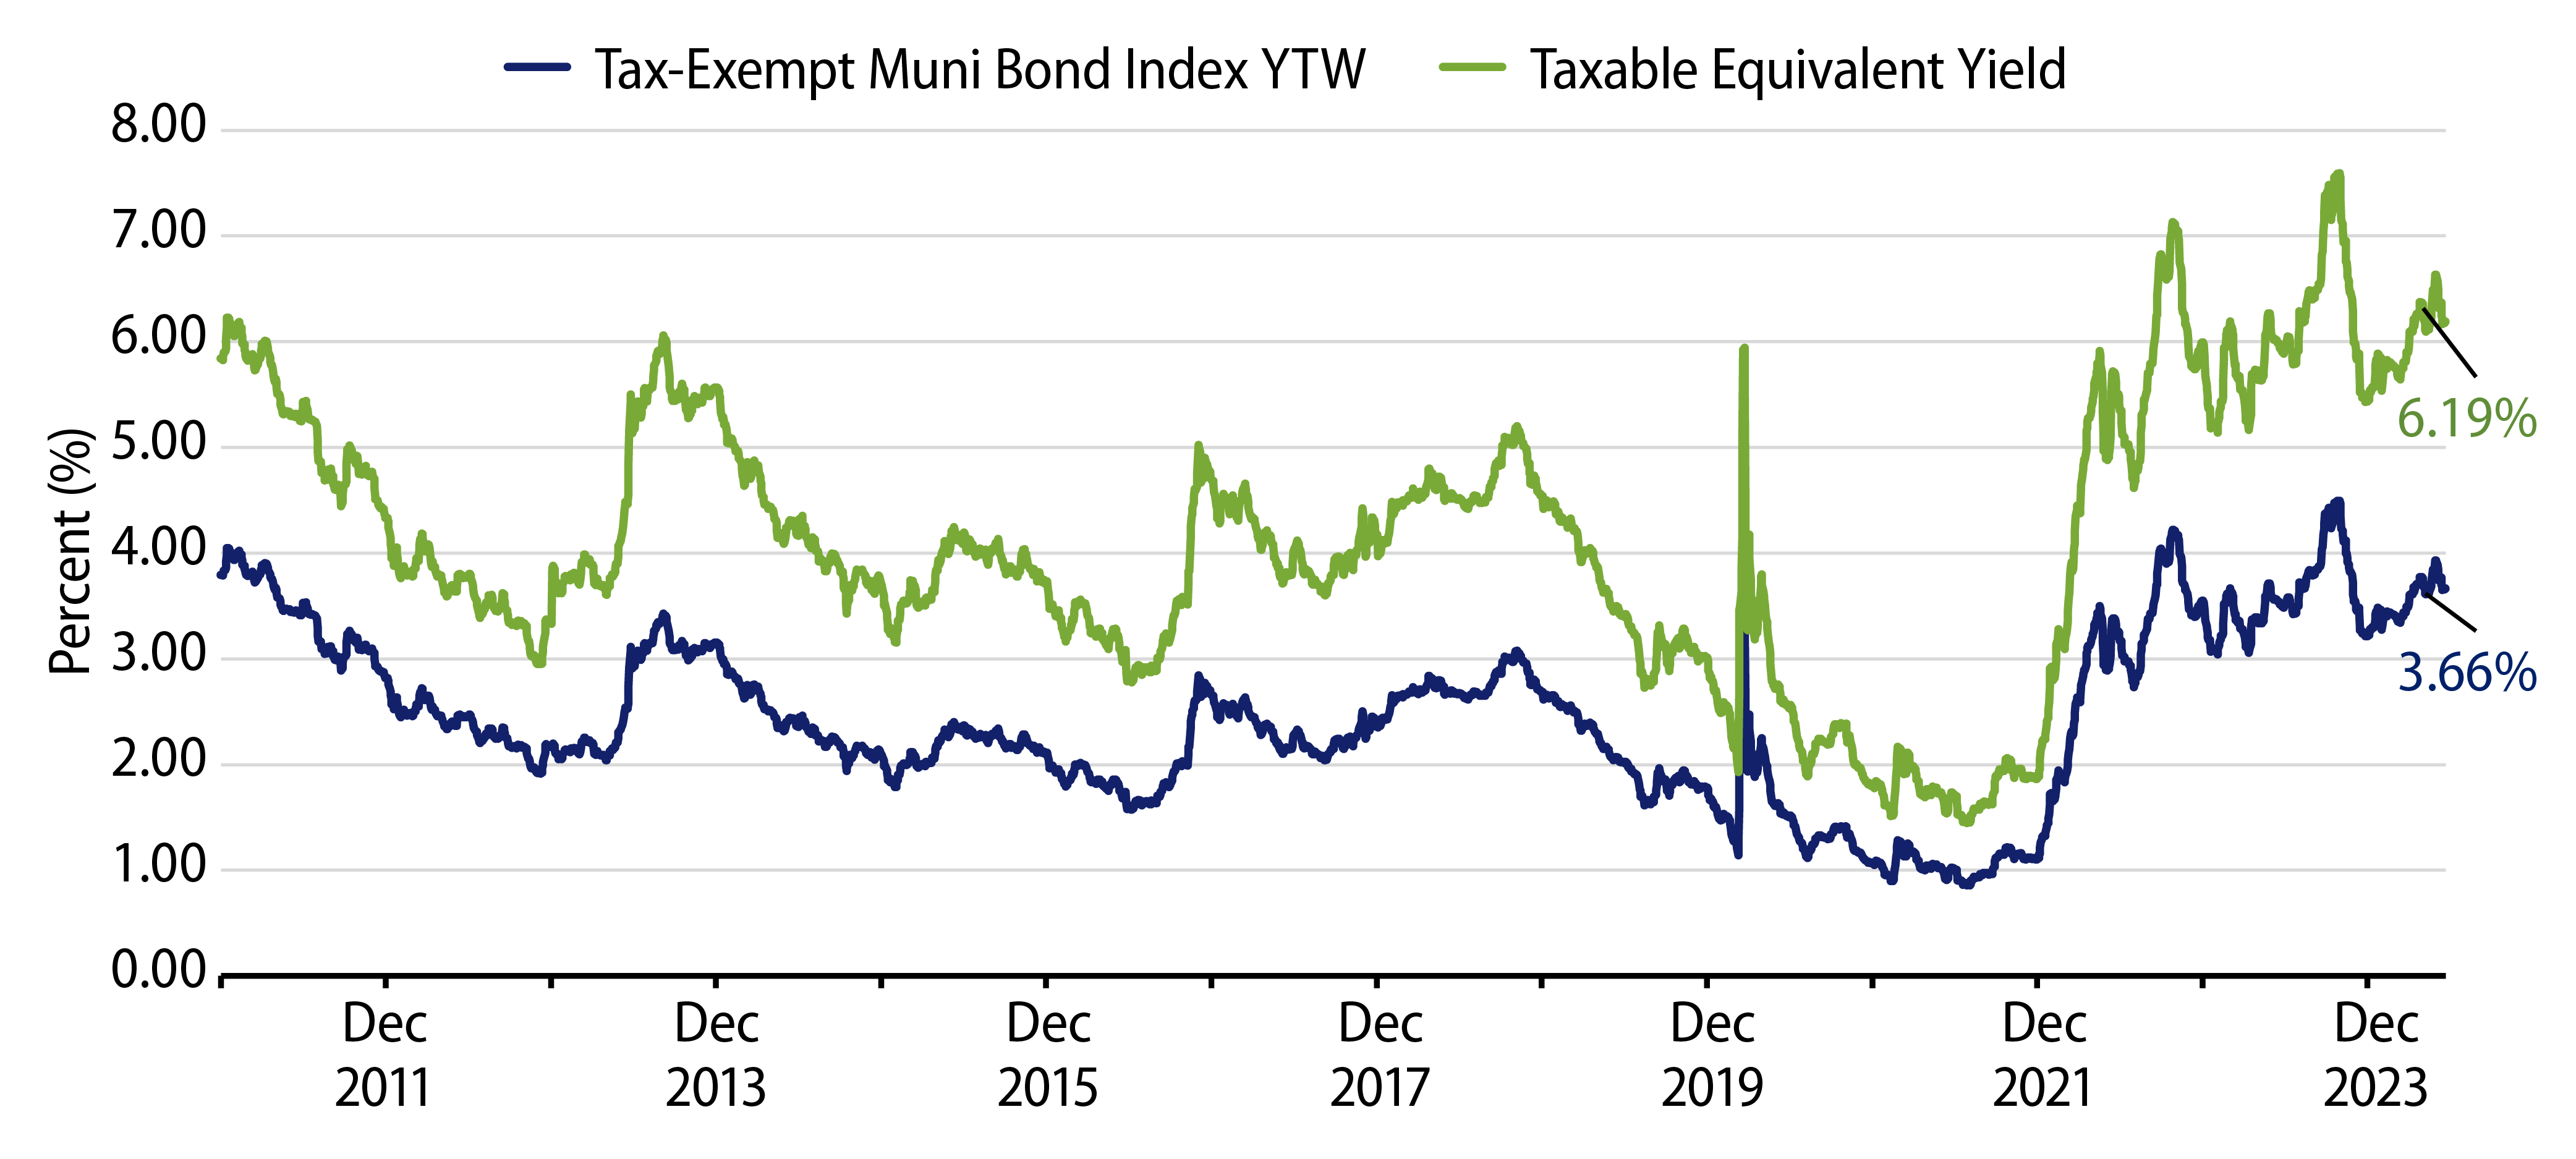
Theme #1: Municipal taxable-equivalent yields are above decade averages.

Exhibit 8: Muni and Taxable-Equivalent Muni Yield-to-Worst
Muni and Taxable-Equivalent Muni Yield-to-Worst
Source: Bloomberg, Western Asset. As of 21 Jun 24. Bloomberg Municipal Bond Index Yield Considering Highest Marginal Tax Rate of 40.8%. Indexes are unmanaged and one cannot directly invest in them. They do not include fees, expenses or sales charges. Past performance is not an indicator or a guarantee of future results. Select the image to expand the view.

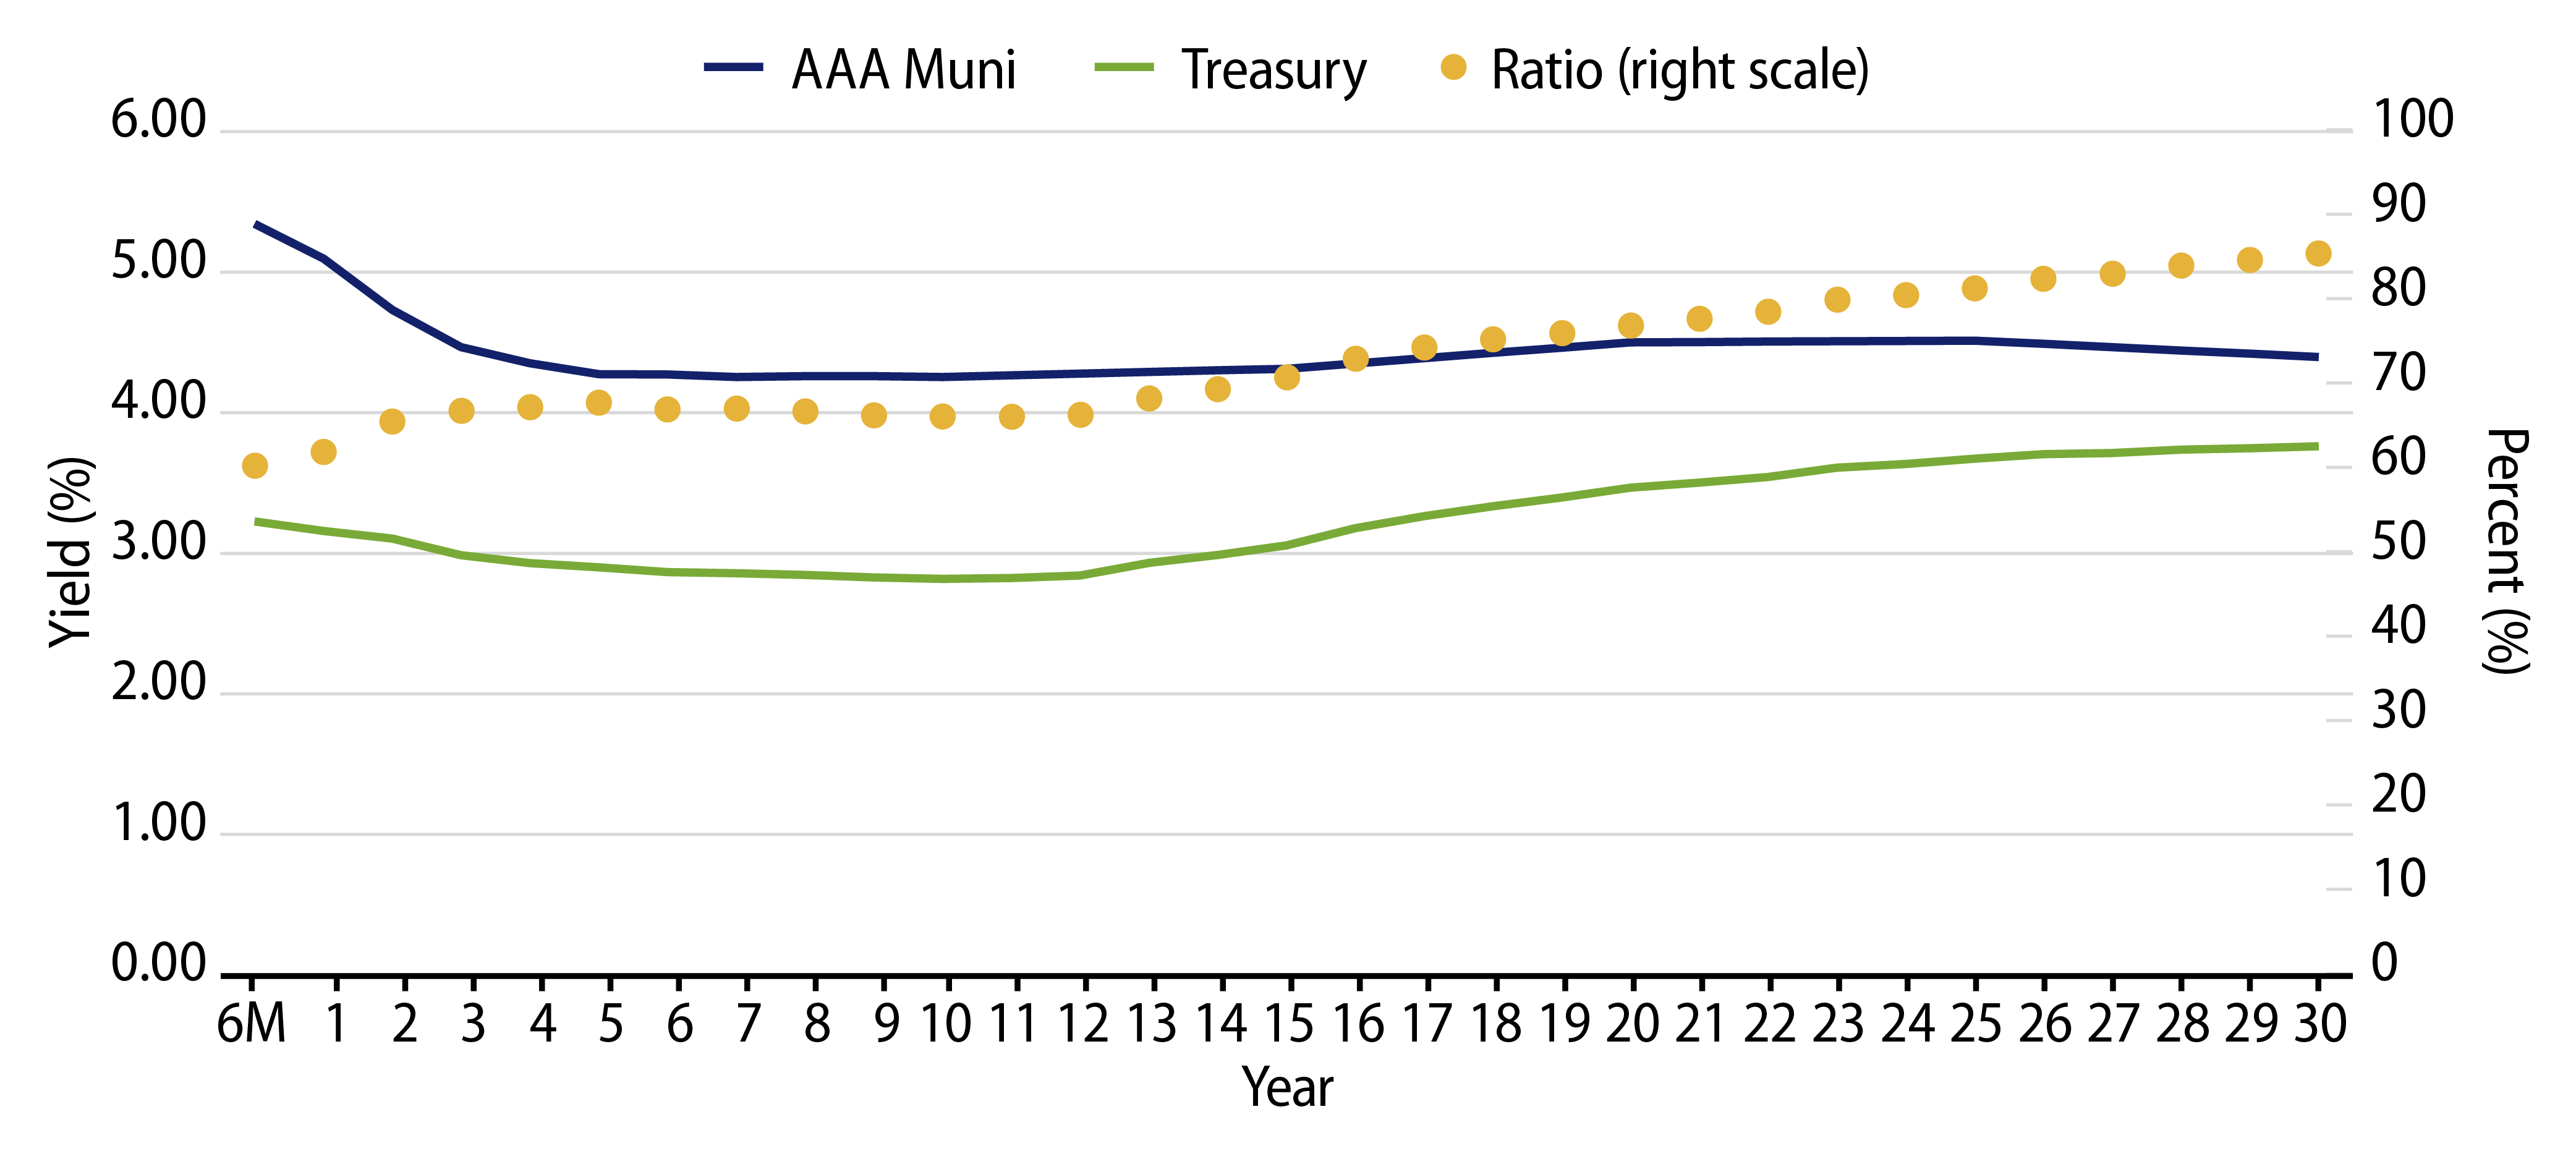
Theme #2: The muni yield curve has disinverted in recent weeks, but bar-belled value remains.

Exhibit 9: AAA Municipal vs. Treasury Yield Curves
AAA Municipal vs. Treasury Yield Curves
Source: Bloomberg, Western Asset. As of 21 Jun 24. Bloomberg Valuation Service (BVAL) AAA Muni Curve and US On-/Off-the-Run Sovereign Curve. Indexes are unmanaged and one cannot directly invest in them. They do not include fees, expenses or sales charges. Past performance is not an indicator or a guarantee of future results. Select the image to expand the view.

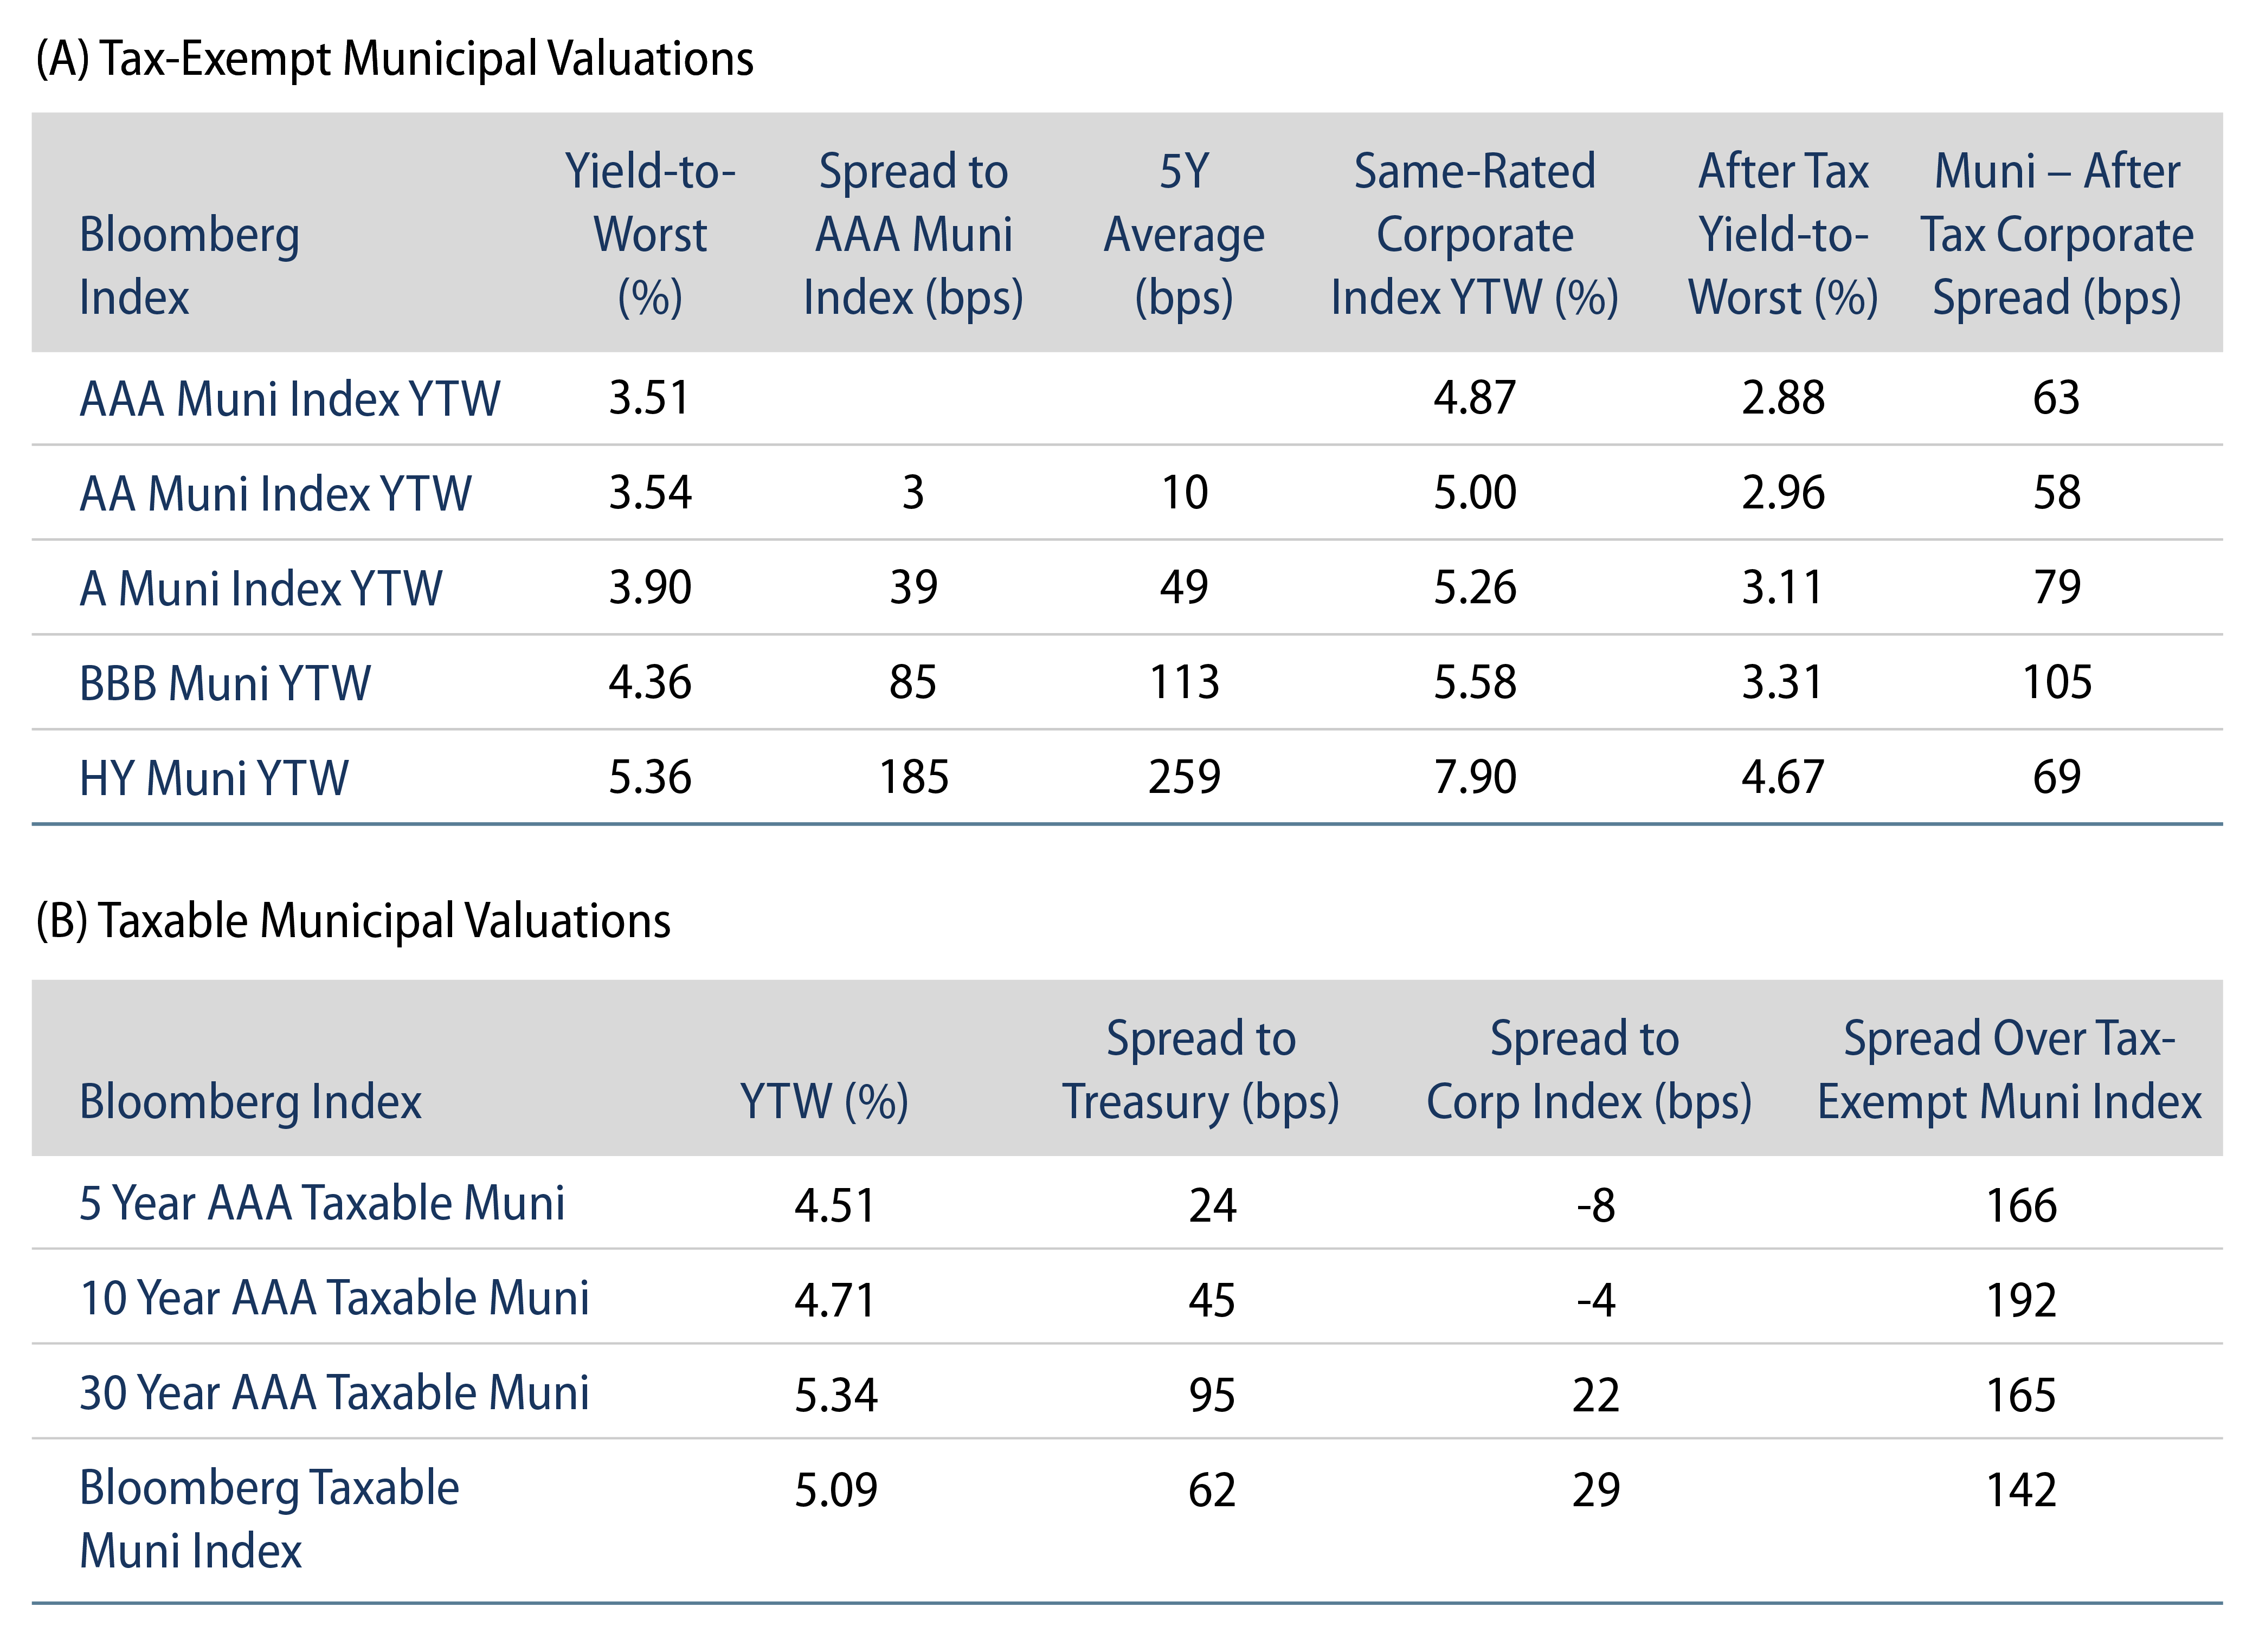
Theme #3: Munis offer attractive after-tax yield pickup versus longer-dated Treasuries and investment-grade corporate credit.

Exhibit 10: Municipal vs. Taxable Fixed-Income Yields by Quality
Municipal vs. Taxable Fixed-Income Yields by Quality
Source: Western Asset, Bloomberg. As 21 Jun 24. 10- and 30-Year comparison reflects Bloomberg Valuation Service (BVAL) AAA Muni Curve and US On-/Off-the-Run Sovereign Curve. AA Muni reflects the Bloomberg AA Muni Bond Index. A Muni reflects the Bloomberg A Muni Bond Index. BBB Muni reflects the Bloomberg BBB Muni Bond Index. HY Muni reflects the Bloomberg High Yield Muni Bond Index. AA Corp reflects the Bloomberg AA Corporate Bond Index. A Corp reflects the Bloomberg A Corporate Bond Index. BBB Corp reflects the Bloomberg BBB Corporate Bond Index. After-tax yield considers top marginal tax rate of 40.8%. Indexes are unmanaged and one cannot directly invest in them. They do not include fees, expenses or sales charges. Past performance is not an indicator or a guarantee of future results. Select the image to expand the view.

© Western Asset Management Company, LLC 2025. The information contained in these materials ("the materials") is intended for the exclusive use of the designated recipient ("the recipient"). This information is proprietary and confidential and may contain commercially sensitive information, and may not be copied, reproduced or republished, in whole or in part, without the prior written consent of Western Asset Management Company ("Western Asset").
Past performance does not predict future returns. These materials should not be deemed to be a prediction or projection of future performance. These materials are intended for investment professionals including professional clients, eligible counterparties, and qualified investors only.
These materials have been produced for illustrative and informational purposes only. These materials contain Western Asset's opinions and beliefs as of the date designated on the materials; these views are subject to change and may not reflect real-time market developments and investment views.
Third party data may be used throughout the materials, and this data is believed to be accurate to the best of Western Asset's knowledge at the time of publication, but cannot be guaranteed. These materials may also contain strategy or product awards or rankings from independent third parties or industry publications which are based on unbiased quantitative and/or qualitative information determined independently by each third party or publication. In some cases, Western Asset may subscribe to these third party's standard industry services or publications. These standard subscriptions and services are available to all asset managers and do not influence rankings or awards in any way.
Investment strategies or products discussed herein may involve a high degree of risk, including the loss of some or all capital. Investments in any products or strategies described in these materials may be volatile, and investors should have the financial ability and willingness to accept such risks.
Unless otherwise noted, investment performance contained in these materials is reflective of a strategy composite. All other strategy data and information included in these materials reflects a representative portfolio which is an account in the composite that Western Asset believes most closely reflects the current portfolio management style of the strategy. Performance is not a consideration in the selection of the representative portfolio. The characteristics of the representative portfolio shown may differ from other accounts in the composite. Information regarding the representative portfolio and the other accounts in the composite are available upon request. Statements in these materials should not be considered investment advice. References, either general or specific, to securities and/or issuers in the materials are for illustrative purposes only and are not intended to be, and should not be interpreted as, recommendation to purchase or sell such securities. Employees and/or clients of Western Asset may have a position in the securities or issuers mentioned.
These materials are not intended to provide, and should not be relied on for, accounting, legal, tax, investment or other advice. The recipient should consult its own counsel, accountant, investment, tax, and any other advisers for this advice, including economic risks and merits, related to making an investment with Western Asset. The recipient is responsible for observing the applicable laws and regulations of their country of residence.
Founded in 1971, Western Asset Management Company is a global fixed-income investment manager with offices in Pasadena, New York, London, Singapore, Tokyo, Melbourne, São Paulo, Hong Kong, and Zürich. Western Asset is a wholly owned subsidiary of Franklin Resources, Inc. but operates autonomously. Western Asset is comprised of six legal entities across the globe, each with distinct regional registrations: Western Asset Management Company, LLC, a registered Investment Adviser with the Securities and Exchange Commission; Western Asset Management Company Ltda. is regulated by Comissão de Valores Mobiliários; Western Asset Management Company Pty Ltd ABN 41 117 767 923 is the holder of the Australian Financial Services License 303160; Western Asset Management Company Pte. Ltd. Co. Reg. No. 200007692R is a holder of a Capital Markets Services License for fund management and regulated by the Monetary Authority of Singapore; Western Asset Management Company Ltd, a registered Financial Instruments Business Operator and regulated by the Financial Services Agency of Japan; and Western Asset Management Company Limited is authorised and regulated by the Financial Conduct Authority ("FCA") (FRN 145930). This communication is intended for distribution to Professional Clients only if deemed to be a financial promotion in the UK as defined by the FCA. This communication may also be intended for certain EEA countries where Western Asset has been granted permission to do so. For the current list of the approved EEA countries please contact Western Asset at +44 (0)20 7422 3000.