skip navigation
Blog

Stay up to date on timely topics and market events. Subscribe to our Blog now.

MARKETS
September 10, 2024

Weekly Municipal Monitor—Return of the Inflow Cycle

By Sam Weitzman

Stay up to date on timely topics and market events. Subscribe to our Blog now.

Munis Posted Positive Returns Last Week

Municipals posted positive returns last week as yields trailed Treasuries lower on weaker-than-anticipated manufacturing and employment data. Meanwhile, high-grade muni yields moved lower across the curve, and muni supply and demand both remained elevated. The Bloomberg Municipal Index returned 0.51% during the week, the High Yield Muni Index returned 0.56% and the Taxable Muni Index returned 1.75%. As muni mutual funds record a 10th consecutive week of inflows, we highlight the implications of an inflow cycle in the muni market.

Technicals Improved During the Holiday

Fund Flows (up $956 million): During the week ending September 4, weekly reporting municipal mutual funds recorded $956 million of net inflows, according to Lipper. Long-term funds recorded $650 million of inflows, high-yield funds recorded $341 million of inflows, intermediate funds recorded $163 million of inflows and short-term funds recorded $159 million of inflows. This week’s inflows represent the 10th consecutive week of inflows and lead estimated year-to-date (YTD) net inflows higher to $22 billion.

Supply (YTD supply of $337 billion, up 41% YoY): The muni market recorded $8 billion of new-issue volume last week, down from the prior week but higher than typical holiday-shortened weeks. YTD issuance of $337 billion is 41% higher than last year’s level, with tax-exempt issuance 45% higher and taxable issuance 5% higher year-over-year (YoY). This week’s issuance is expected to remain elevated at $12 billion. The largest deals include $1.5 billion New York City Transitional Finance Authority and $1.1 billion State of Illinois transactions.

This Week in Munis: Return of the Inflow Cycle

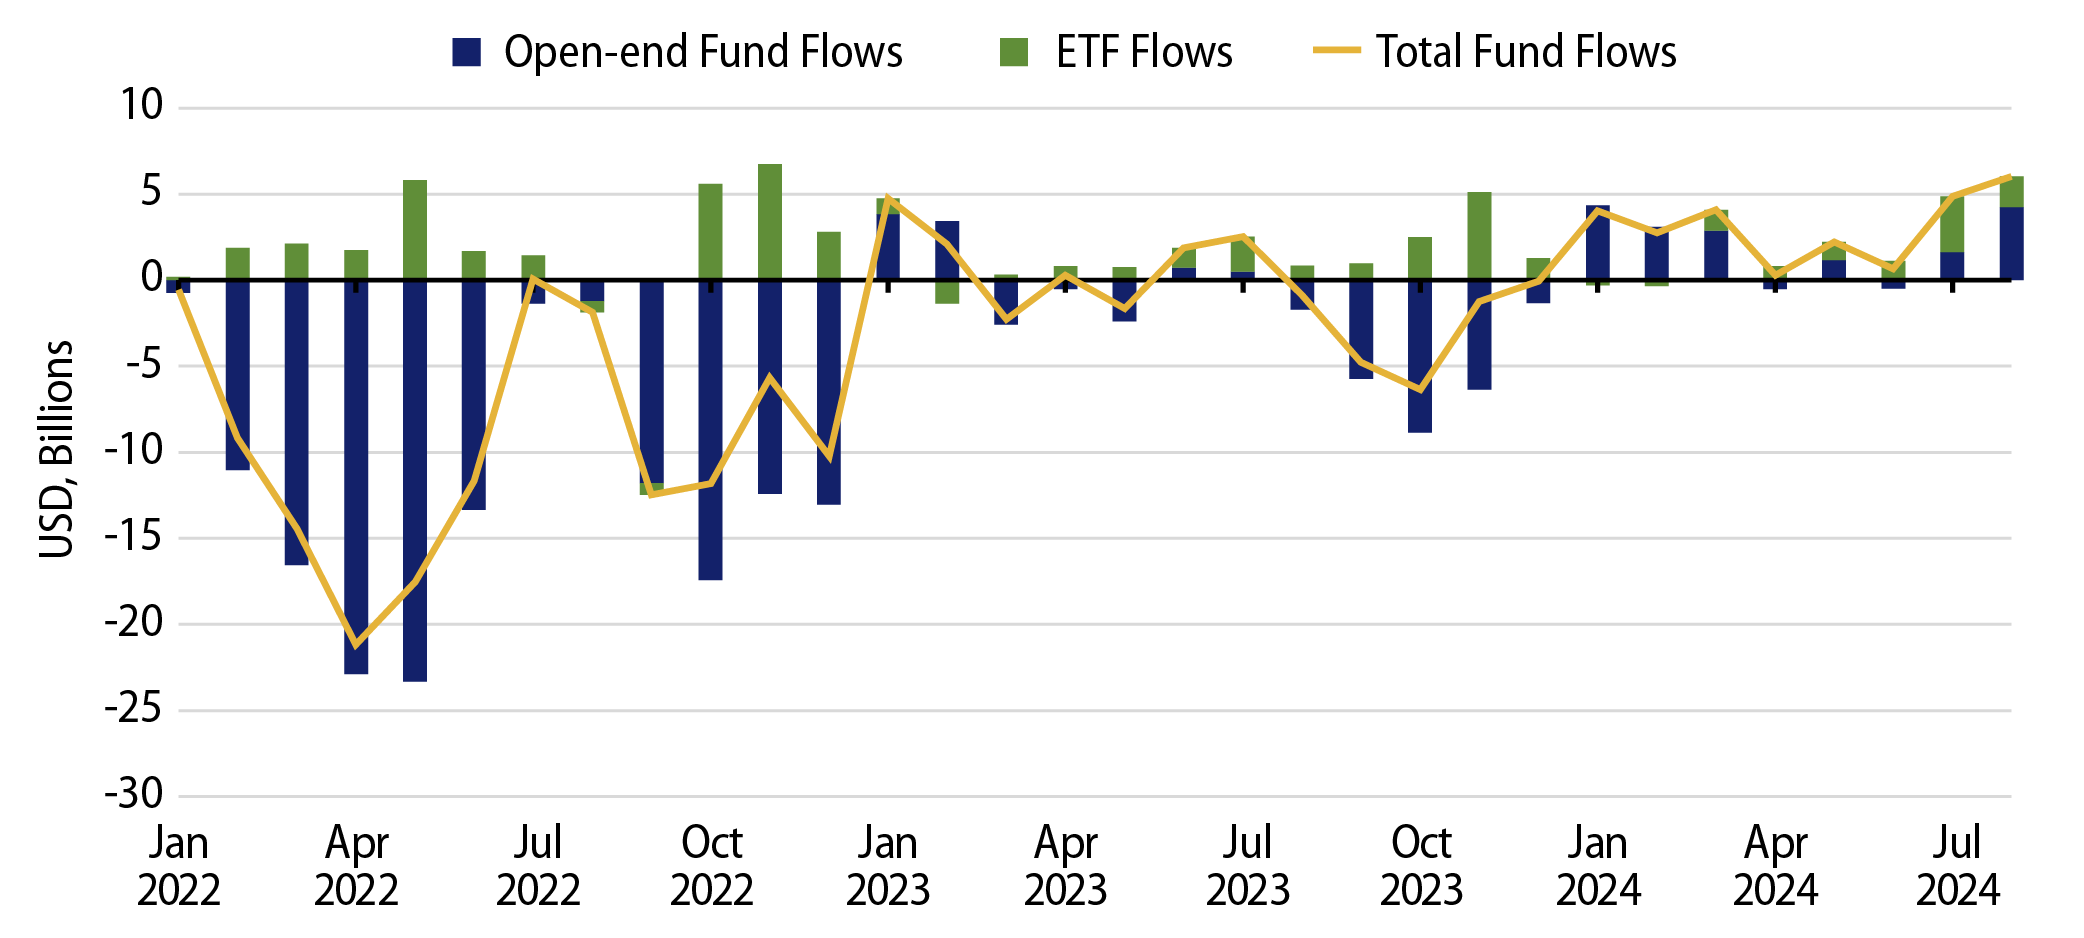
From the start of the Federal Reserve (Fed) hiking cycle in the first quarter of 2022 through the end of 2023, municipal mutual open-end funds and ETFs recorded $122 billion of net outflows, marking the largest and longest period of outflows in the municipal market’s history, according to ICI. So far this year, higher nominal income opportunities have driven flows back to the muni asset class, with municipal mutual funds recording $26 billion of inflows from late December through August 28. According to Lipper, investors signaled appetite for long-duration and high-yield funds, which recorded $24 billion and $11 billion of net inflows through August, respectively.

Exhibit 1: Monthly Municipal Fund Flows
Monthly Municipal Fund Flows
Source: Western Asset, Bloomberg, ICI. As of 07 Sep 23. Select the image to expand the view.

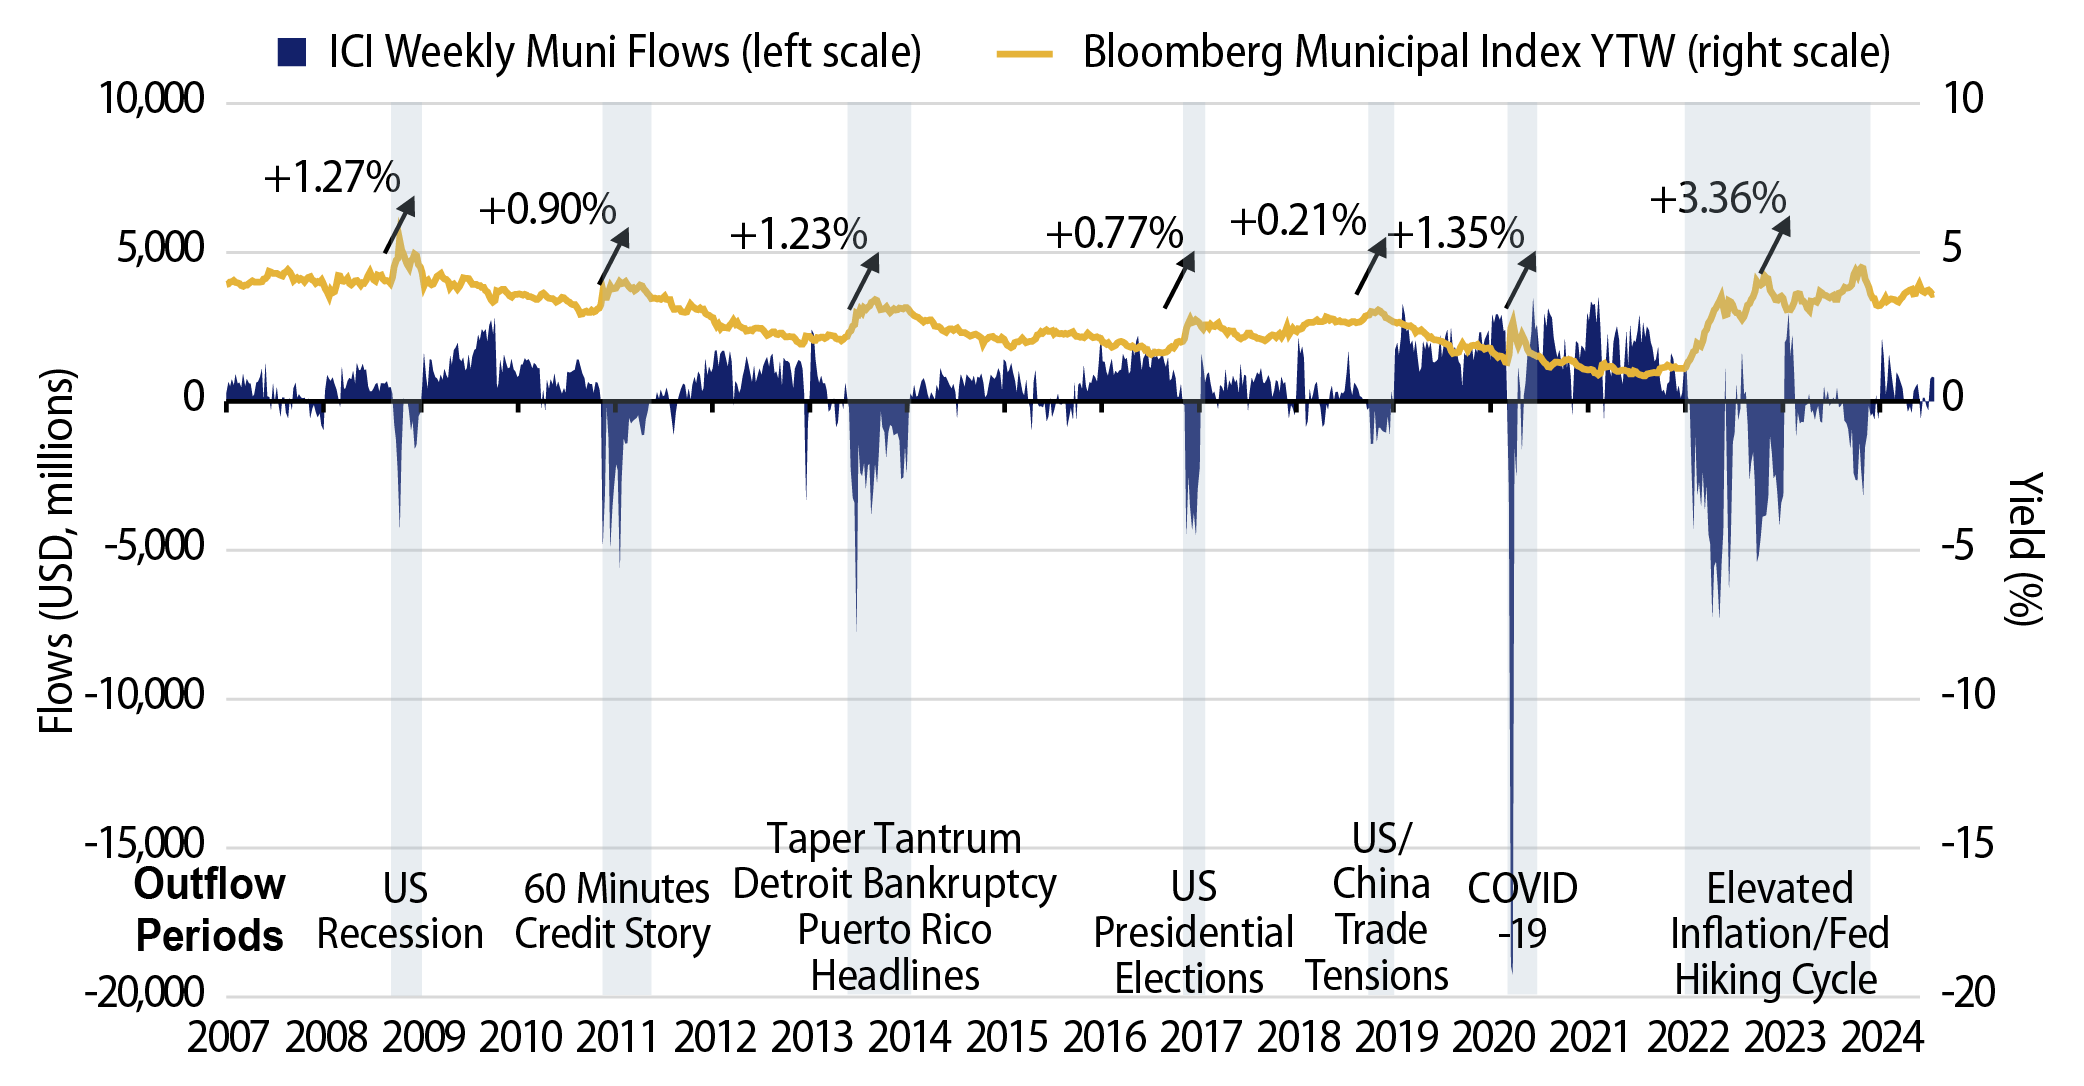
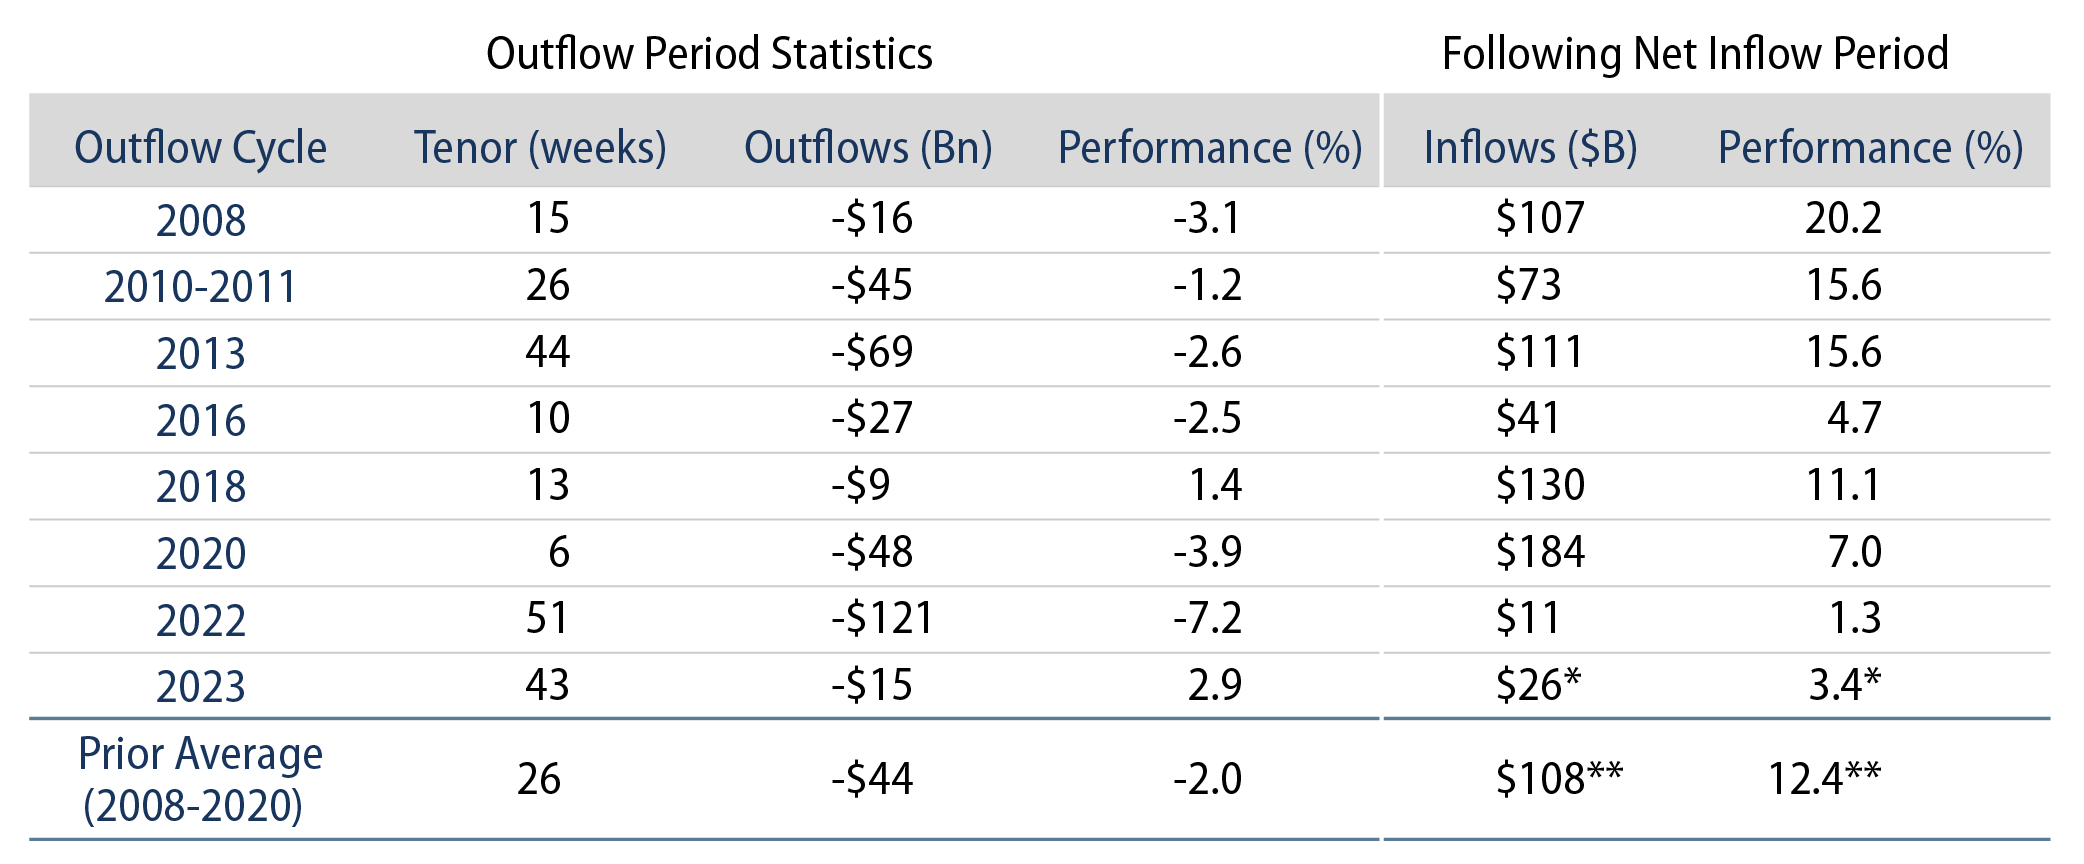
Considering municipal mutual funds comprise a high portion of municipal trading activity, fund flows can contribute to supply and demand imbalances that can impact municipal valuations and opportunities. Over the prior eight outflow cycles, Bloomberg Municipal Bond Index performance averaged -2.0%, and average index yield increases ranged from 0.2% to 3.4%.

Exhibit 2: Municipal Bond Fund Flows vs. Investment Yields
Municipal Bond Fund Flows vs. Investment Yields
Source: Bloomberg, ICI. As of 24 Jul 24. Select the image to expand the view.

As we look at the potential implications of the current inflow cycle, if past serves as precedent, positive demand for the muni asset class could contribute to favorable investor outcomes. Over the last six inflow cycles prior to 2022, the Bloomberg Municipal Bond Index returned an average of 12.4%. The $26 billion of inflows observed this cycle is well below prior inflow averages, and the order of magnitude of the current inflow cycle is well below the $122 billion of outflows collectively observed in 2022 and 2023, suggesting there could be more room to run as the Fed embarks on an expected easing cycle later this month.

Exhibit 3: Muni Outflow/Inflow Cycles vs. Muni Bond Index Performance
Muni Outflow/Inflow Cycles vs. Muni Bond Index Performance
Source: Western Asset, Bloomberg, ICI. Outflow Periods: 2008: 9/17/08-12/31/08; 2010-11: 11/3/10-5/4/11; 2013: 3/6/13-1/8/14; 2016: 10/26/16-1/4/2017; 2018: 9/19/2018-12/19/2018; 2020: 2/26/2020-4/8/2020; 2022: 1/12/22-1/4/23; 2023: 2/15/2023-12/13/2023; Subsequent Inflow Periods: 2008: 12/31/2008-11/3/2010; 2010-11: 5/4/11-3/6/13; 2013: 1/8/14-10/26/2016; 2016: 1/4/2017-9/19/18; 2018: 12/19/18-2/26/20; 2022: 1/4/23-2/15/2023; 2023:12/13/23-9/6/24. Source: Bloomberg, ICI. As of 10 Sep 24. Select the image to expand the view.

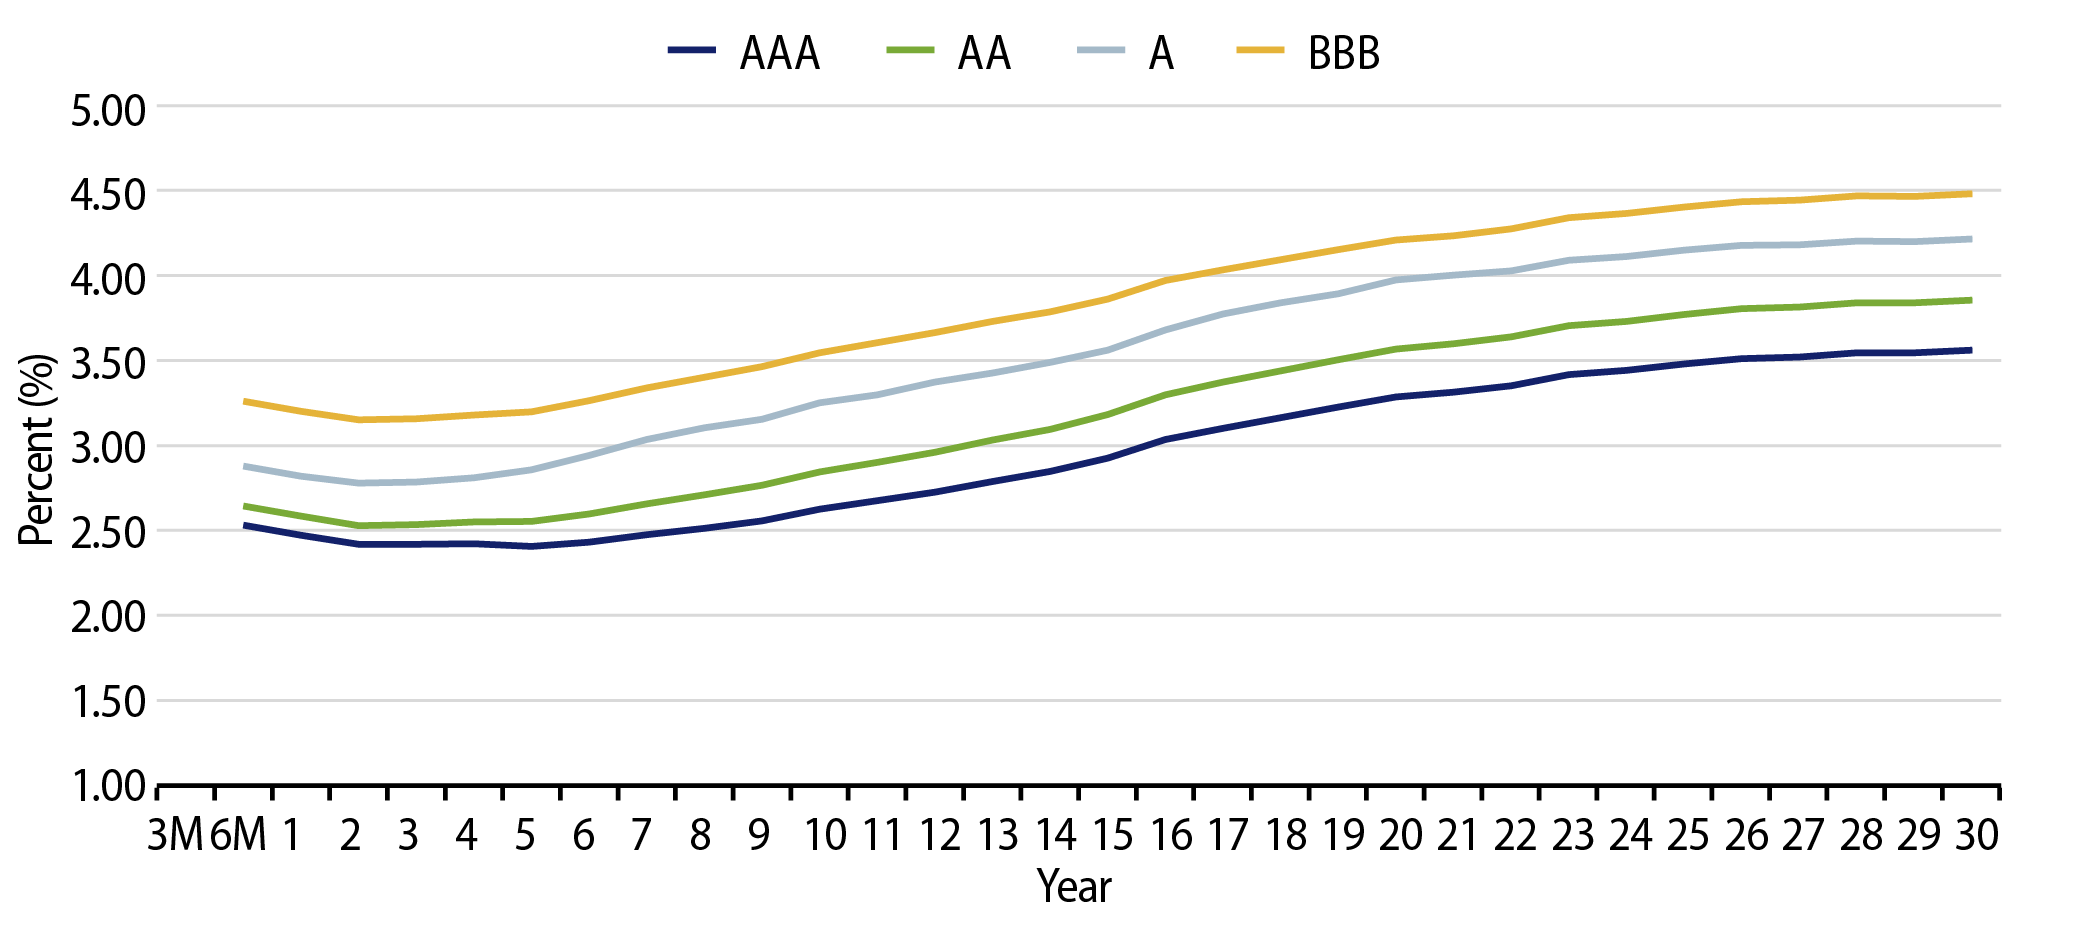
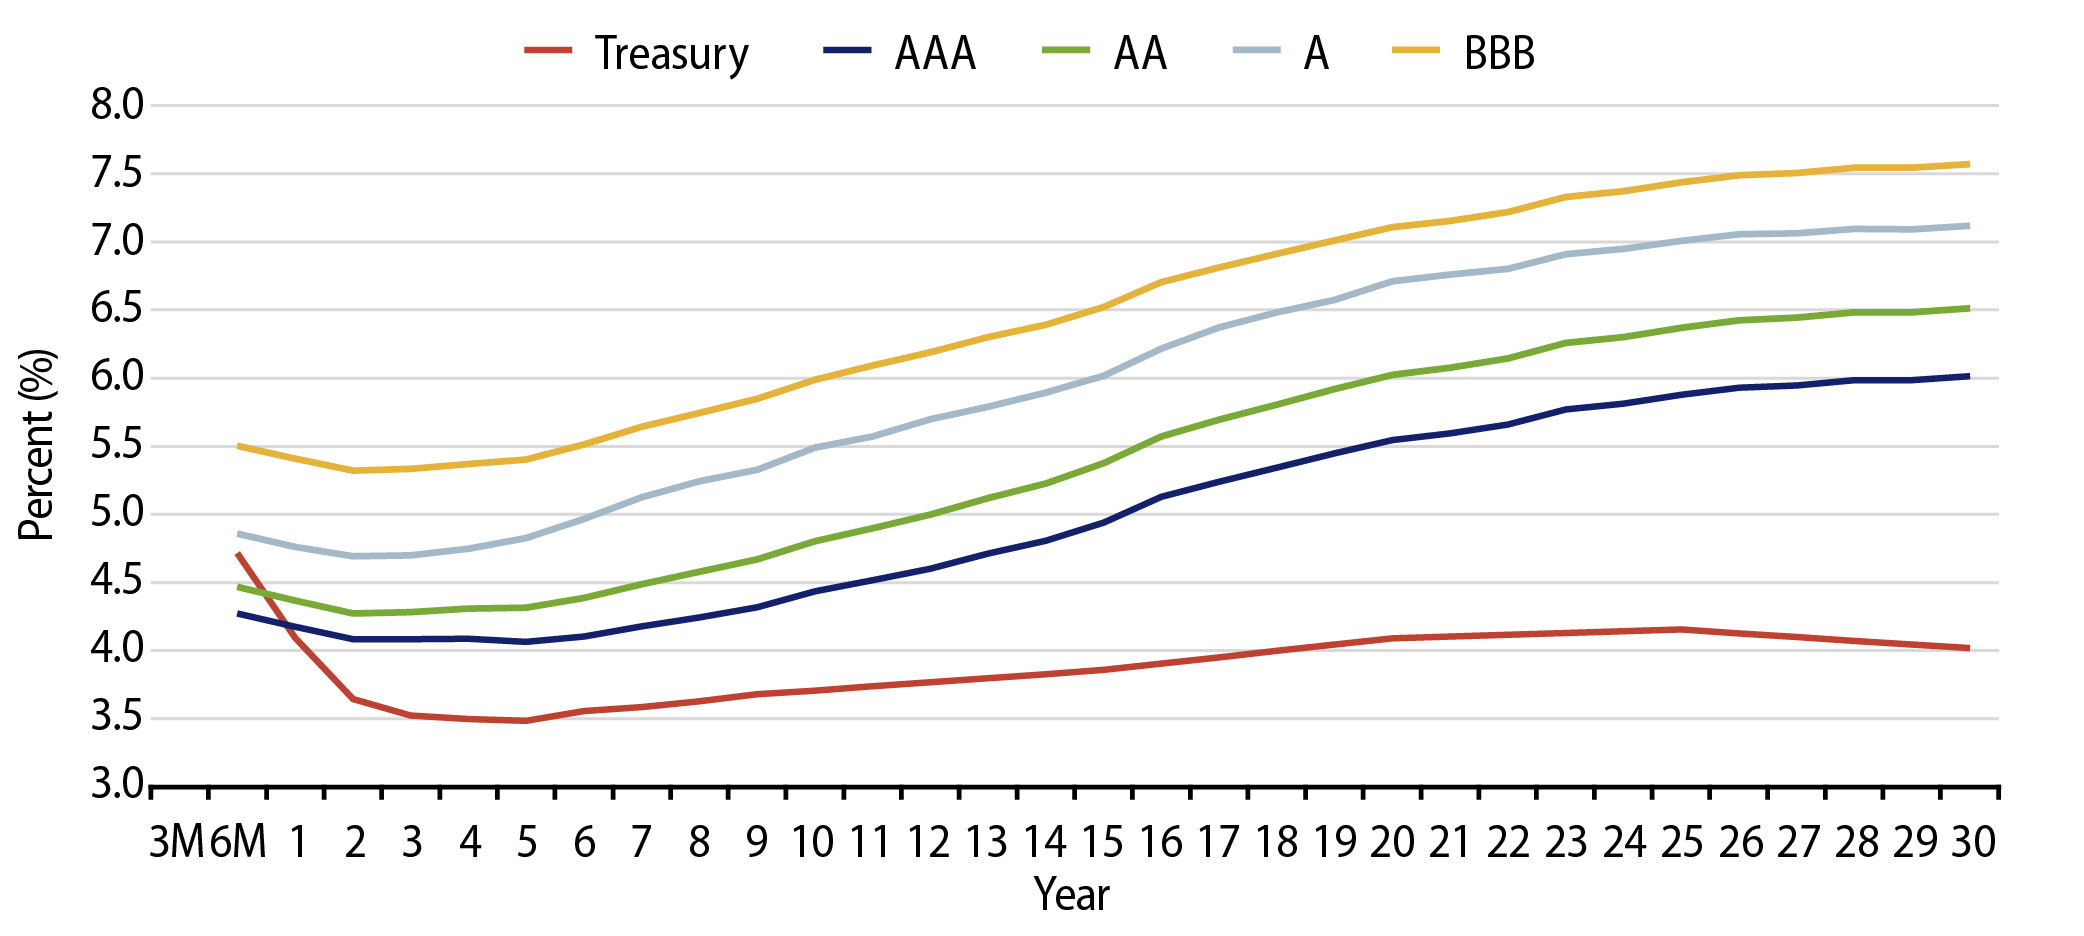
Municipal Credit Curves and Relative Value

Exhibit 4: Muni Credit Curves
Muni Credit Curves
Source: Bloomberg, Western Asset. As of 06 Sep 24. Bloomberg BVAL Municipal Credit Indices (AAA, AA, A, BBB, respectively) and US Sovereign Curves. Taxable-Equivalent Muni Credit Curves consider the top marginal effective tax rate of 40.8%. Select the image to expand the view.
Exhibit 5: Taxable-Equivalent Muni Credit Curves
Taxable-Equivalent Muni Credit Curves
Source: Bloomberg, Western Asset. As of 06 Sep 24. Bloomberg BVAL Municipal Credit Indices (AAA, AA, A, BBB, respectively) and US Sovereign Curves. Taxable-Equivalent Muni Credit Curves consider the top marginal effective tax rate of 40.8%. Select the image to expand the view.
Exhibit 6: AAA Munis vs. Treasuries
AAA Munis vs. Treasuries
Source: Muni Yields: Thomson Reuters MMD, Treasury Yields: Bloomberg. As of 06 Sep 24. Past performance is not a guarantee of future results. It is not possible to invest directly in an index. Select the image to expand the view.
Exhibit 7: Tax-Exempt and Taxable Muni Valuations
Tax-Exempt and Taxable Muni Valuations
Source: Bloomberg. Yield-to-worst (YTW) is the lowest potential yield that can be received on a bond without the issuer actually defaulting. As of 06 Sep 24. Select the image to expand the view.

Western Asset Key Themes for Muni Investors

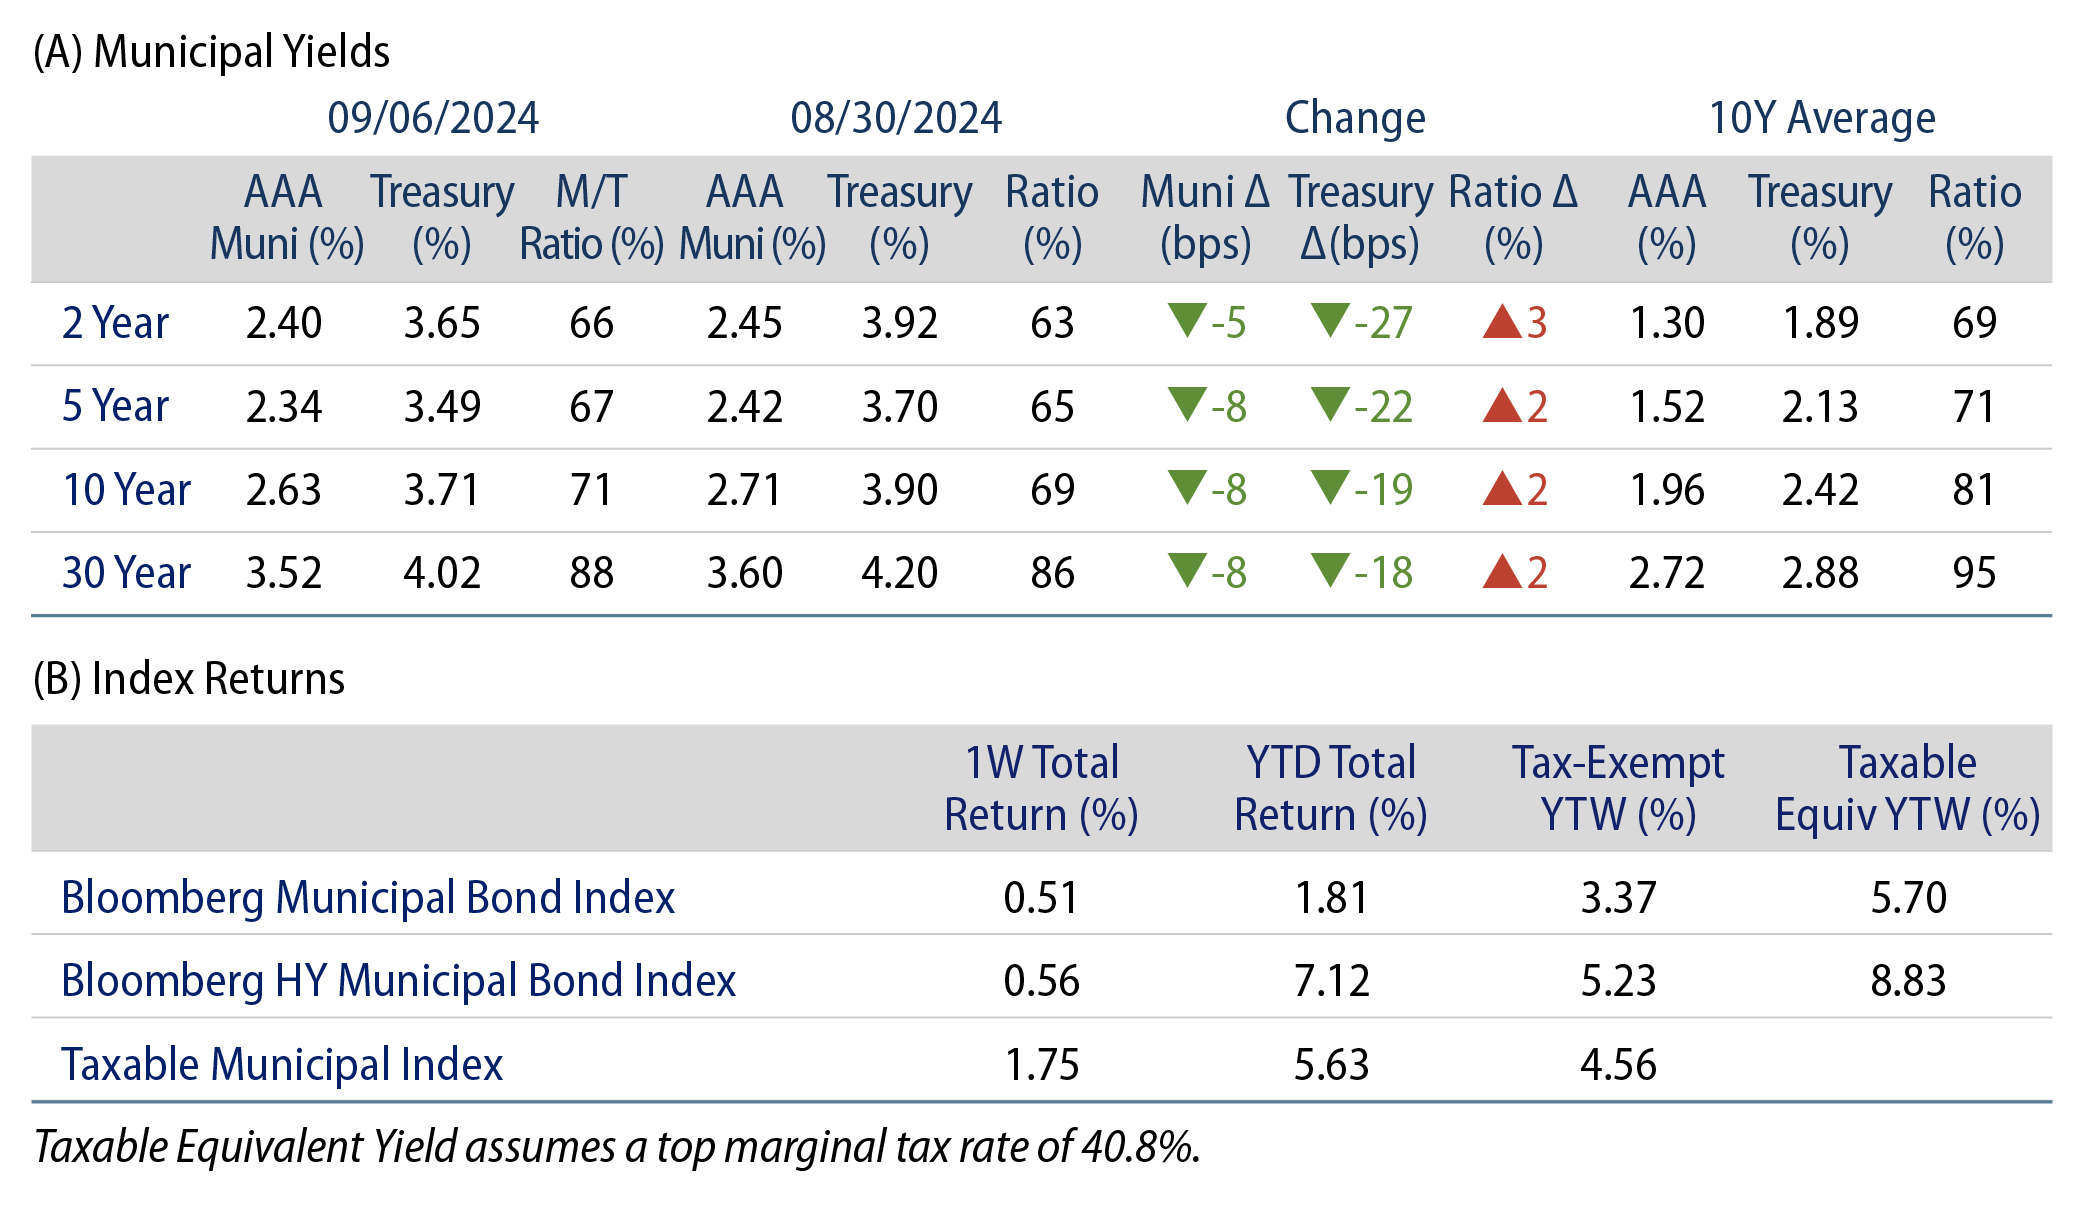
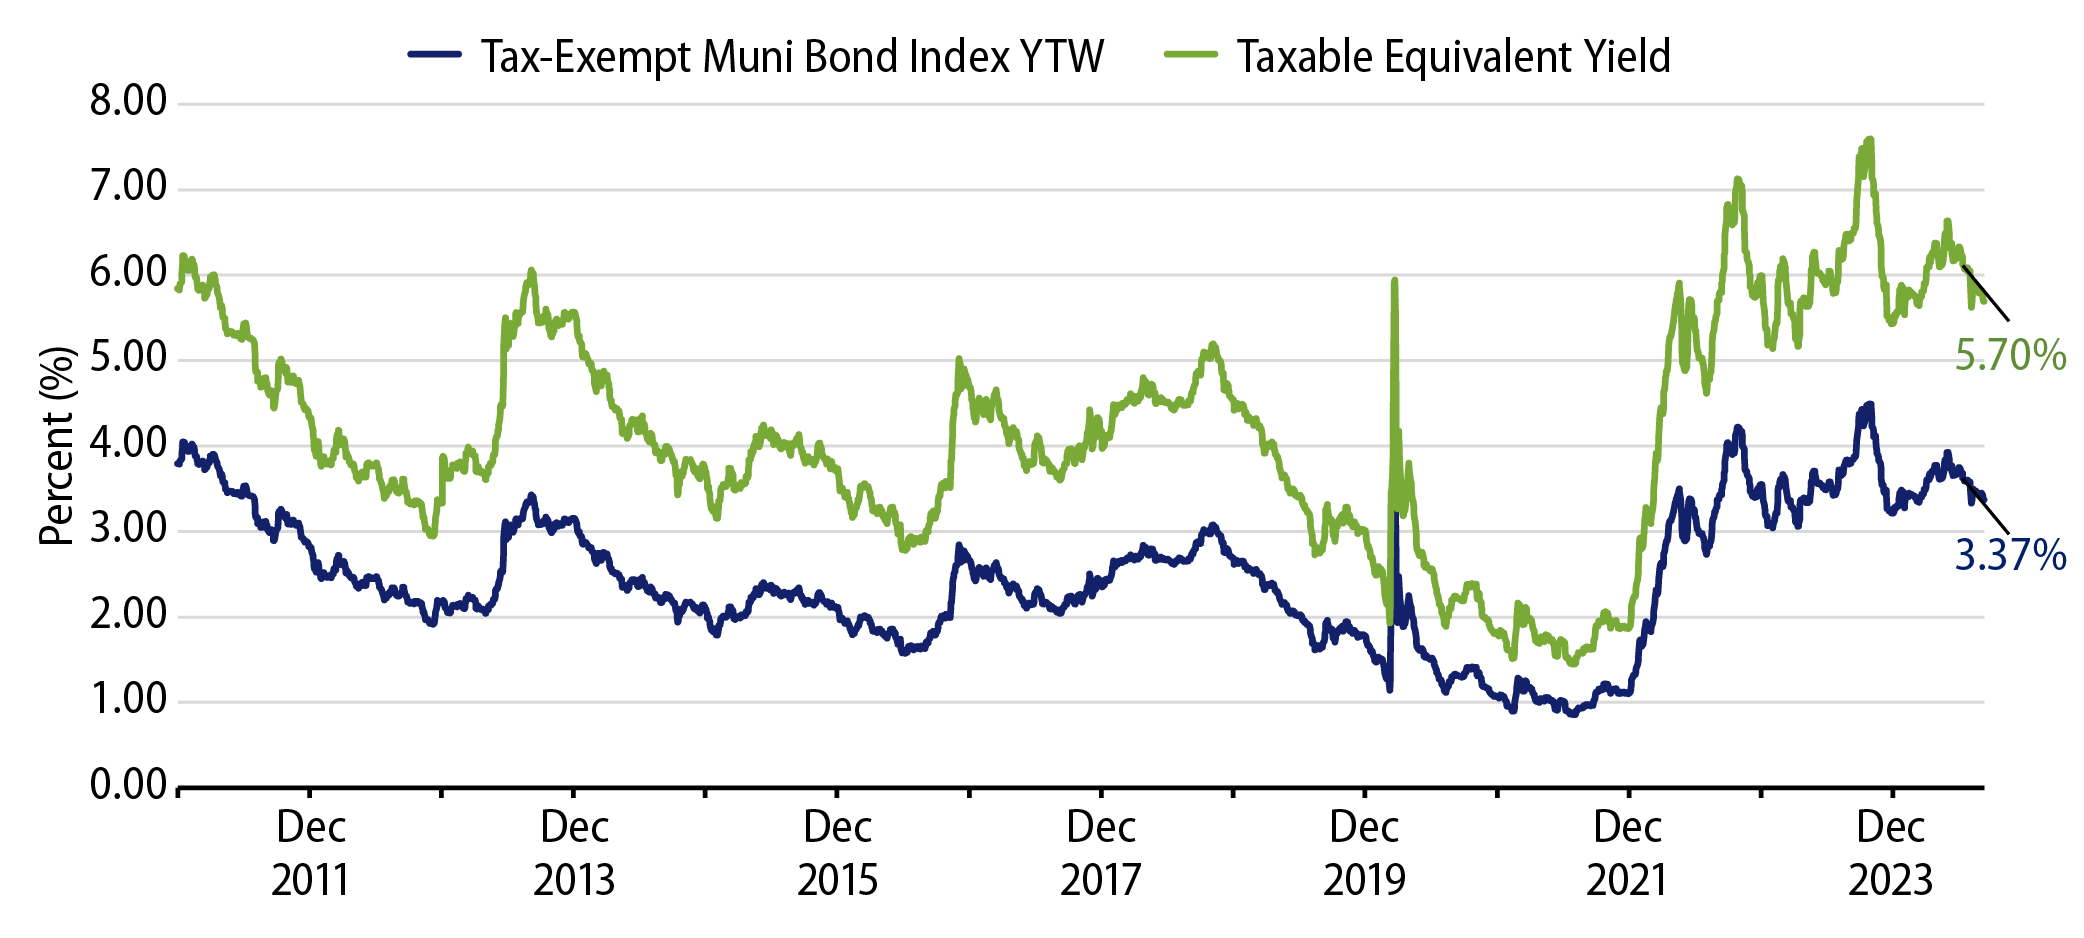
Theme #1: Municipal taxable-equivalent yields and income opportunities are above decade averages.

Exhibit 8: Muni and Taxable-Equivalent Muni Yield-to-Worst
Muni and Taxable-Equivalent Muni Yield-to-Worst
Source: Bloomberg, Western Asset. As of 06 Sep 24. Bloomberg Municipal Bond Index yield considering highest marginal tax rate of 40.8%. Indexes are unmanaged and one cannot directly invest in them. They do not include fees, expenses or sales charges. Past performance is not an indicator or a guarantee of future results. Select the image to expand the view.

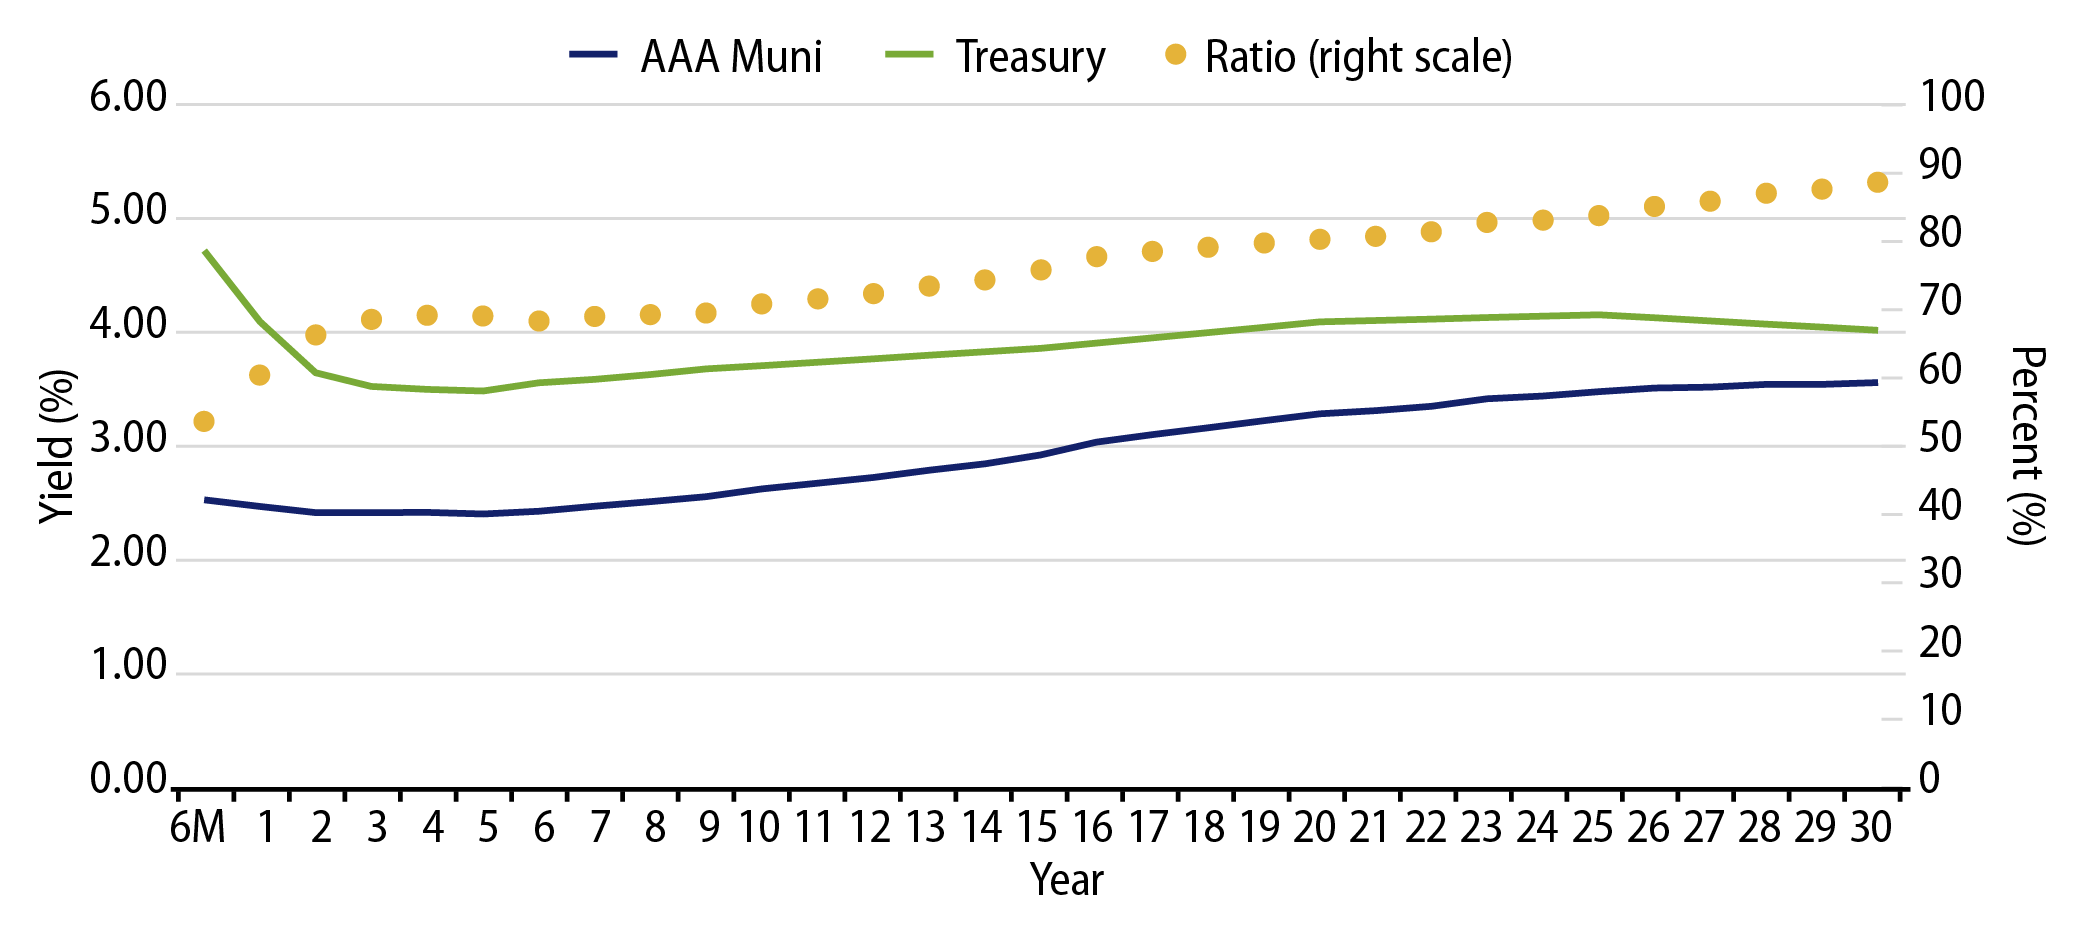
Theme #2: The muni yield curve has largely disinverted, offering potential value in extending maturities.

Exhibit 9: AAA Municipal vs. Treasury Yield Curves
AAA Municipal vs. Treasury Yield Curves
Source: Bloomberg, Western Asset. As of 06 Sep 24. Bloomberg Valuation Service (BVAL) AAA Muni Curve and US On-/Off-the-Run Sovereign Curve. Indexes are unmanaged and one cannot directly invest in them. They do not include fees, expenses or sales charges. Past performance is not an indicator or a guarantee of future results. Select the image to expand the view.

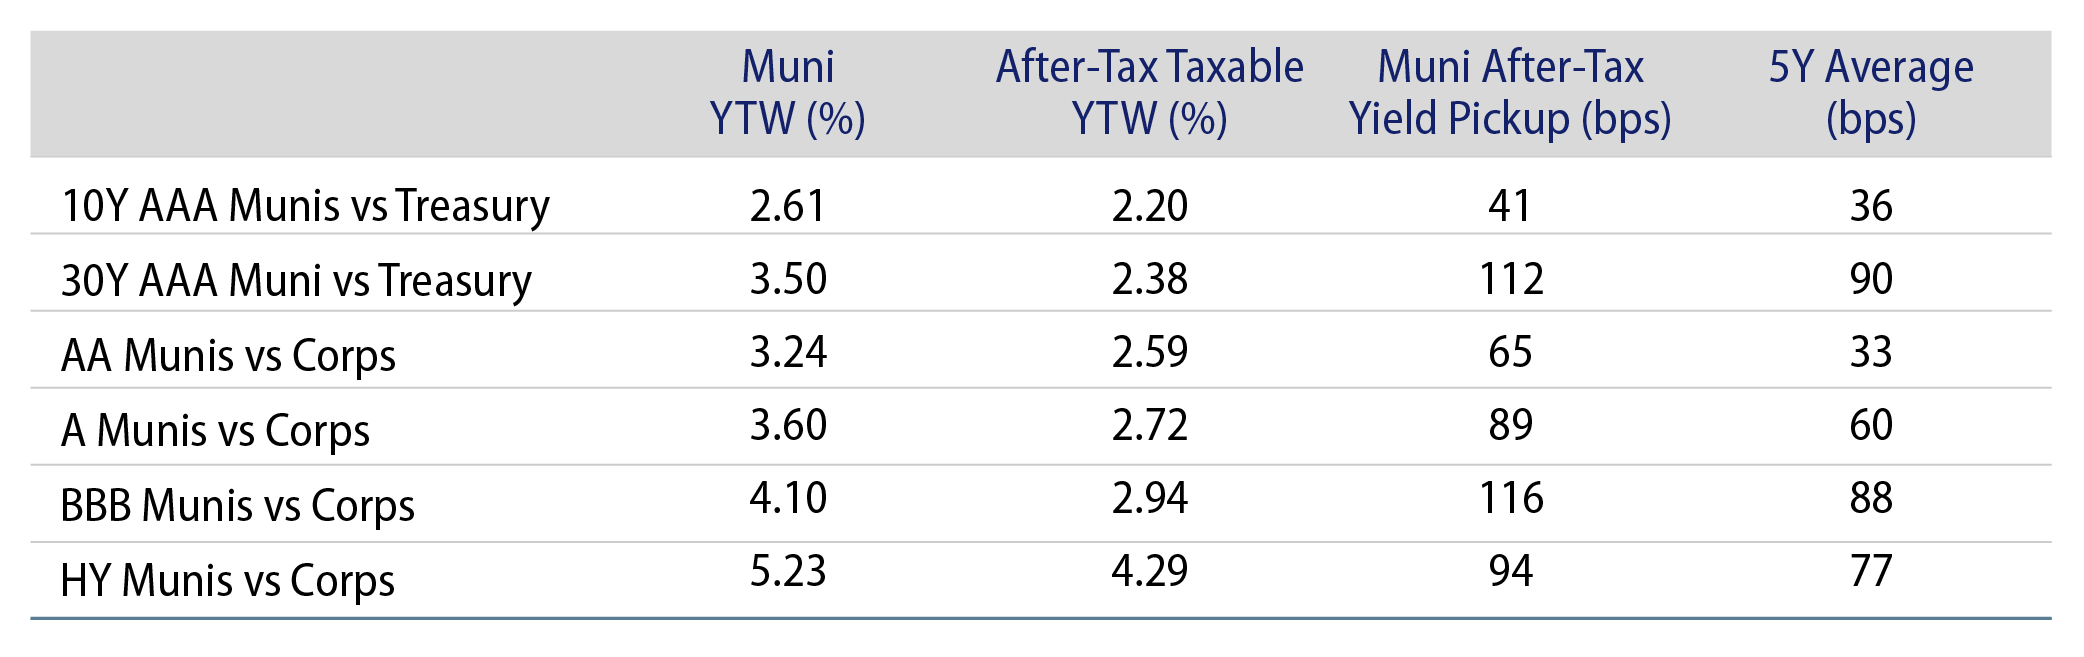
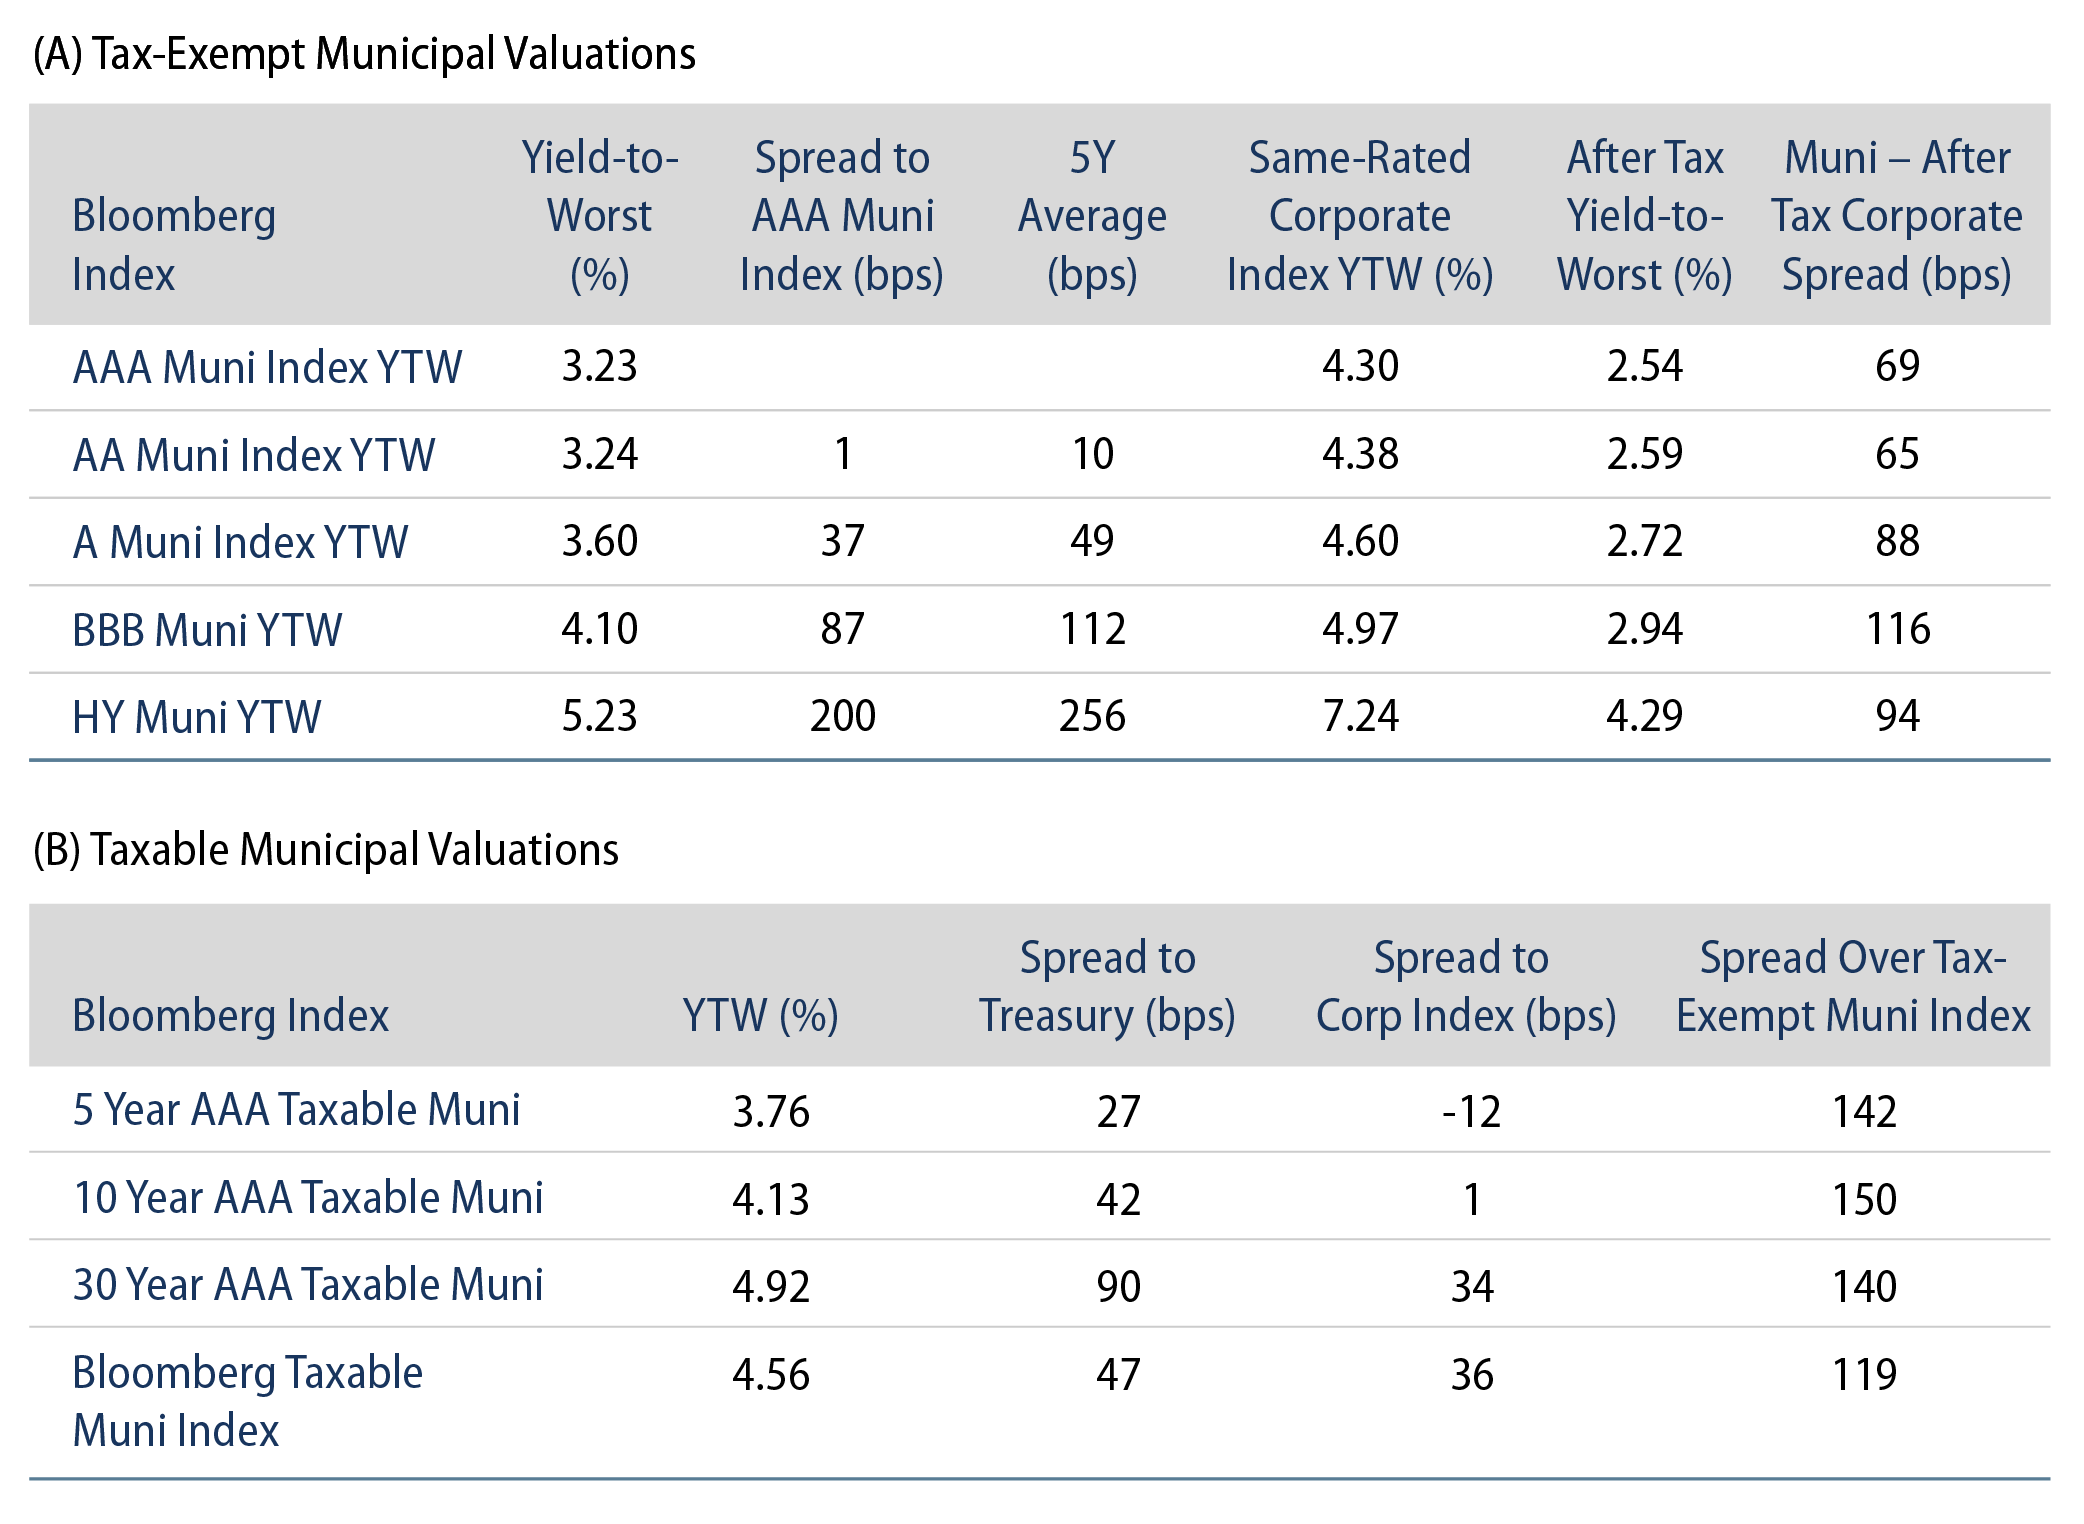
Theme #3: Munis offer attractive after-tax yield pickup versus longer-dated Treasuries and investment-grade corporate credit.

Exhibit 10: Municipal vs. Taxable Fixed-Income Yields by Quality
Municipal vs. Taxable Fixed-Income Yields by Quality
Source: Western Asset, Bloomberg. As 06 Sep 24. 10- and 30-Year comparison reflects Bloomberg Valuation Service (BVAL) AAA Muni Curve and US On-/Off-the-Run Sovereign Curve. AA Muni reflects the Bloomberg AA Muni Bond Index. A Muni reflects the Bloomberg A Muni Bond Index. BBB Muni reflects the Bloomberg BBB Muni Bond Index. HY Muni reflects the Bloomberg High Yield Muni Bond Index. AA Corp reflects the Bloomberg AA Corporate Bond Index. A Corp reflects the Bloomberg A Corporate Bond Index. BBB Corp reflects the Bloomberg BBB Corporate Bond Index. After-tax yield considers top marginal tax rate of 40.8%. Indexes are unmanaged and one cannot directly invest in them. They do not include fees, expenses or sales charges. Past performance is not an indicator or a guarantee of future results. Select the image to expand the view.

© Western Asset Management Company, LLC 2025. The information contained in these materials ("the materials") is intended for the exclusive use of the designated recipient ("the recipient"). This information is proprietary and confidential and may contain commercially sensitive information, and may not be copied, reproduced or republished, in whole or in part, without the prior written consent of Western Asset Management Company ("Western Asset").
Past performance does not predict future returns. These materials should not be deemed to be a prediction or projection of future performance. These materials are intended for investment professionals including professional clients, eligible counterparties, and qualified investors only.
These materials have been produced for illustrative and informational purposes only. These materials contain Western Asset's opinions and beliefs as of the date designated on the materials; these views are subject to change and may not reflect real-time market developments and investment views.
Third party data may be used throughout the materials, and this data is believed to be accurate to the best of Western Asset's knowledge at the time of publication, but cannot be guaranteed. These materials may also contain strategy or product awards or rankings from independent third parties or industry publications which are based on unbiased quantitative and/or qualitative information determined independently by each third party or publication. In some cases, Western Asset may subscribe to these third party's standard industry services or publications. These standard subscriptions and services are available to all asset managers and do not influence rankings or awards in any way.
Investment strategies or products discussed herein may involve a high degree of risk, including the loss of some or all capital. Investments in any products or strategies described in these materials may be volatile, and investors should have the financial ability and willingness to accept such risks.
Unless otherwise noted, investment performance contained in these materials is reflective of a strategy composite. All other strategy data and information included in these materials reflects a representative portfolio which is an account in the composite that Western Asset believes most closely reflects the current portfolio management style of the strategy. Performance is not a consideration in the selection of the representative portfolio. The characteristics of the representative portfolio shown may differ from other accounts in the composite. Information regarding the representative portfolio and the other accounts in the composite are available upon request. Statements in these materials should not be considered investment advice. References, either general or specific, to securities and/or issuers in the materials are for illustrative purposes only and are not intended to be, and should not be interpreted as, recommendation to purchase or sell such securities. Employees and/or clients of Western Asset may have a position in the securities or issuers mentioned.
These materials are not intended to provide, and should not be relied on for, accounting, legal, tax, investment or other advice. The recipient should consult its own counsel, accountant, investment, tax, and any other advisers for this advice, including economic risks and merits, related to making an investment with Western Asset. The recipient is responsible for observing the applicable laws and regulations of their country of residence.
Founded in 1971, Western Asset Management Company is a global fixed-income investment manager with offices in Pasadena, New York, London, Singapore, Tokyo, Melbourne, São Paulo, Hong Kong, and Zürich. Western Asset is a wholly owned subsidiary of Franklin Resources, Inc. but operates autonomously. Western Asset is comprised of six legal entities across the globe, each with distinct regional registrations: Western Asset Management Company, LLC, a registered Investment Adviser with the Securities and Exchange Commission; Western Asset Management Company Ltda. is regulated by Comissão de Valores Mobiliários; Western Asset Management Company Pty Ltd ABN 41 117 767 923 is the holder of the Australian Financial Services License 303160; Western Asset Management Company Pte. Ltd. Co. Reg. No. 200007692R is a holder of a Capital Markets Services License for fund management and regulated by the Monetary Authority of Singapore; Western Asset Management Company Ltd, a registered Financial Instruments Business Operator and regulated by the Financial Services Agency of Japan; and Western Asset Management Company Limited is authorised and regulated by the Financial Conduct Authority ("FCA") (FRN 145930). This communication is intended for distribution to Professional Clients only if deemed to be a financial promotion in the UK as defined by the FCA. This communication may also be intended for certain EEA countries where Western Asset has been granted permission to do so. For the current list of the approved EEA countries please contact Western Asset at +44 (0)20 7422 3000.