skip navigation
Western Asset Management Company
Blog

Stay up to date on timely topics and market events. Subscribe to our Blog now.

MARKETS
December 02, 2025

Weekly Municipal Monitor—Record Supply Year

By Sam Weitzman

Stay up to date on timely topics and market events. Subscribe to our Blog now.

Macros, Markets and Munis

Municipals posted positive returns last week. The weaker-than-anticipated economic data led Treasuries lower during the week. The high-grade muni curve generally underperformed, just moving lower in shorter maturities. Muni technicals were supported by ongoing demand amid a holiday-shortened supply calendar, and economic data releases continued to rebound following the end of the government shutdown. Retail sales were lower than expected, while core Producer Price Index (PPI), which excludes food and energy, and consumer confidence data also came in below expectations. This week we break down the key drivers of the record issuance year.

Demand Remained Steady as Supply Was Limited in the Holiday Week

Fund Flows ($682 million of net inflows): During the week ending November 26, weekly reporting municipal mutual funds recorded $682 million of net inflows, according to Lipper. Long-term funds recorded $124 million of inflows, Intermediate funds recorded $341 million of inflows and the Short Term category recorded $142 million of inflows. Last week’s inflows led year-to-date (YTD) inflows higher to $47 billion.

Supply (YTD supply of $548 billion; up 16% YoY): The muni market recorded $3.5 billion of new issue supply last week, limited by the Thanksgiving holiday. YTD new issue supply of $548 billion is 16% higher from the prior year, with tax-exempt issuance up 17% year-over-year (YoY) and taxable issuance up 1% YoY. This week’s calendar is expected to pick back up to $15 billion. The largest deals include the $1.6 billion State of Connecticut and $1.0 billion New York Utility Debt Securitization transactions.

This Week in Munis: Record Supply Year

Muni supply reached $548 billion through the first eleven months of 2025, surpassing the previous calendar record of $500 billion set in 2024 and putting the market on pace to approach $600 billion by year-end. This year’s elevated issuance reflects a rebound from the muted supply environment of 2022–23, when inflation and interest-rate volatility constrained borrowing. It also reflects policy-related uncertainty, which accelerated issuance among certain sectors looking to secure market access ahead of potential changes.

Exhibit 1: Municipal Supply
Municipal Supply
Source: Bloomberg, Western Asset. As of DD MM 25. Select the image to expand the view.

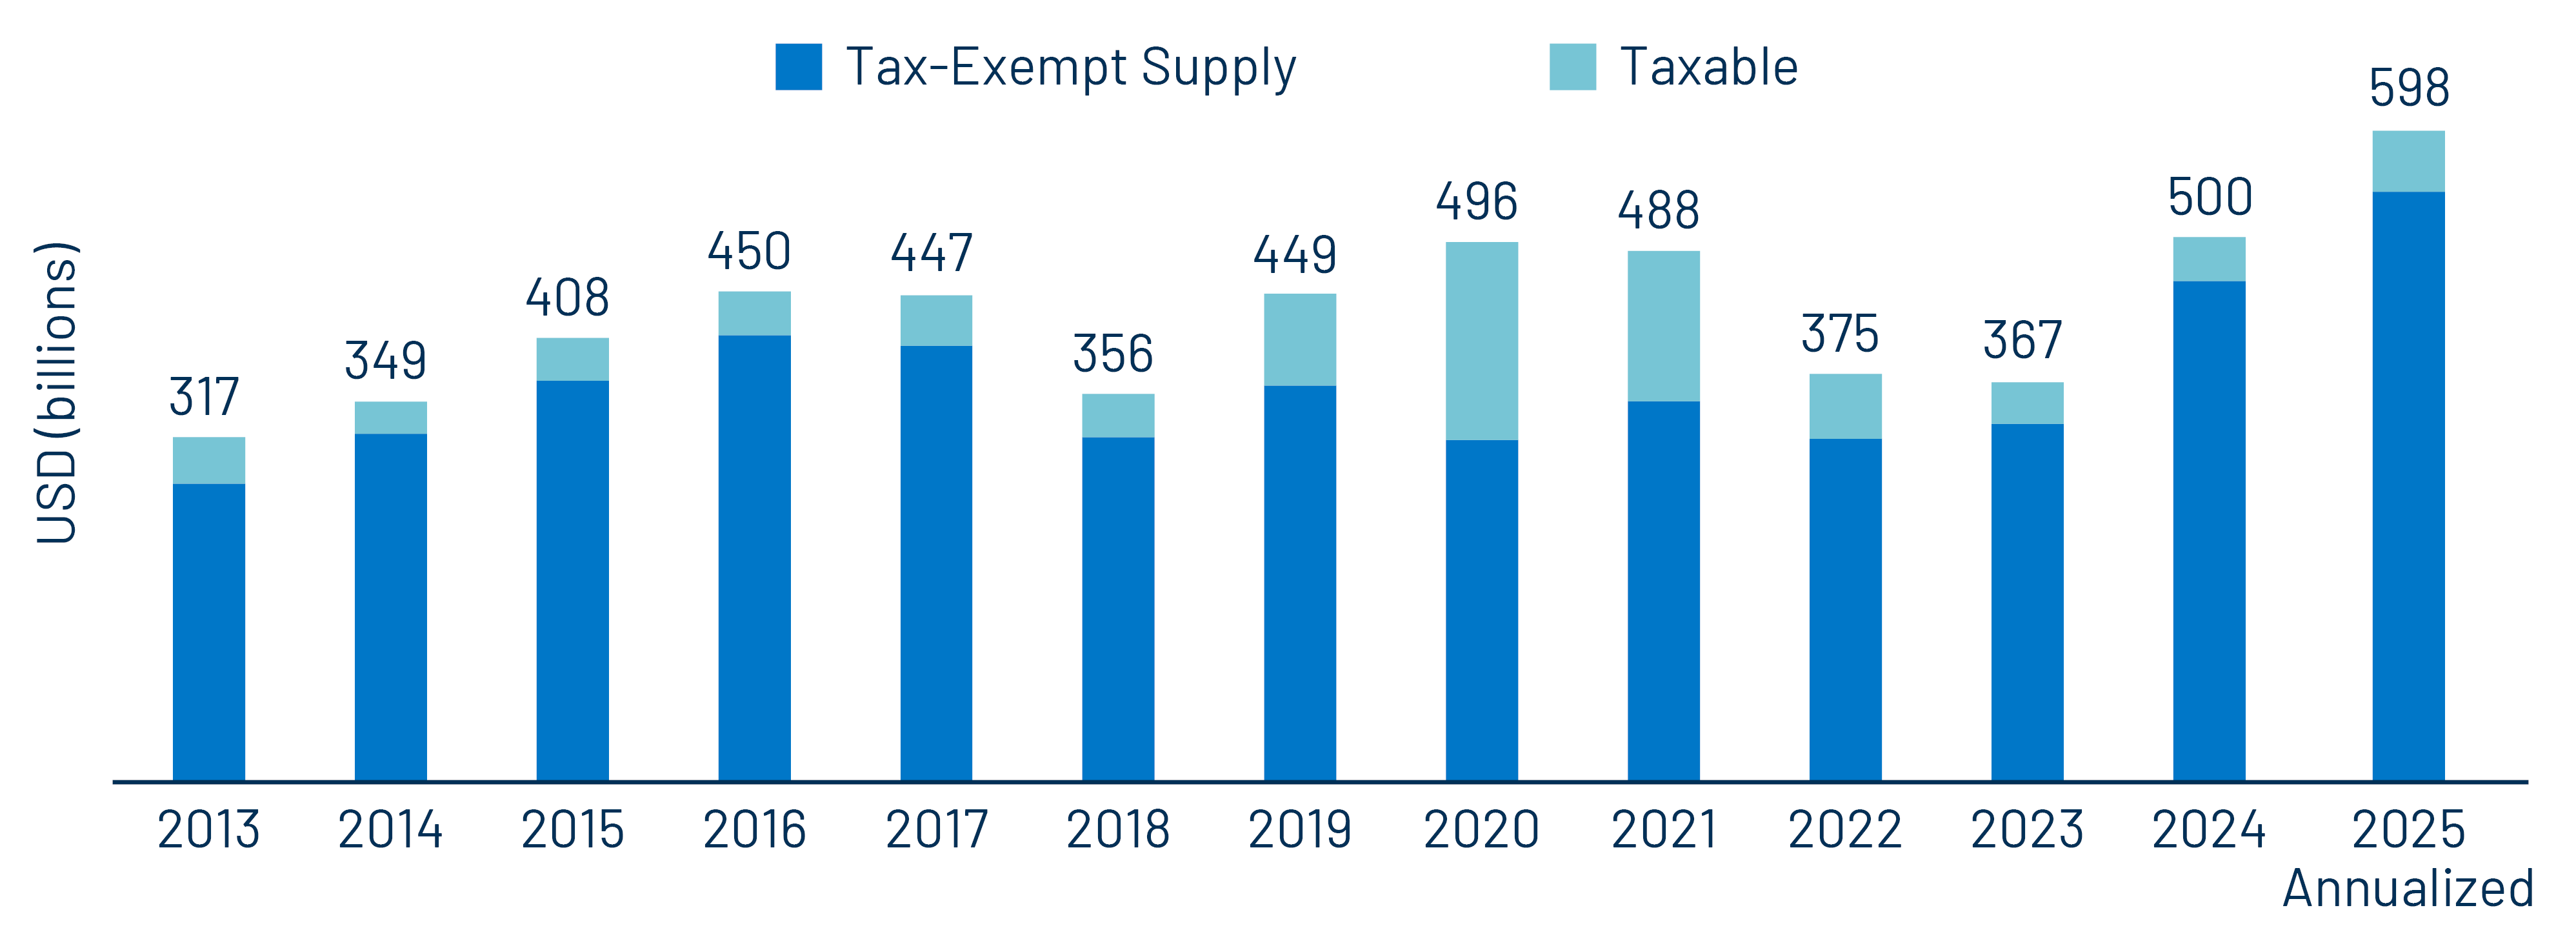
Tax Exempt vs. Taxable Issuance
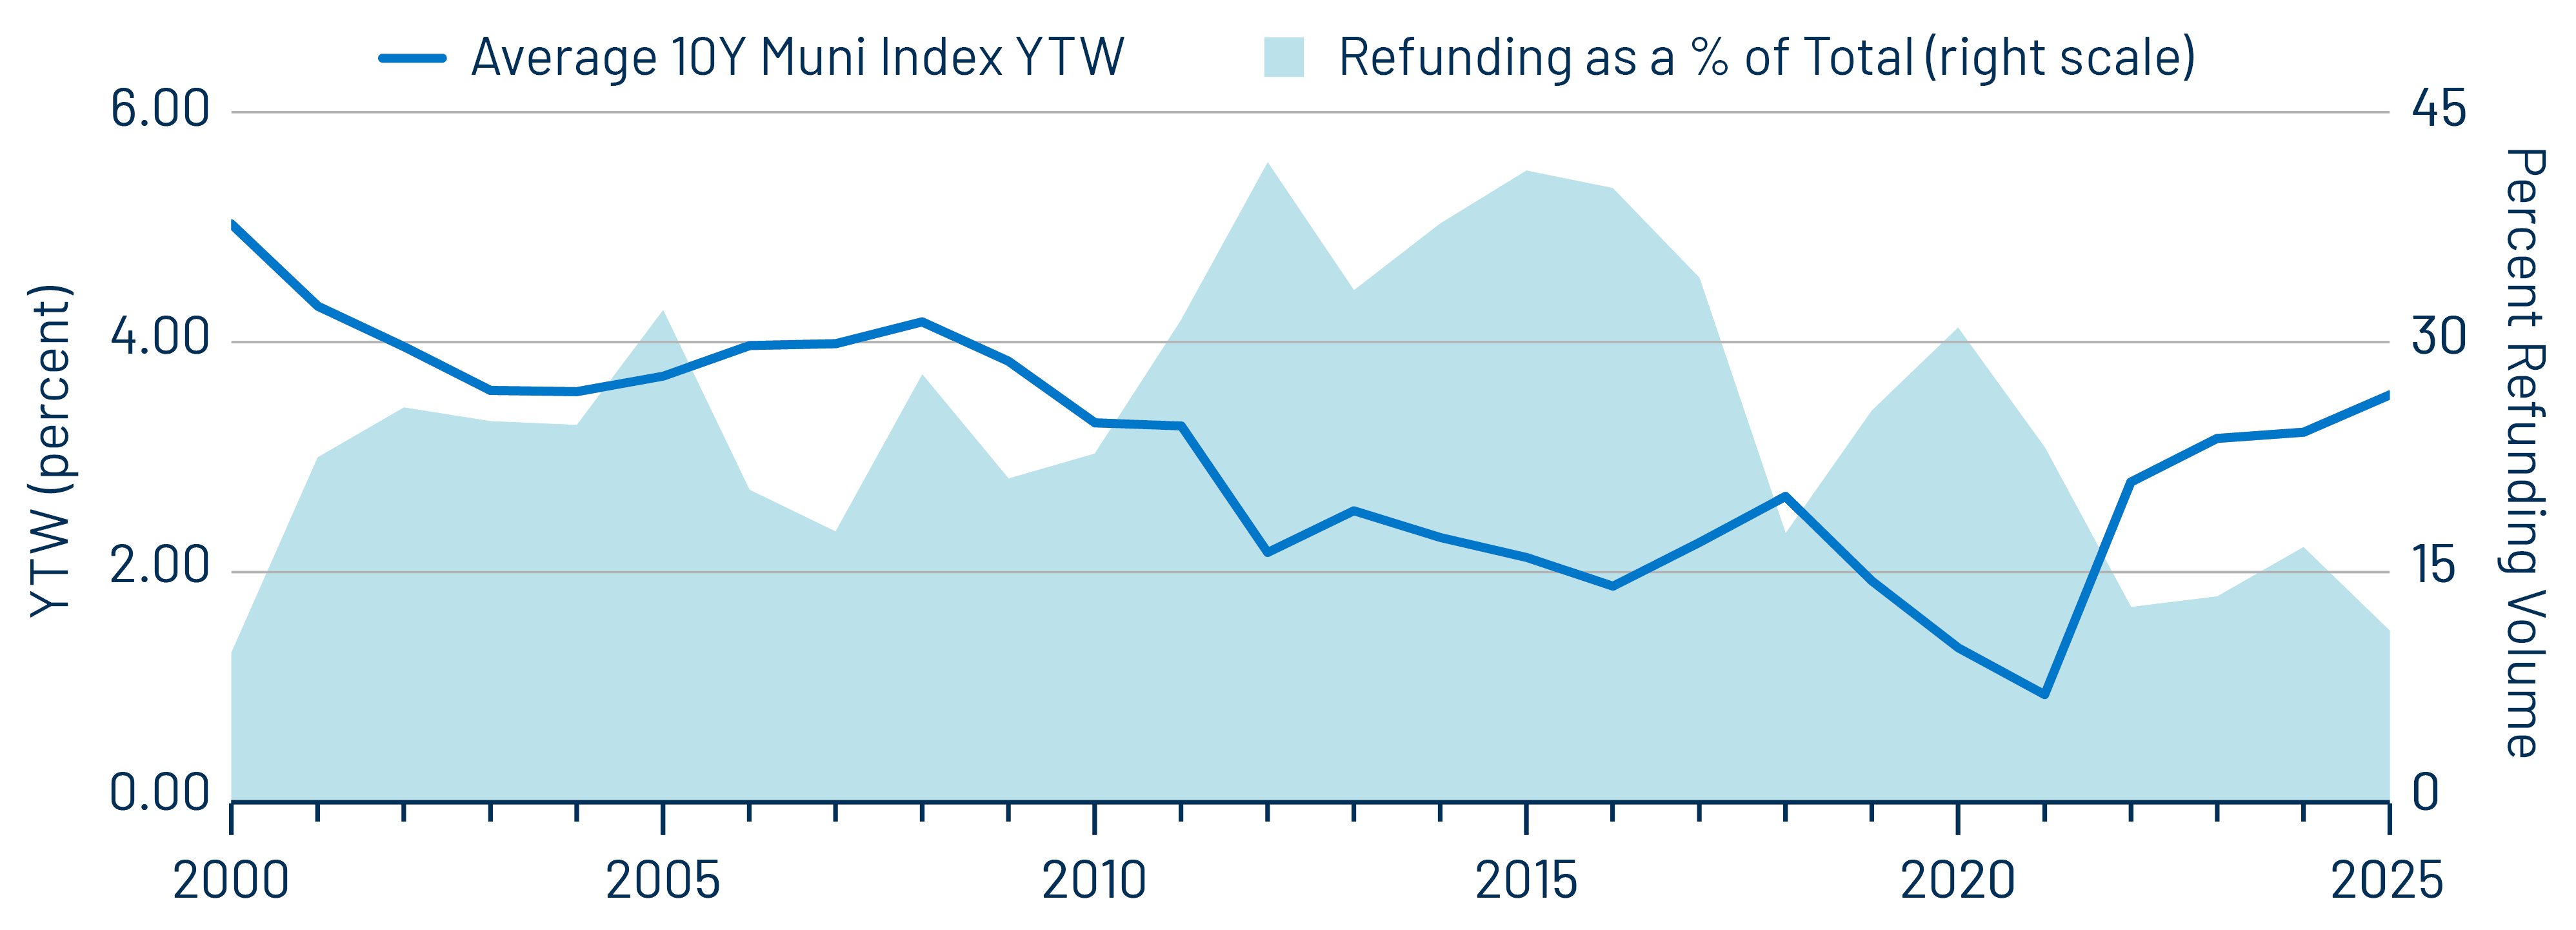
YTD tax-exempt issuance of $497 billion was 17% higher than a year ago and is on pace to exceed the prior ten-year average by 27%, according to Bloomberg. The increase in volume has been driven primarily by higher new-money issuance, which accounted for 74% of total supply, per The Bond Buyer, while refunding activity has remained below ten-year norms in the current higher-rate environment. Taxable issuance totaled $51 billion YTD and is on pace to increase 38% YoY, though it remains well below the prior ten-year average, a period that included the post-TCJA spike in taxable refinancing, when issuers found more attractive economics in refinancing debt in the taxable market.
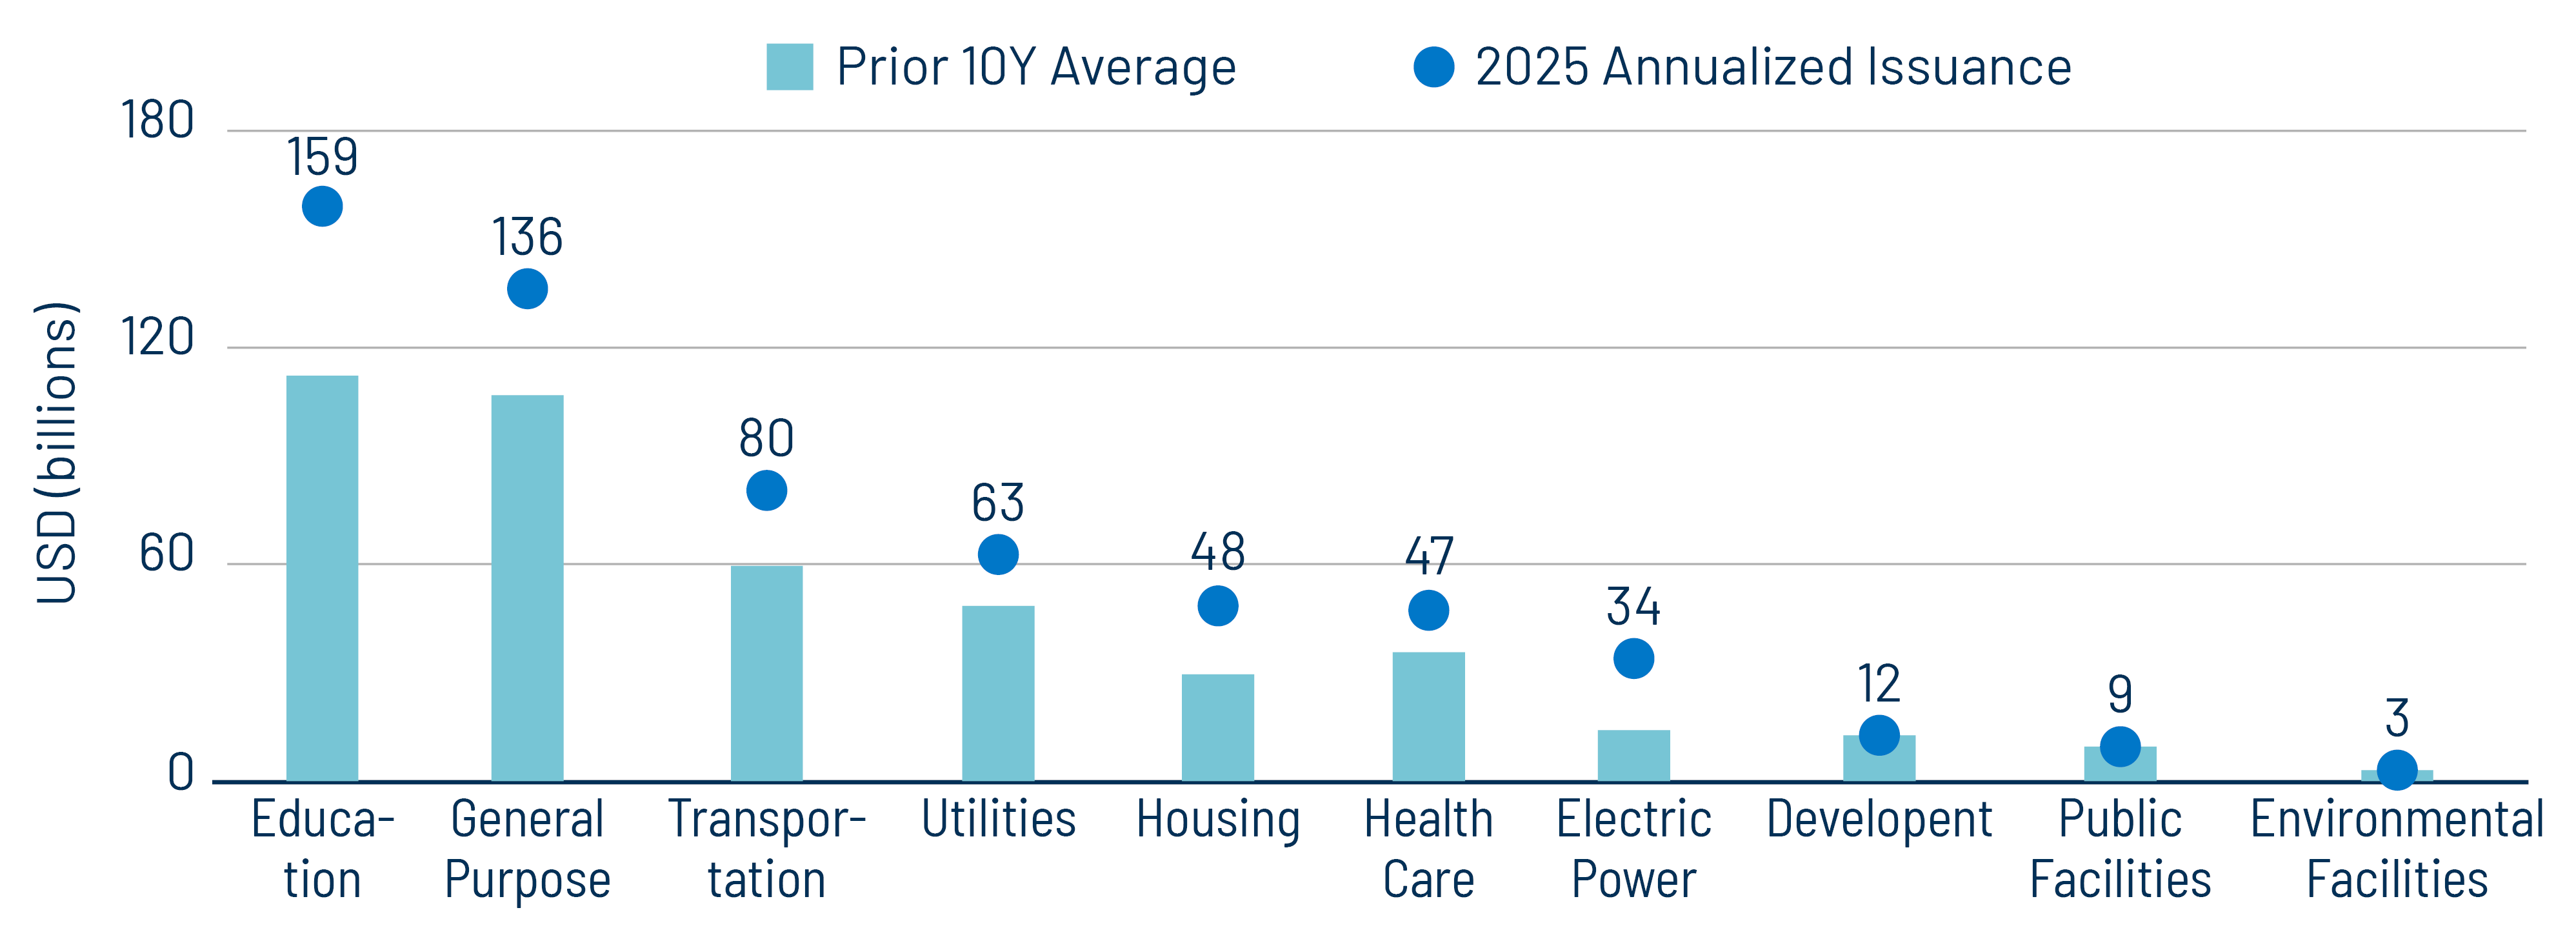
Exhibit 2: At Higher Interest Rates, Refunding (Refinancing) Issuance Declined
At Higher Interest Rates, Refunding (Refinancing) Issuance Declined
Source: Western Asset, Average Bloomberg 10Y Municipal Bond Index YTW by Year, Bond Buyer. As of 31 Oct 25. Select the image to expand the view.

Issuance by Sector
Muni issuance has run well above ten-year averages across purpose sectors, according to Bond Buyer data through October. Notably, the Education sector’s issuance was the largest among sectors and stood 42% above its ten-year average, driven in part by early-year concerns about the sustainability of tax-exempt status.

Exhibit 3: Issuance by Sector
Issuance by Sector
Source: Western Asset, Bond Buyer. As of 31 Oct 25. Select the image to expand the view.

Elevated supply levels this year have contributed to municipal underperformance relative to other asset classes but also improved after-tax relative value for investors in higher tax brackets. While Western Asset expects that ongoing interest rate volatility and uncertainty around future policy changes could keep issuance elevated through the remainder of 2025 and into 2026, we also anticipate that market demand will better absorb this supply as cash deposit yields drift lower alongside expected additional Federal Reserve rate cuts. Given the attractive after-tax relative value versus other fixed-income sectors, we expect munis to capture a meaningful share of this potential demand.

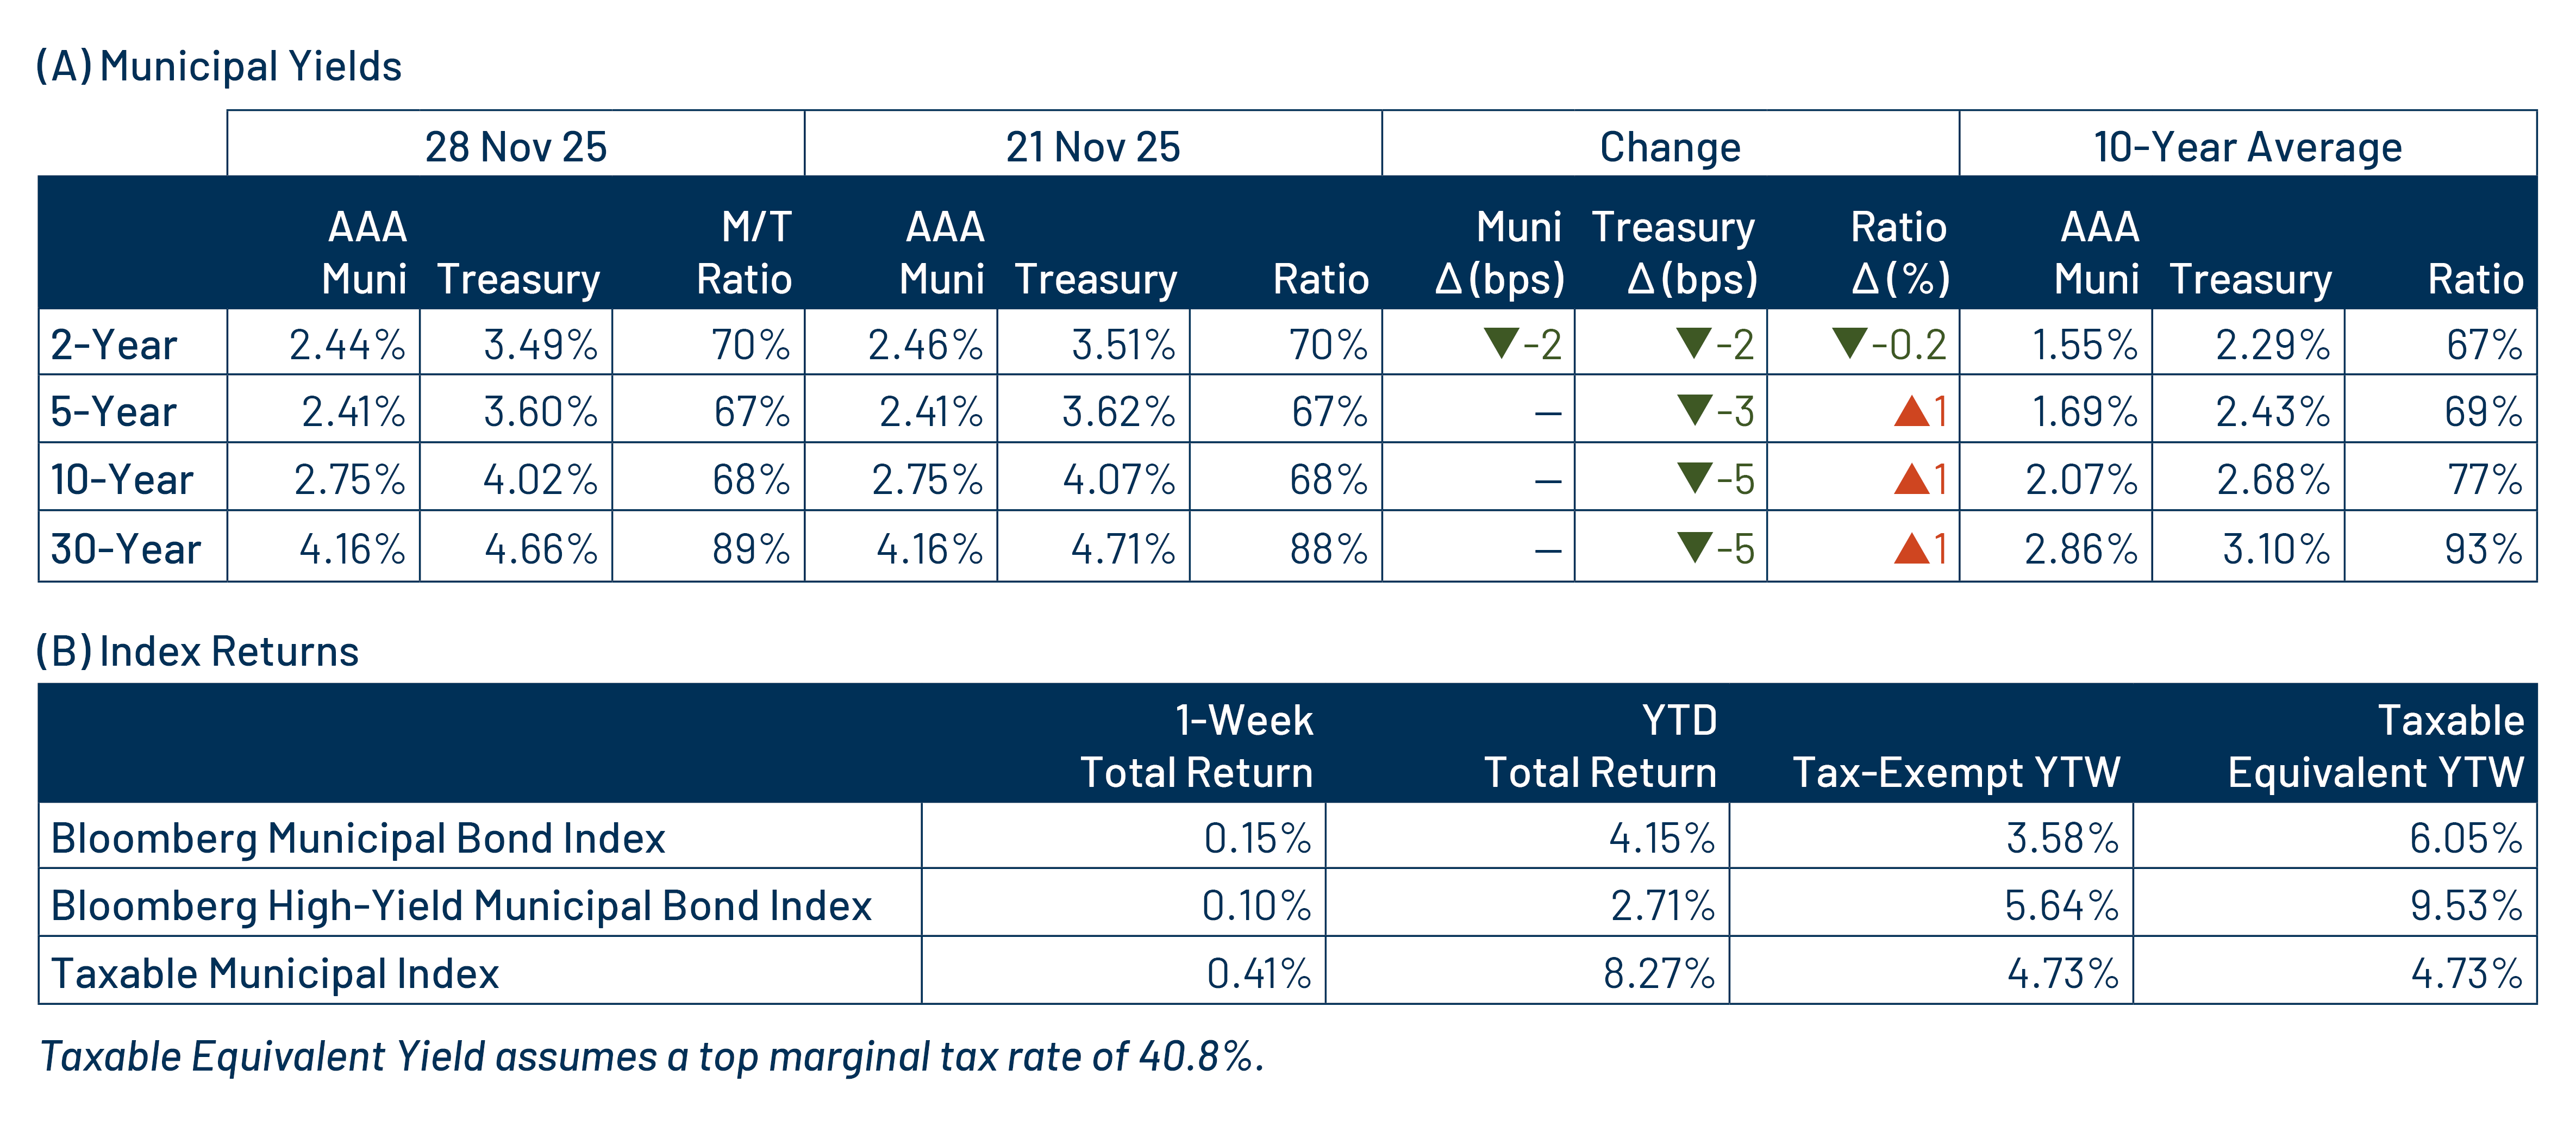
Municipal Credit Curves and Relative Value

Exhibit 4: Muni Credit Curves
Muni Credit Curves
Source: Bloomberg, Western Asset. As of 28 Nov 25. Bloomberg Valuation Service (BVAL) Municipal Credit Indices (AAA, AA, A, BBB, respectively) and US Sovereign Curves. Taxable-Equivalent Muni Credit Curves consider the top marginal effective tax rate of 40.8%. AA Muni is represented by the US General Obligation AA Muni BVAL Yield Curve. The BVAL curve is populated with pricing from uninsured AA General Obligation bonds. A Muni is represented by the US General Obligation A Muni BVAL Yield Curve. The BVAL curve is populated with pricing from uninsured A General Obligation bonds. BBB Muni is represented by the US General Obligation BBB Muni BVAL Yield Curve. The BVAL curve is populated with pricing from uninsured BBB General Obligation bonds. Indices are unmanaged and one cannot directly invest in them. They do not include fees, expenses or sales charges. Past performance is not an indicator or a guarantee of future results. Select the image to expand the view.
Exhibit 5: Taxable-Equivalent Muni Credit Curves
Taxable-Equivalent Muni Credit Curves
Source: Bloomberg, Western Asset. As of 28 Nov 25. Bloomberg Valuation Service (BVAL) Municipal Credit Indices (AAA, AA, A, BBB, respectively) and US Sovereign Curves. Taxable-Equivalent Muni Credit Curves consider the top marginal effective tax rate of 40.8%. AA Muni is represented by the US General Obligation AA Muni BVAL Yield Curve. The BVAL curve is populated with pricing from uninsured AA General Obligation bonds. A Muni is represented by the US General Obligation A Muni BVAL Yield Curve. The BVAL curve is populated with pricing from uninsured A General Obligation bonds. BBB Muni is represented by the US General Obligation BBB Muni BVAL Yield Curve. The BVAL curve is populated with pricing from uninsured BBB General Obligation bonds. Indices are unmanaged and one cannot directly invest in them. They do not include fees, expenses or sales charges. Past performance is not an indicator or a guarantee of future results. Select the image to expand the view.
Exhibit 6: AAA Munis vs. Treasuries
AAA Munis vs. Treasuries
Source: Muni Yields: Thomson Reuters MMD, Treasury Yields: Bloomberg. As of 28 Nov 25. Past performance is not a guarantee of future results. It is not possible to invest directly in an index. Select the image to expand the view.
Exhibit 7: Tax-Exempt and Taxable Muni Valuations
Tax-Exempt and Taxable Muni Valuations
Source: Bloomberg, Western Asset. As of 28 Nov 25. Yield-to-worst (YTW) is the lowest potential yield that can be received on a bond without the issuer actually defaulting. AAA, AA, A, BBB Corporate Indices; After-Tax Yield assumes a top effective tax rate of 40.8%. Taxable Muni Index Corporate comparable used is the Global Corporate Aggregate (ex. BBB) to better align credit quality and duration. Select the image to expand the view.

Western Asset Key Themes for Muni Investors

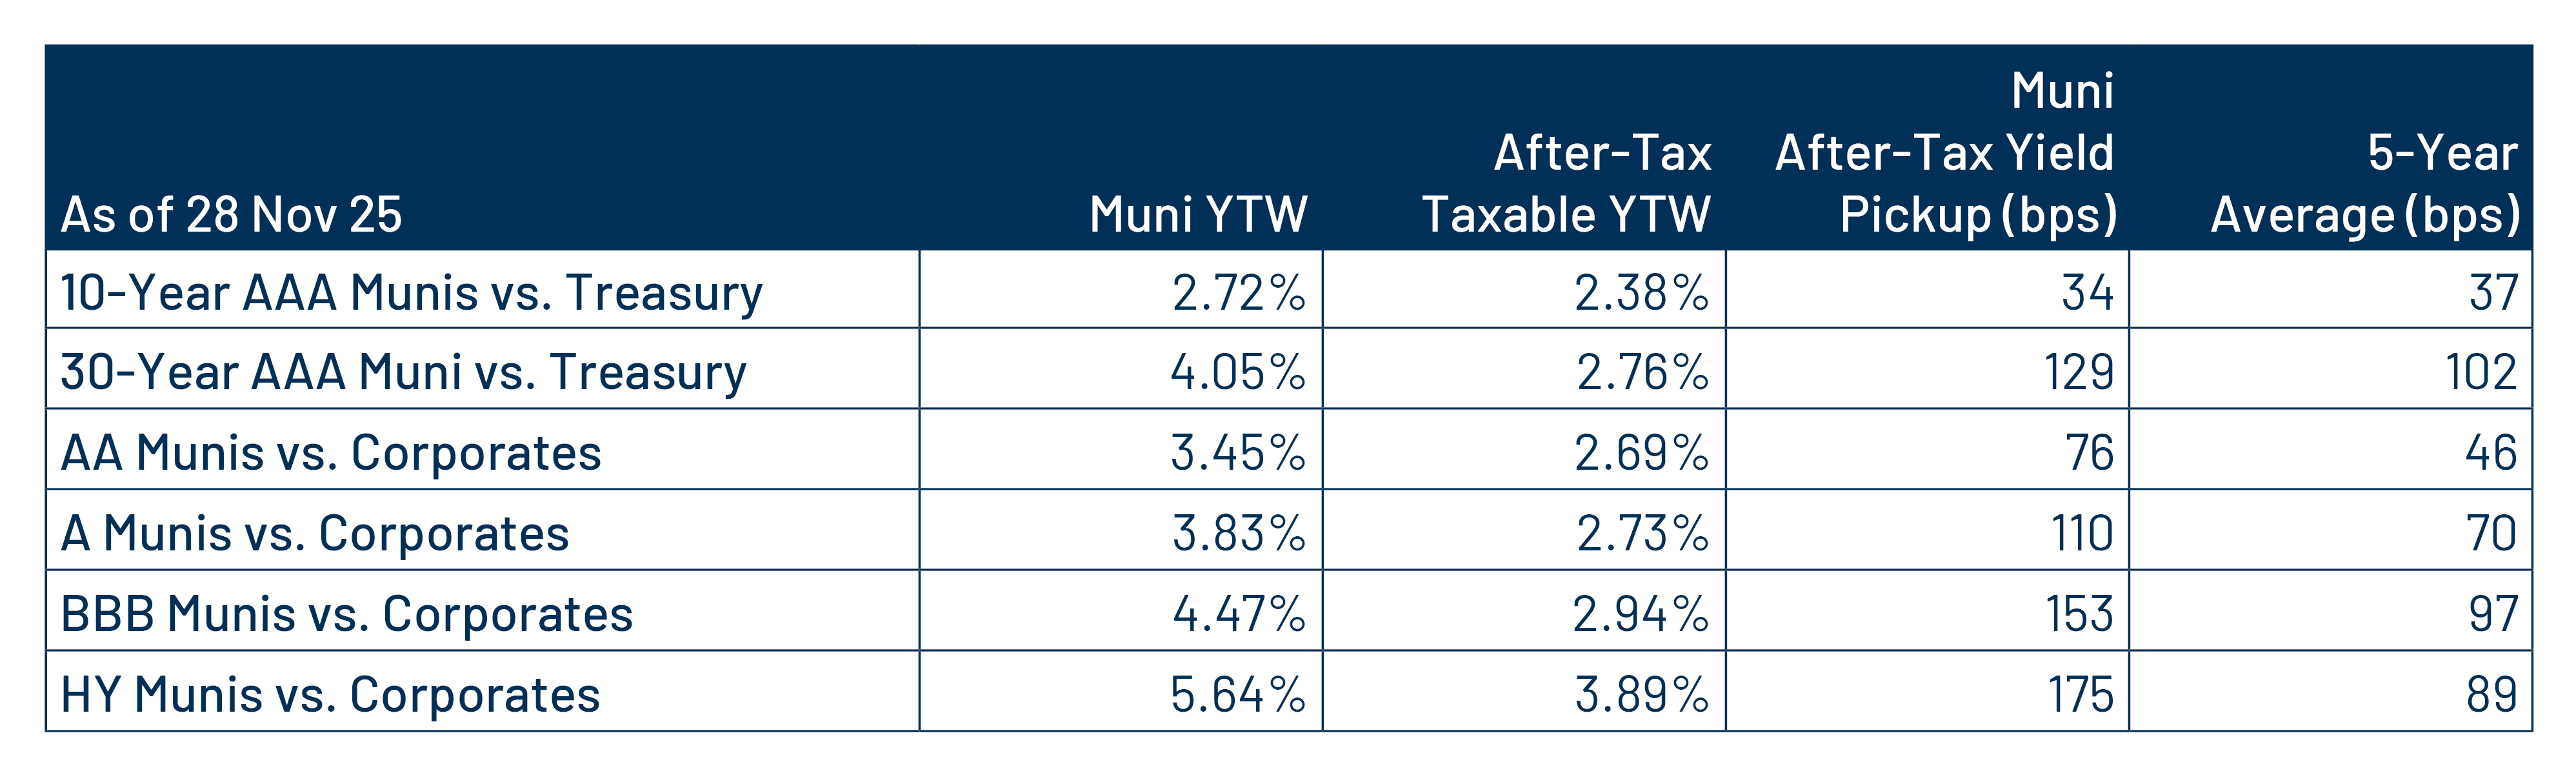
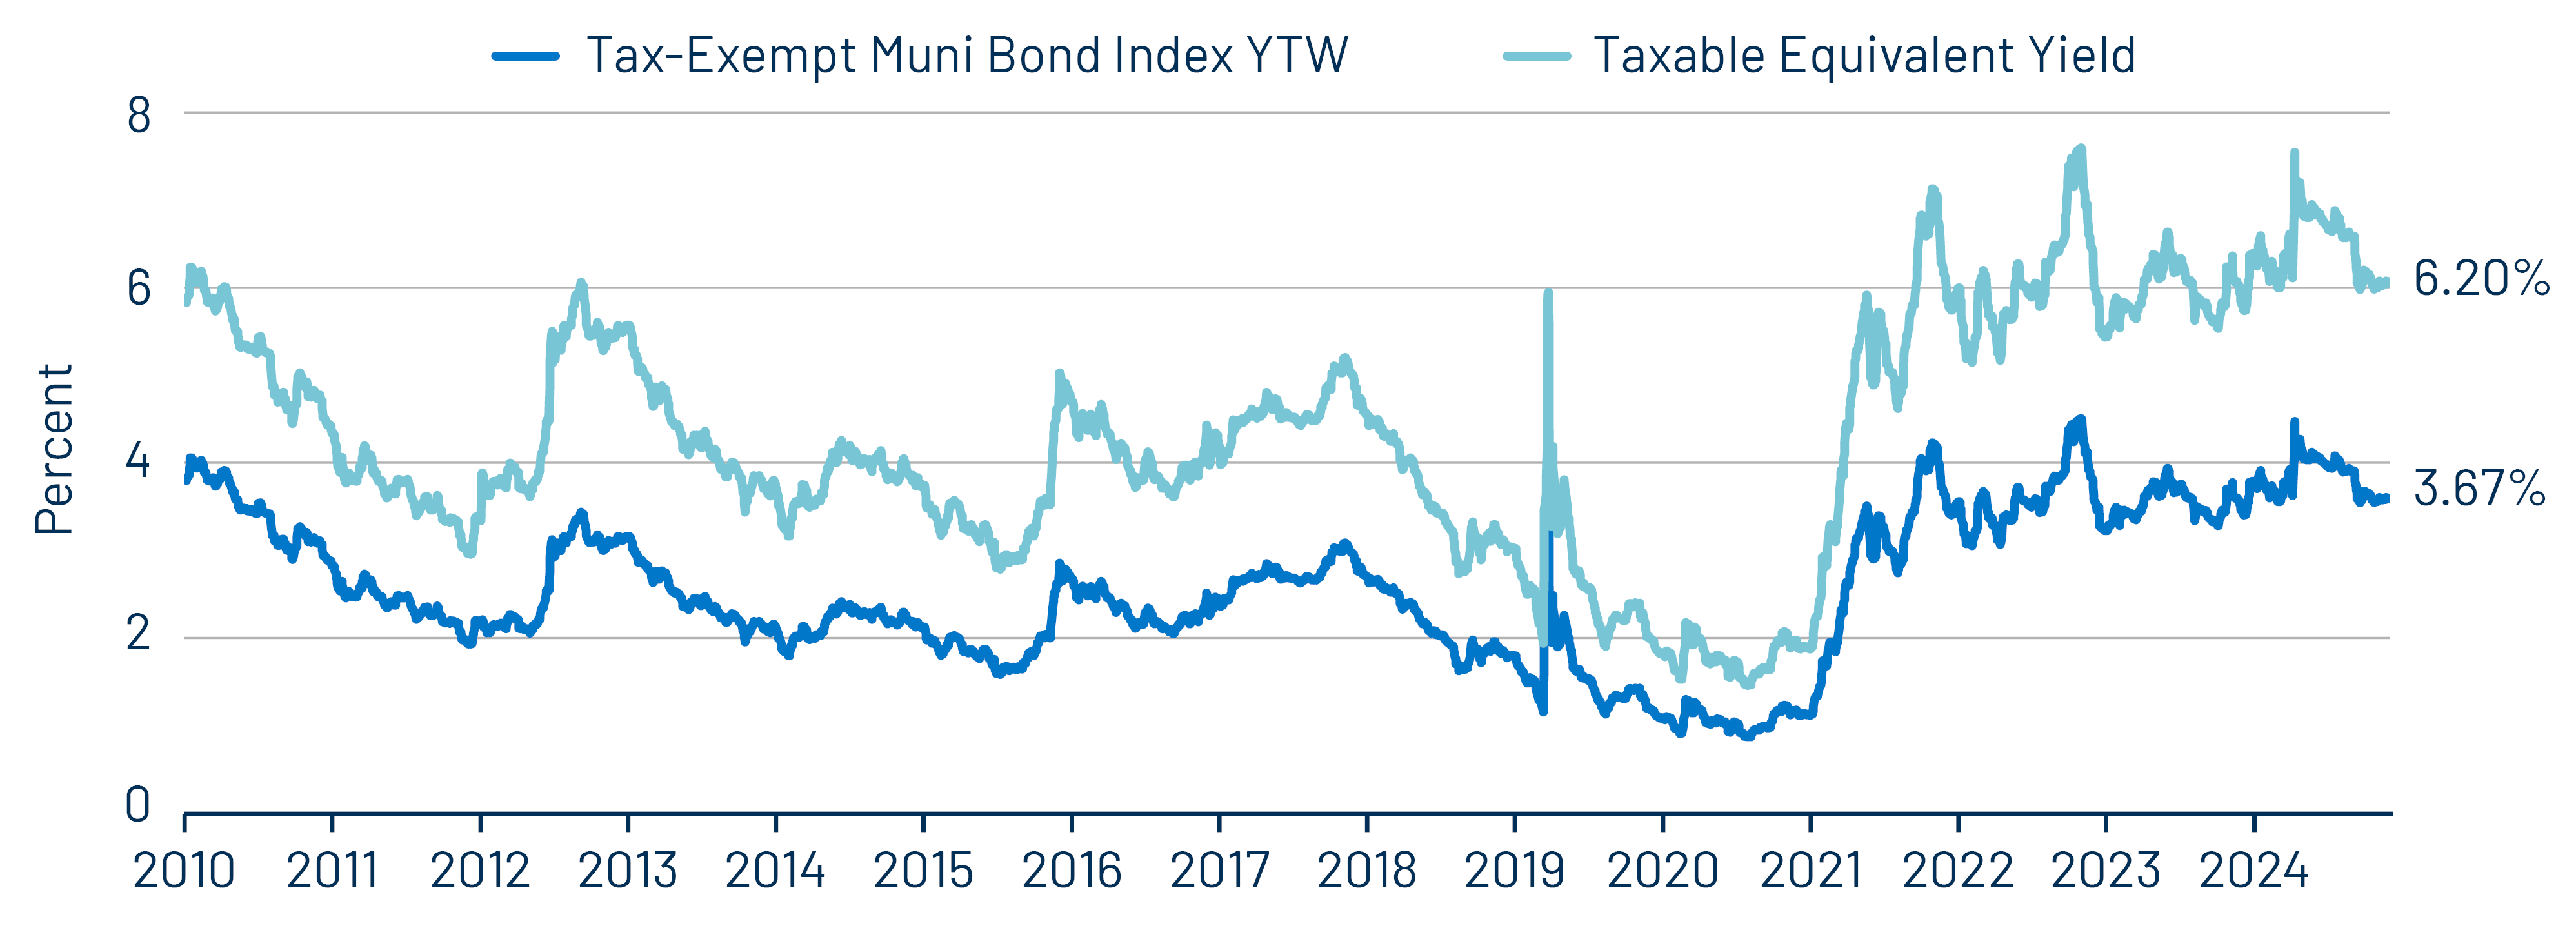
Theme #1: Municipal taxable-equivalent yields and income opportunities remain near decade-high levels.

Exhibit 8: Muni and Taxable-Equivalent Muni Yield-to-Worst
Muni and Taxable-Equivalent Muni Yield-to-Worst
Source: Bloomberg, Western Asset. As of 28 Nov 25. Bloomberg Municipal Bond Index yield considering highest marginal tax rate of 40.8%. Indexes are unmanaged and one cannot directly invest in them. They do not include fees, expenses or sales charges. Past performance is not an indicator or a guarantee of future results. Select the image to expand the view.

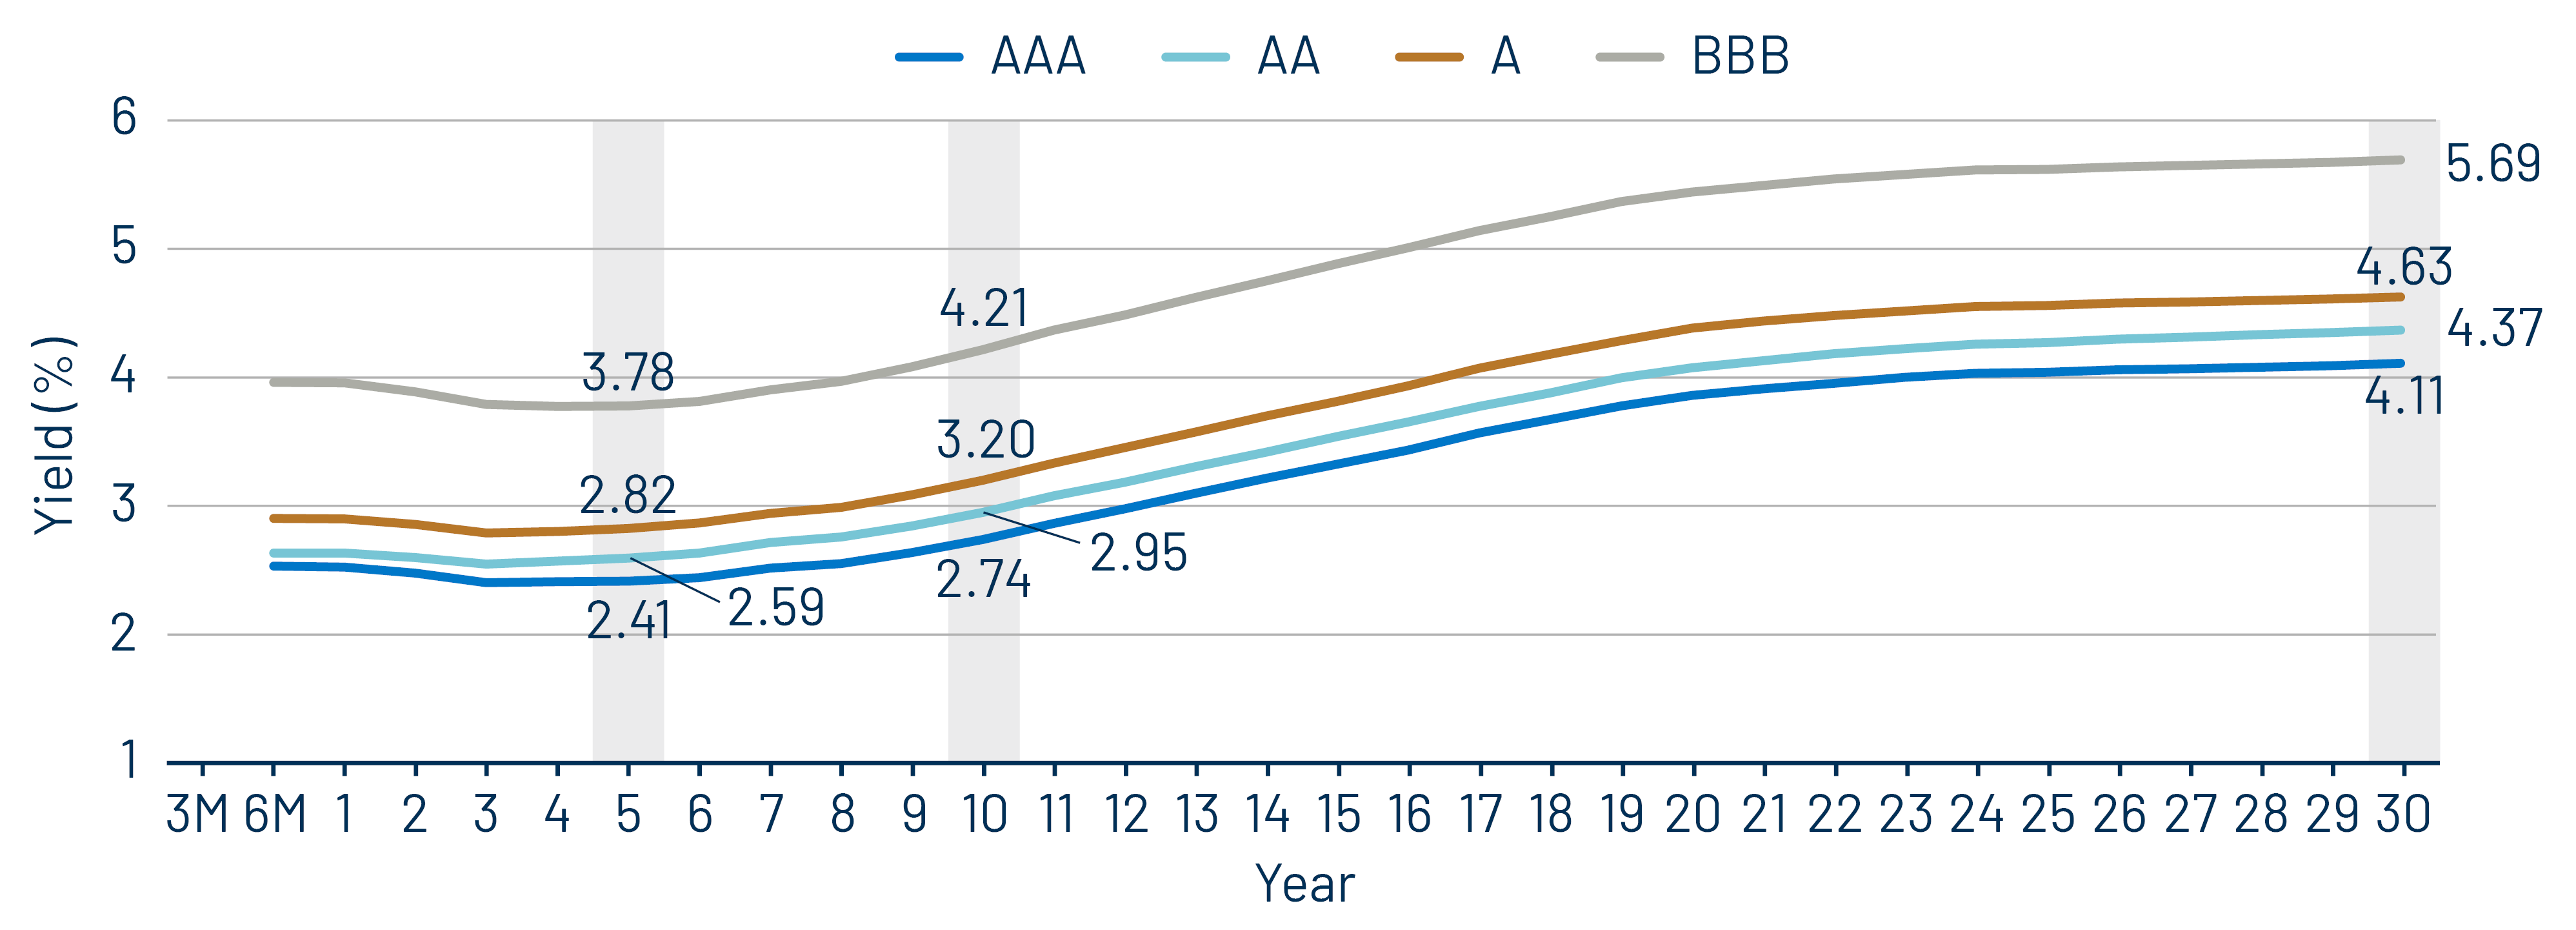
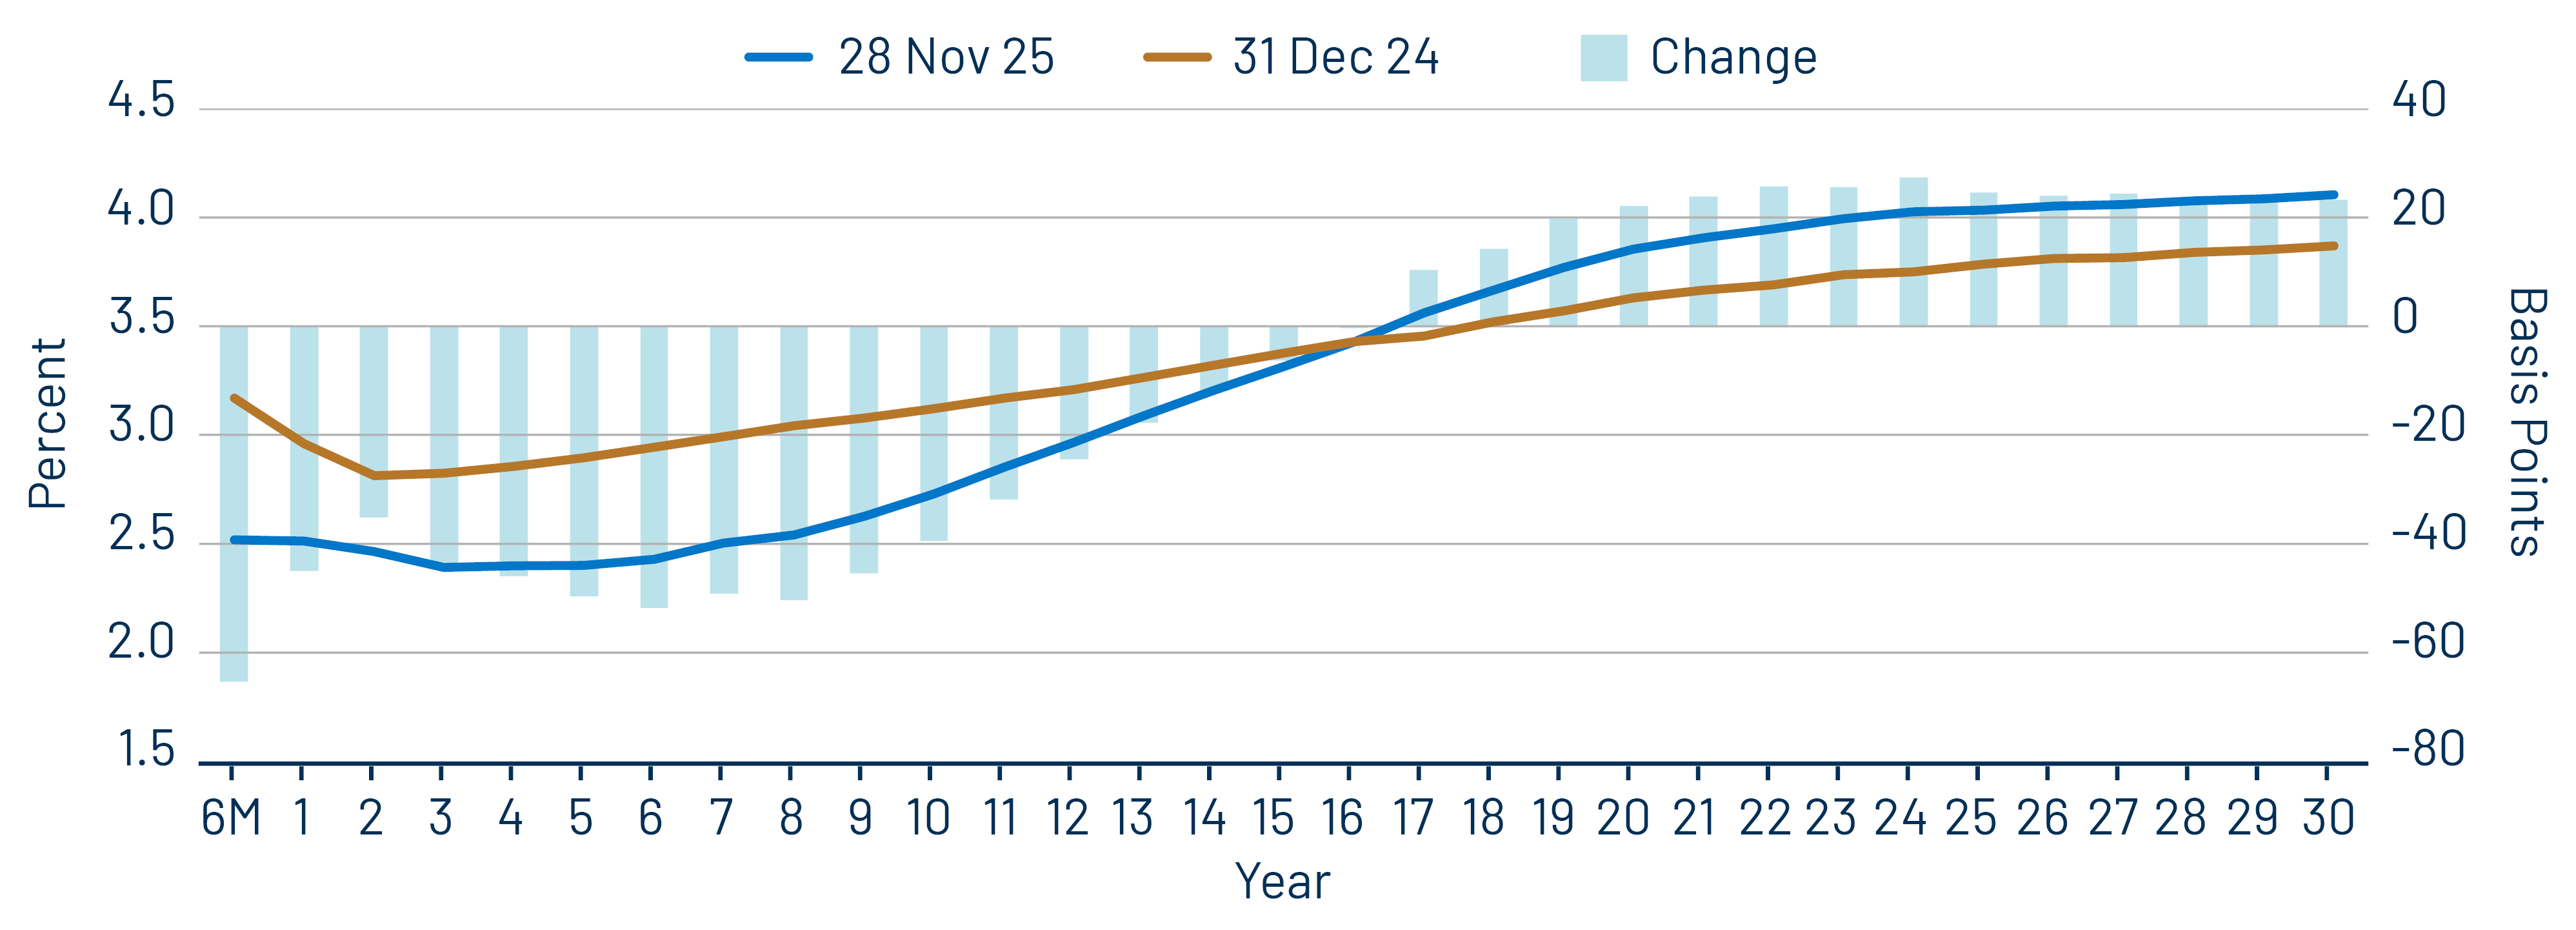
Theme #2: The AAA muni curve has steepened this year, offering better value in intermediate and longer maturities.

Exhibit 9: AAA Municipal vs. Treasury Yield Curves
AAA Municipal vs. Treasury Yield Curves
Source: Bloomberg, Western Asset. As of 28 Nov 25. Bloomberg Valuation Service (BVAL) AAA Muni Curve and US On-/Off-the-Run Sovereign Curve. Indexes are unmanaged and one cannot directly invest in them. They do not include fees, expenses or sales charges. Past performance is not an indicator or a guarantee of future results. Select the image to expand the view.

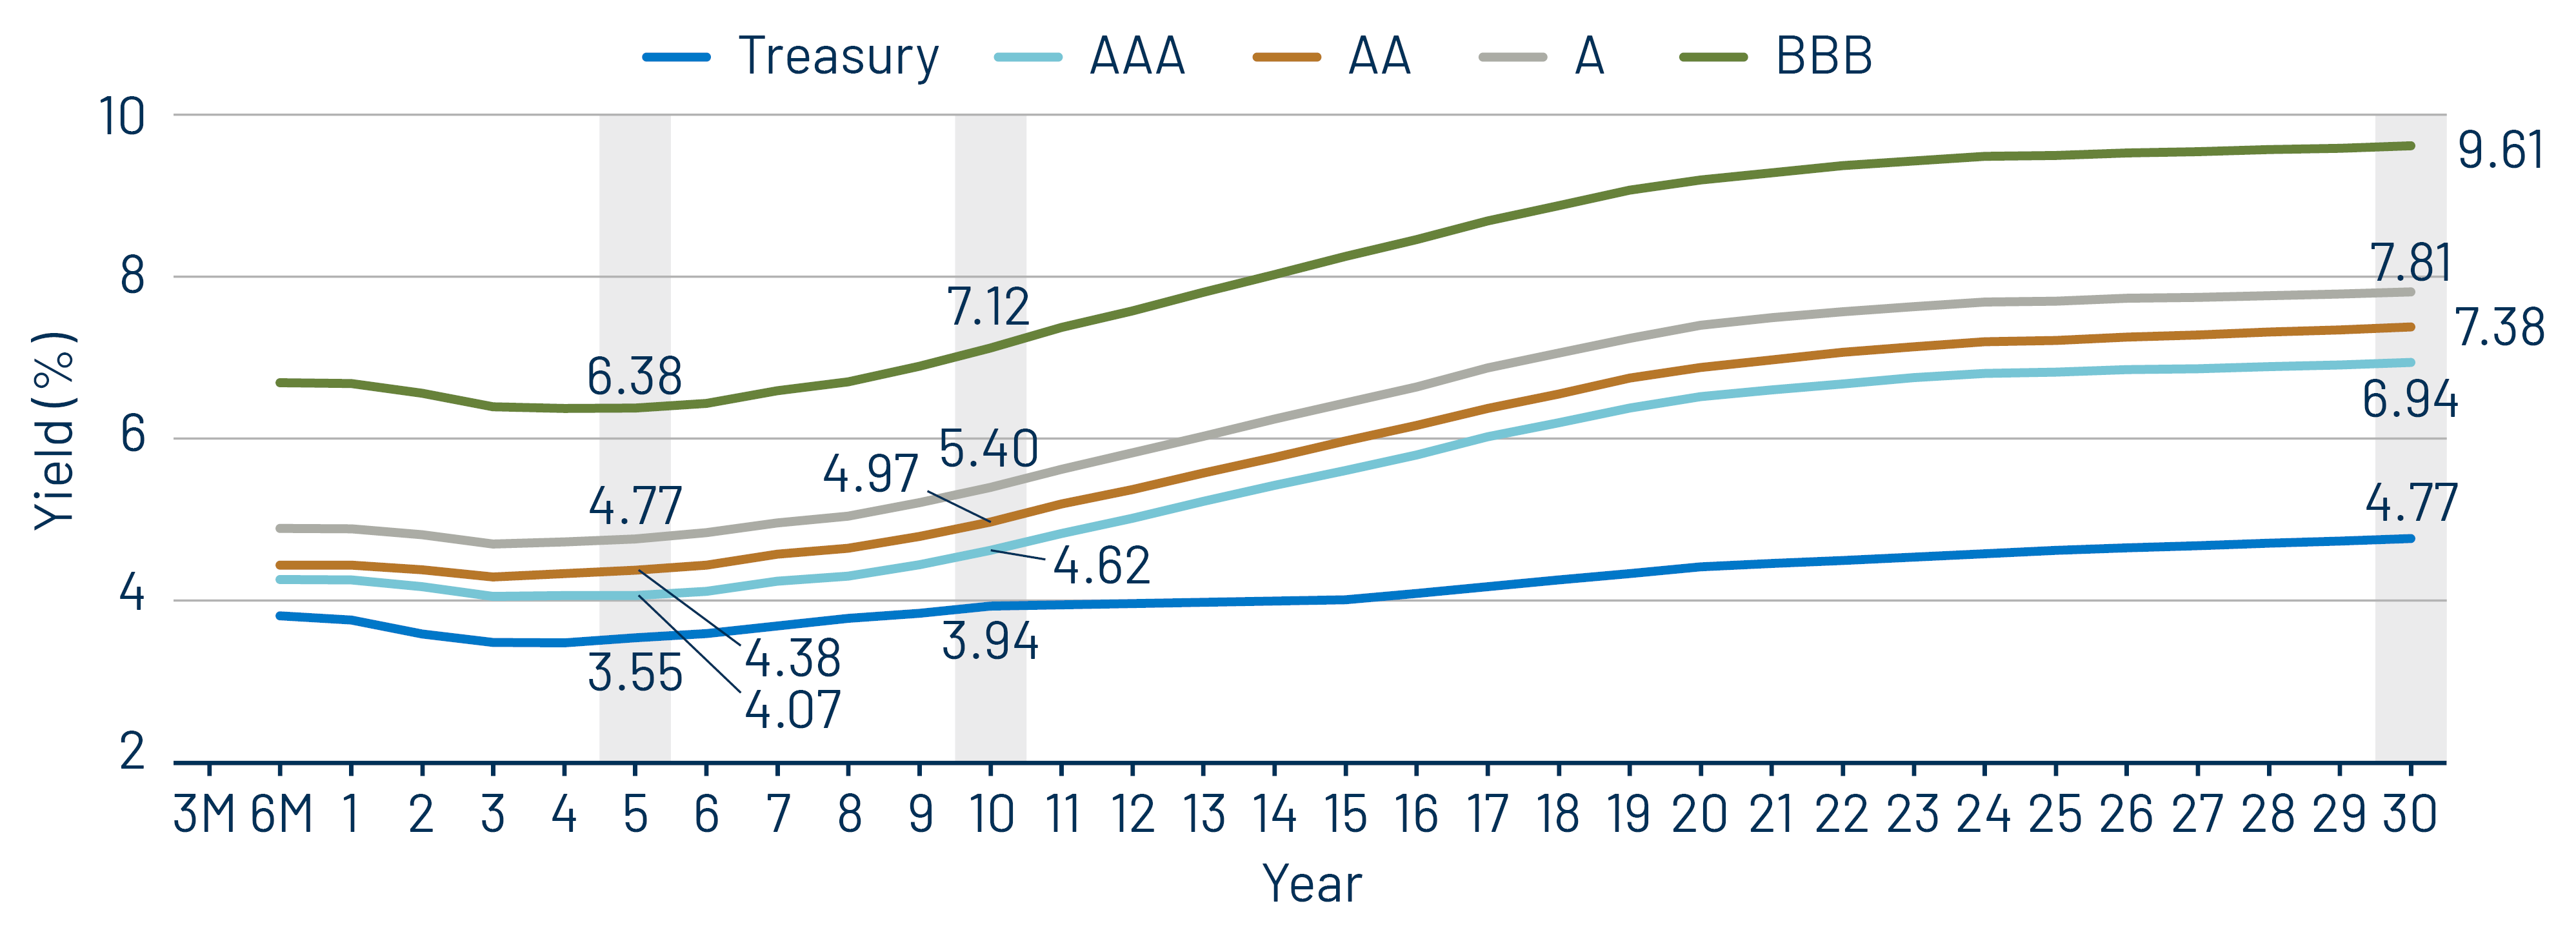
Theme #3: Munis offer attractive after-tax yield compared to taxable alternatives.

Exhibit 10: Municipal vs. Taxable Fixed-Income Yields by Quality
Municipal vs. Taxable Fixed-Income Yields by Quality
Source: Western Asset, Bloomberg. As of 28 Nov 25. 10- and 30-Year comparison reflects Bloomberg Valuation Service (BVAL) AAA Muni Curve and US On-/Off-the-Run Sovereign Curve. AA Muni reflects the Bloomberg AA Muni Bond Index. A Muni reflects the Bloomberg A Muni Bond Index. BBB Muni reflects the Bloomberg BBB Muni Bond Index. HY Muni reflects the Bloomberg High Yield Muni Bond Index. AA Corp reflects the Bloomberg AA Corporate Bond Index. A Corp reflects the Bloomberg A Corporate Bond Index. BBB Corp reflects the Bloomberg BBB Corporate Bond Index. After-tax yield considers the top marginal tax rate of 40.8%. Indexes are unmanaged and one cannot directly invest in them. They do not include fees, expenses or sales charges. Past performance is not an indicator or a guarantee of future results. Select the image to expand the view.

© Western Asset Management Company, LLC 2025. The information contained in these materials ("the materials") is intended for the exclusive use of the designated recipient ("the recipient"). This information is proprietary and confidential and may contain commercially sensitive information, and may not be copied, reproduced or republished, in whole or in part, without the prior written consent of Western Asset Management Company ("Western Asset").
Past performance does not predict future returns. These materials should not be deemed to be a prediction or projection of future performance. These materials are intended for investment professionals including professional clients, eligible counterparties, and qualified investors only.
These materials have been produced for illustrative and informational purposes only. These materials contain Western Asset's opinions and beliefs as of the date designated on the materials; these views are subject to change and may not reflect real-time market developments and investment views.
Third party data may be used throughout the materials, and this data is believed to be accurate to the best of Western Asset's knowledge at the time of publication, but cannot be guaranteed. These materials may also contain strategy or product awards or rankings from independent third parties or industry publications which are based on unbiased quantitative and/or qualitative information determined independently by each third party or publication. In some cases, Western Asset may subscribe to these third party's standard industry services or publications. These standard subscriptions and services are available to all asset managers and do not influence rankings or awards in any way.
Investment strategies or products discussed herein may involve a high degree of risk, including the loss of some or all capital. Investments in any products or strategies described in these materials may be volatile, and investors should have the financial ability and willingness to accept such risks.
Unless otherwise noted, investment performance contained in these materials is reflective of a strategy composite. All other strategy data and information included in these materials reflects a representative portfolio which is an account in the composite that Western Asset believes most closely reflects the current portfolio management style of the strategy. Performance is not a consideration in the selection of the representative portfolio. The characteristics of the representative portfolio shown may differ from other accounts in the composite. Information regarding the representative portfolio and the other accounts in the composite are available upon request. Statements in these materials should not be considered investment advice. References, either general or specific, to securities and/or issuers in the materials are for illustrative purposes only and are not intended to be, and should not be interpreted as, recommendation to purchase or sell such securities. Employees and/or clients of Western Asset may have a position in the securities or issuers mentioned.
These materials are not intended to provide, and should not be relied on for, accounting, legal, tax, investment or other advice. The recipient should consult its own counsel, accountant, investment, tax, and any other advisers for this advice, including economic risks and merits, related to making an investment with Western Asset. The recipient is responsible for observing the applicable laws and regulations of their country of residence.
Founded in 1971, Western Asset Management Company is a global fixed-income investment manager with offices in Pasadena, New York, London, Singapore, Tokyo, Melbourne, São Paulo, Hong Kong, and Zürich. Western Asset is a wholly owned subsidiary of Franklin Resources, Inc. but operates autonomously. Western Asset is comprised of six legal entities across the globe, each with distinct regional registrations: Western Asset Management Company, LLC, a registered Investment Adviser with the Securities and Exchange Commission; Western Asset Management Company Ltda. is regulated by Comissão de Valores Mobiliários; Western Asset Management Company Pty Ltd ABN 41 117 767 923 is the holder of the Australian Financial Services License 303160; Western Asset Management Company Pte. Ltd. Co. Reg. No. 200007692R is a holder of a Capital Markets Services License for fund management and regulated by the Monetary Authority of Singapore; Western Asset Management Company Ltd, a registered Financial Instruments Business Operator and regulated by the Financial Services Agency of Japan; and Western Asset Management Company Limited is authorised and regulated by the Financial Conduct Authority ("FCA") (FRN 145930). This communication is intended for distribution to Professional Clients only if deemed to be a financial promotion in the UK as defined by the FCA. This communication may also be intended for certain EEA countries where Western Asset has been granted permission to do so. For the current list of the approved EEA countries please contact Western Asset at +44 (0)20 7422 3000.