skip navigation
Blog

Stay up to date on timely topics and market events. Subscribe to our Blog now.

MARKETS
August 06, 2024

Weekly Municipal Monitor—Record Supply

By Sam Weitzman

Stay up to date on timely topics and market events. Subscribe to our Blog now.

Munis Posted Positive Returns Last Week

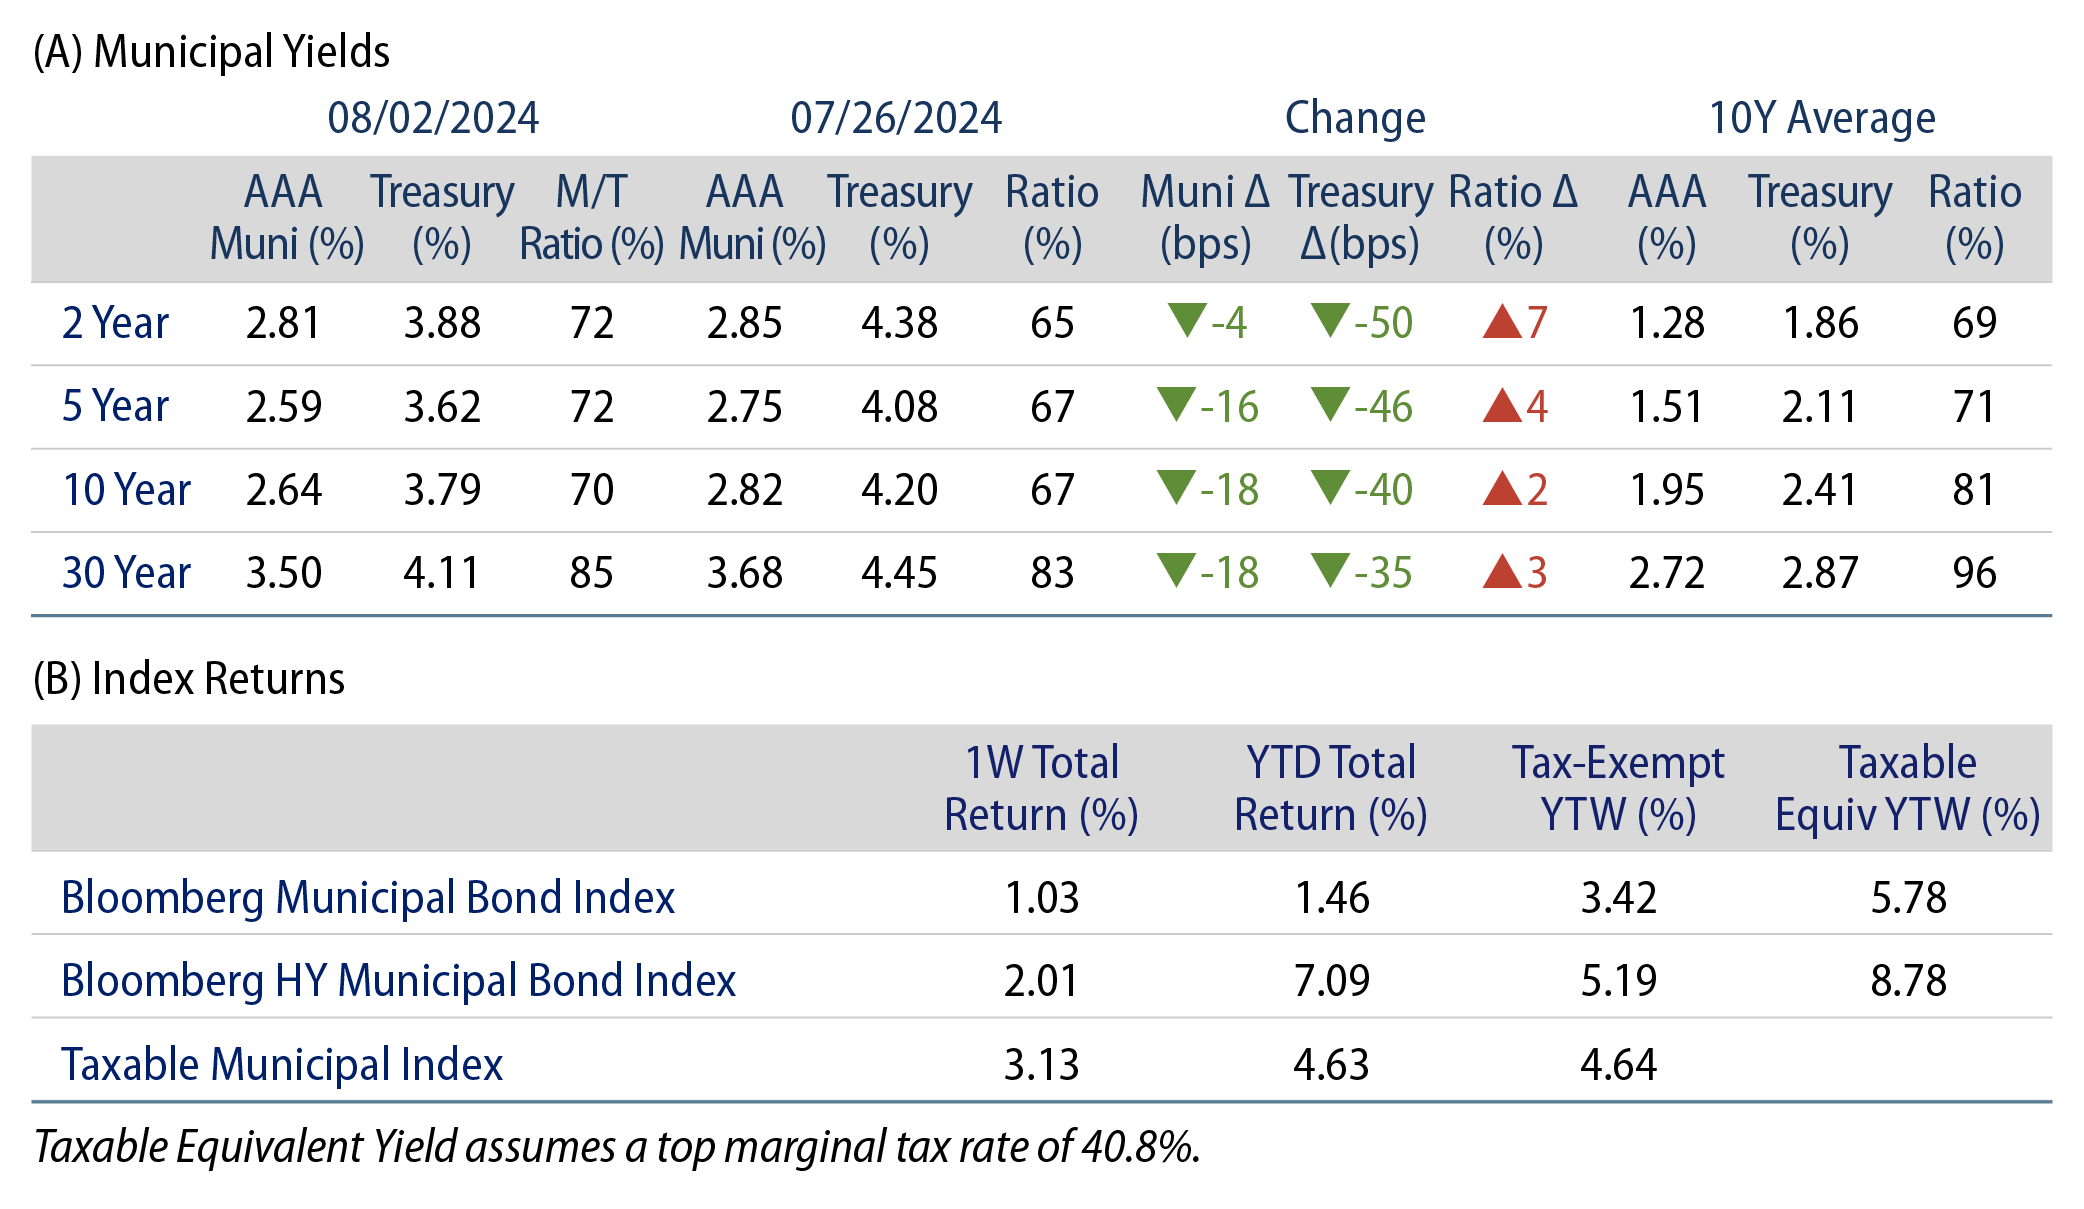
Municipals posted positive returns last week as muni yields underperformed Treasuries, which moved sharply lower on weaker-than-expected payroll data that accelerated recession fears. High-grade muni yields moved lower across the curve as rates rallied. Meanwhile, muni supply and demand remained elevated. The Bloomberg Municipal Index returned 1.03% during the week, the High Yield Muni Index returned 2.01% and the Taxable Muni Index returned 3.13%. This week we touch on the record tax-exempt muni supply observed this year.

Supply and Demand Continue to Trend Higher

Fund Flows (up $1.1 billion): During the week ending July 31, weekly reporting municipal mutual funds recorded $1.1 billion of net inflows, according to Lipper. Long-term funds recorded $948 million of inflows, high-yield funds recorded $222 million of inflows and intermediate funds recorded $101 million of inflows. This week’s inflows led estimated year-to-date (YTD) net inflows higher to $15 billion.

Supply (YTD supply of $281 billion, up 41% YoY): The muni market recorded $8 billion of new-issue volume last week, down 27% from the prior week. YTD issuance of $281 billion is 41% higher from last year’s level, with tax-exempt issuance 45% higher and taxable issuance 4% higher year-over-year (YoY). This week’s calendar is expected to accelerate to $16 billion, which would represent the highest level this year. Largest deals include $1.3 billion Louisiana Public Finance Authority and $1 billion Long Island Power Authority transactions.

This Week in Munis: Record Supply

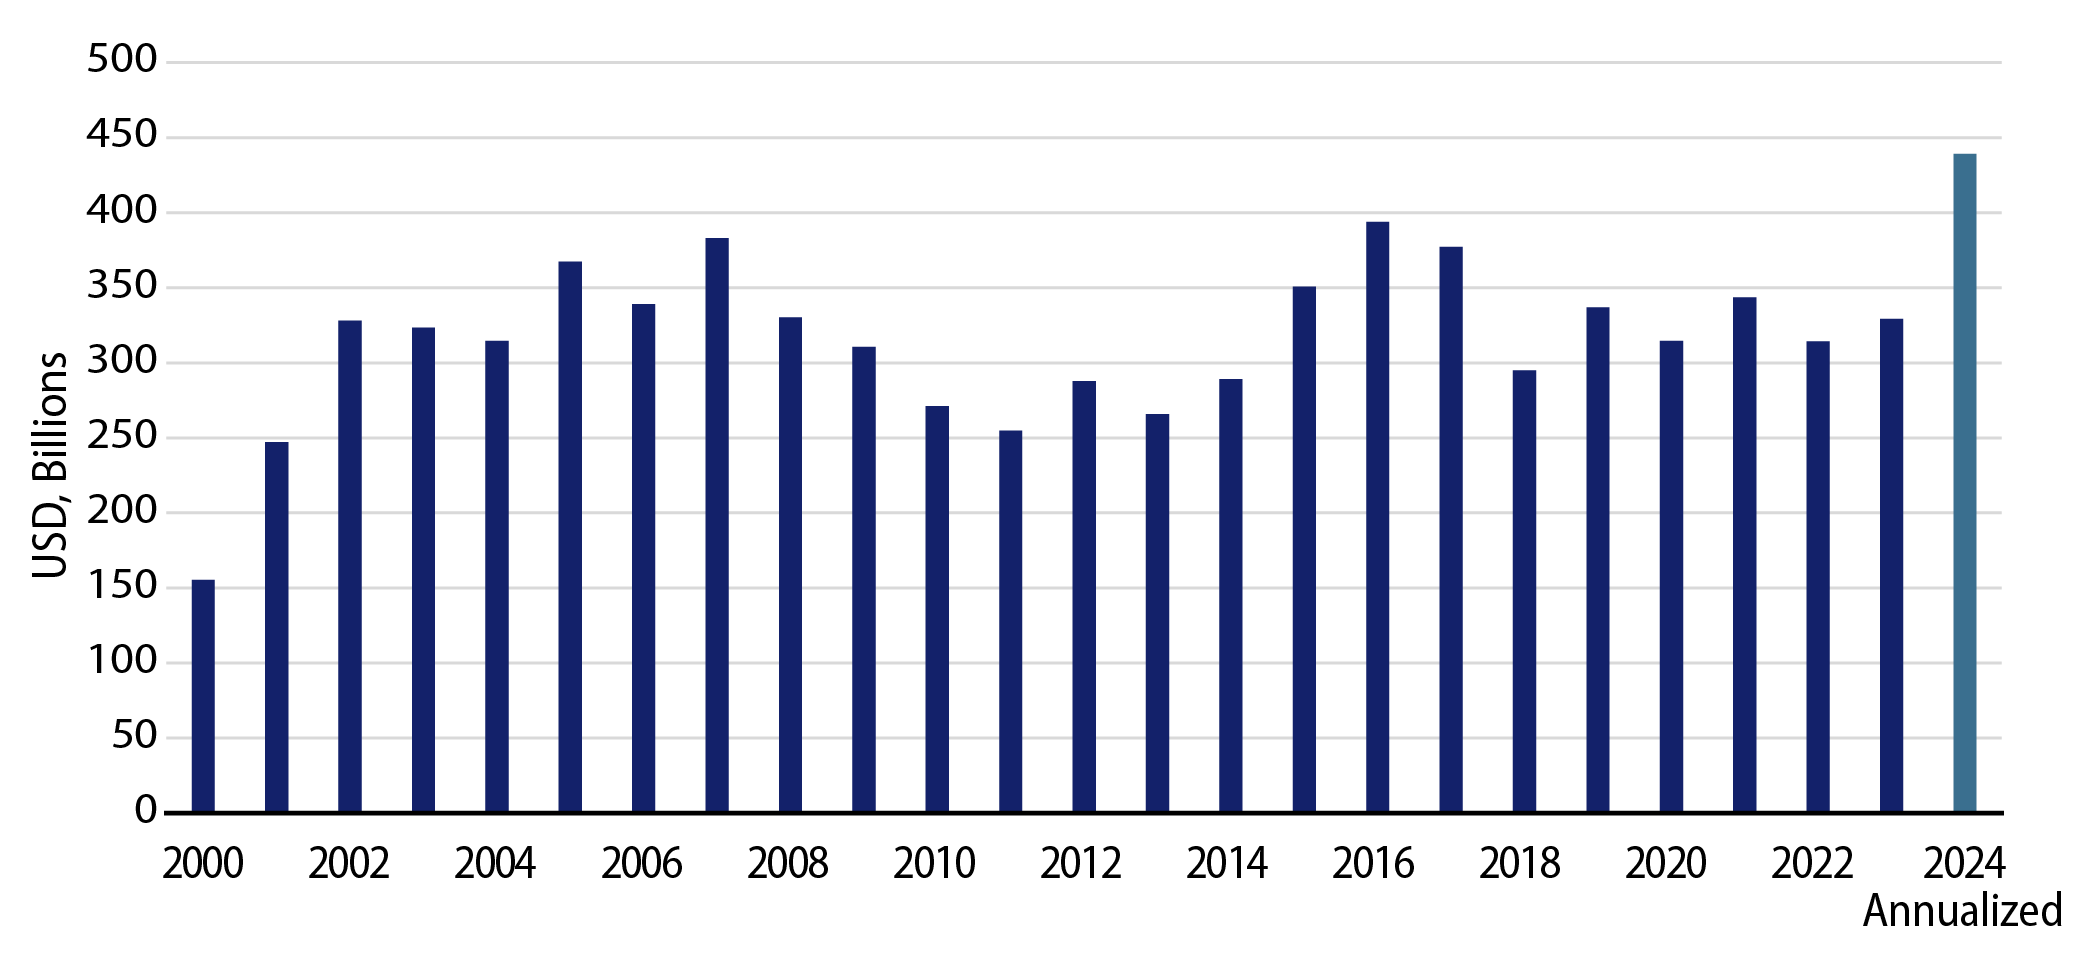
The summer months, and particularly the month of July, are characterized by the “summer doldrums,” or lower supply levels and overall market activity. Over the prior decade, July tax-exempt new-issue supply averaged $28 billion, ranking toward the bottom of months in terms of average issuance. In July 2024, tax-exempt supply reached $36 billion, surpassing the 10-year average by 30%, and leading YTD tax-exempt supply to $256 billion. If tax-exempt supply maintains its current pace, 2024 would reach a record $440 billion.

Exhibit 1: Tax-Exempt Muni Supply
Tax-Exempt Muni Supply
Source: Western Asset, Bloomberg. As of 03 Jul 24. Select the image to expand the view.

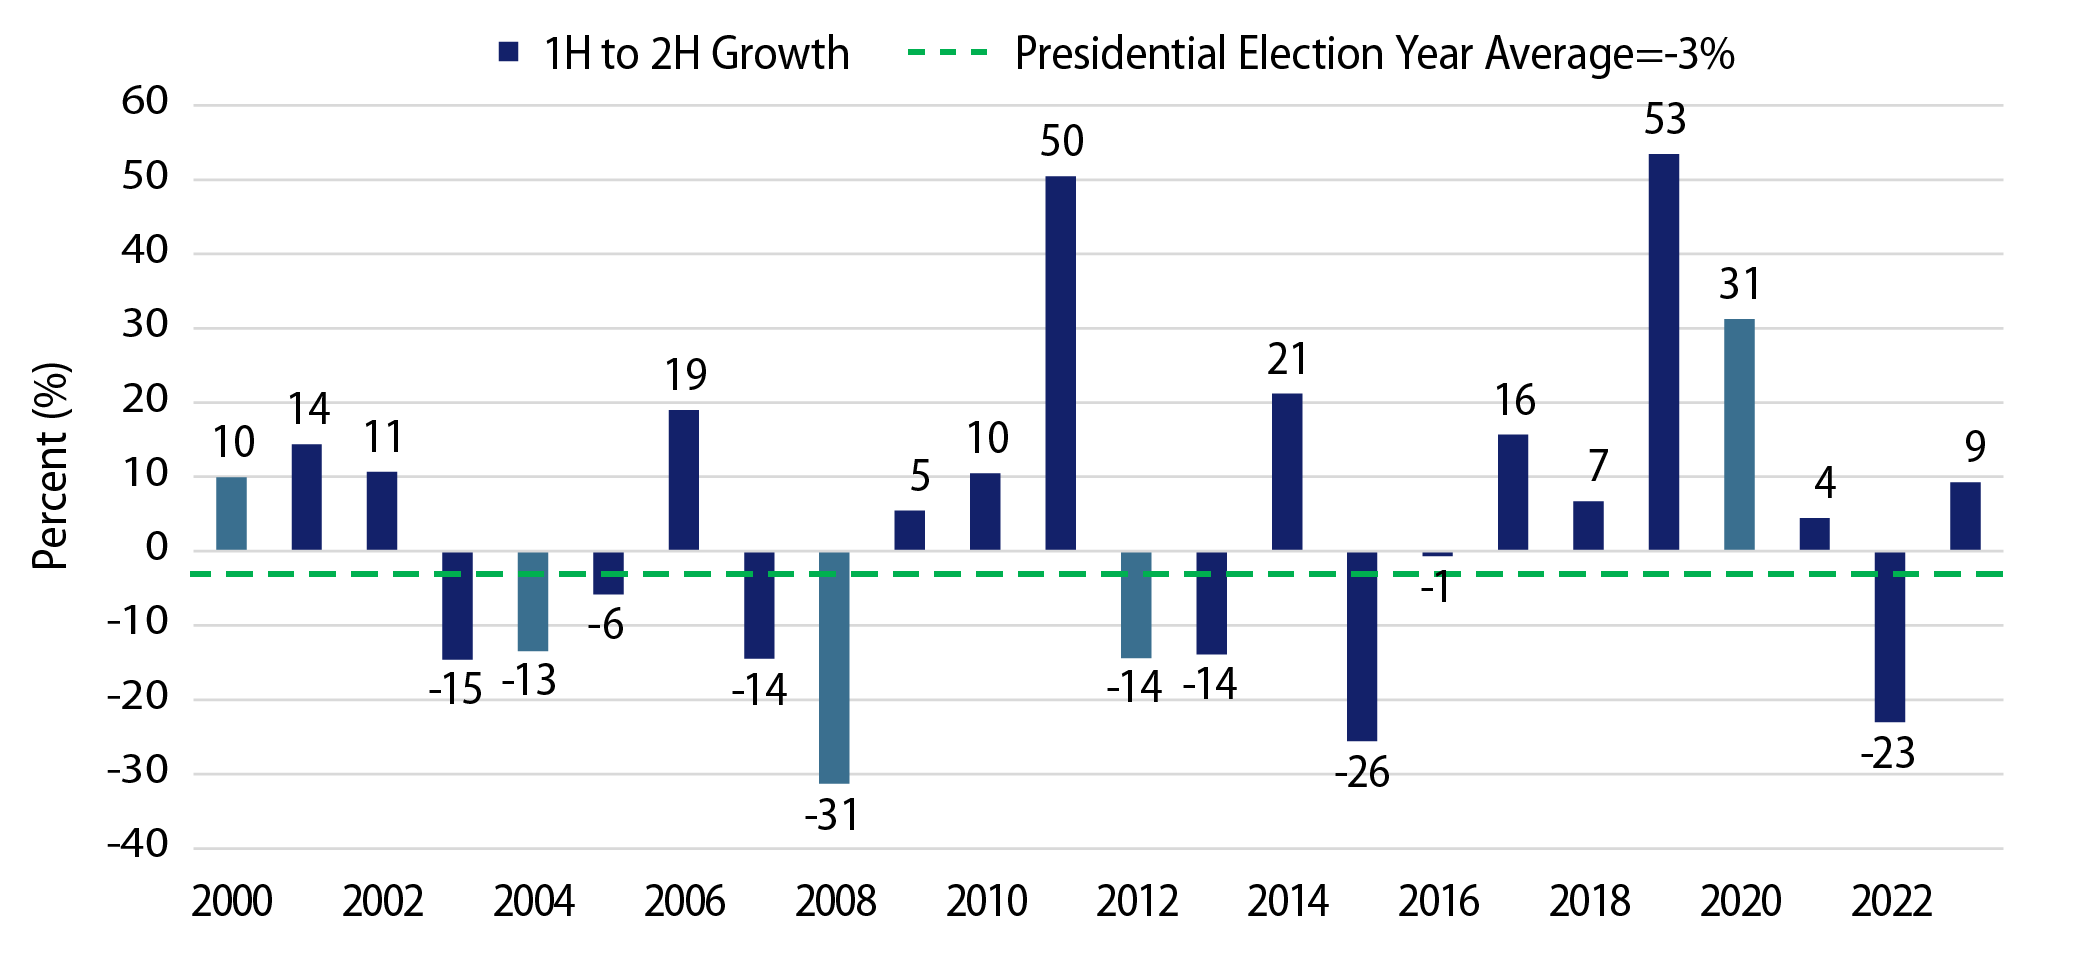
Many market participants point to prior presidential election years to guide supply expectations lower for the second half of 2024. Historical data does suggest that supply has moved lower in recent presidential election years, but only to an extent. From 2000 to 2023, average municipal supply increased by 2.3% from the first half of the year to the second half. Meanwhile, considering presidential election years only, muni supply declined by 3.1% on average. While these averages point to lower supply levels during election years, the variability of these election-year outcomes is quite high, considering the 31% YoY supply decline in 2008 and the 31% YoY supply increase in 2020.

Exhibit 2: Municipal First- to Second-Half Year Supply Growth
Municipal First- to Second-Half Year Supply Growth
Source: Bloomberg, Western Asset. As of 31 Jul 24. Select the image to expand the view.

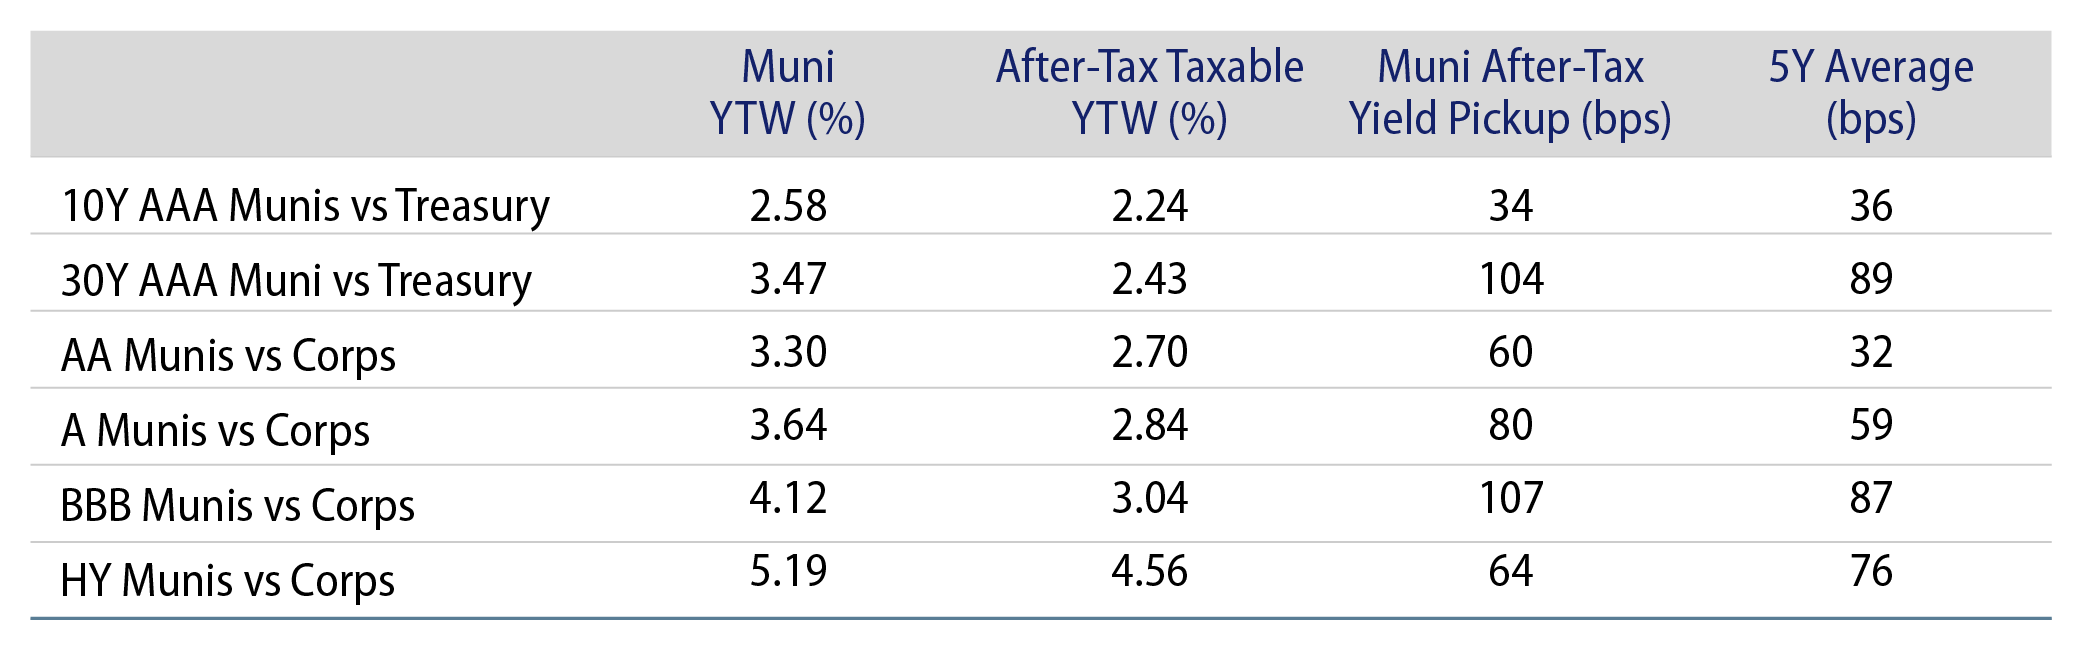
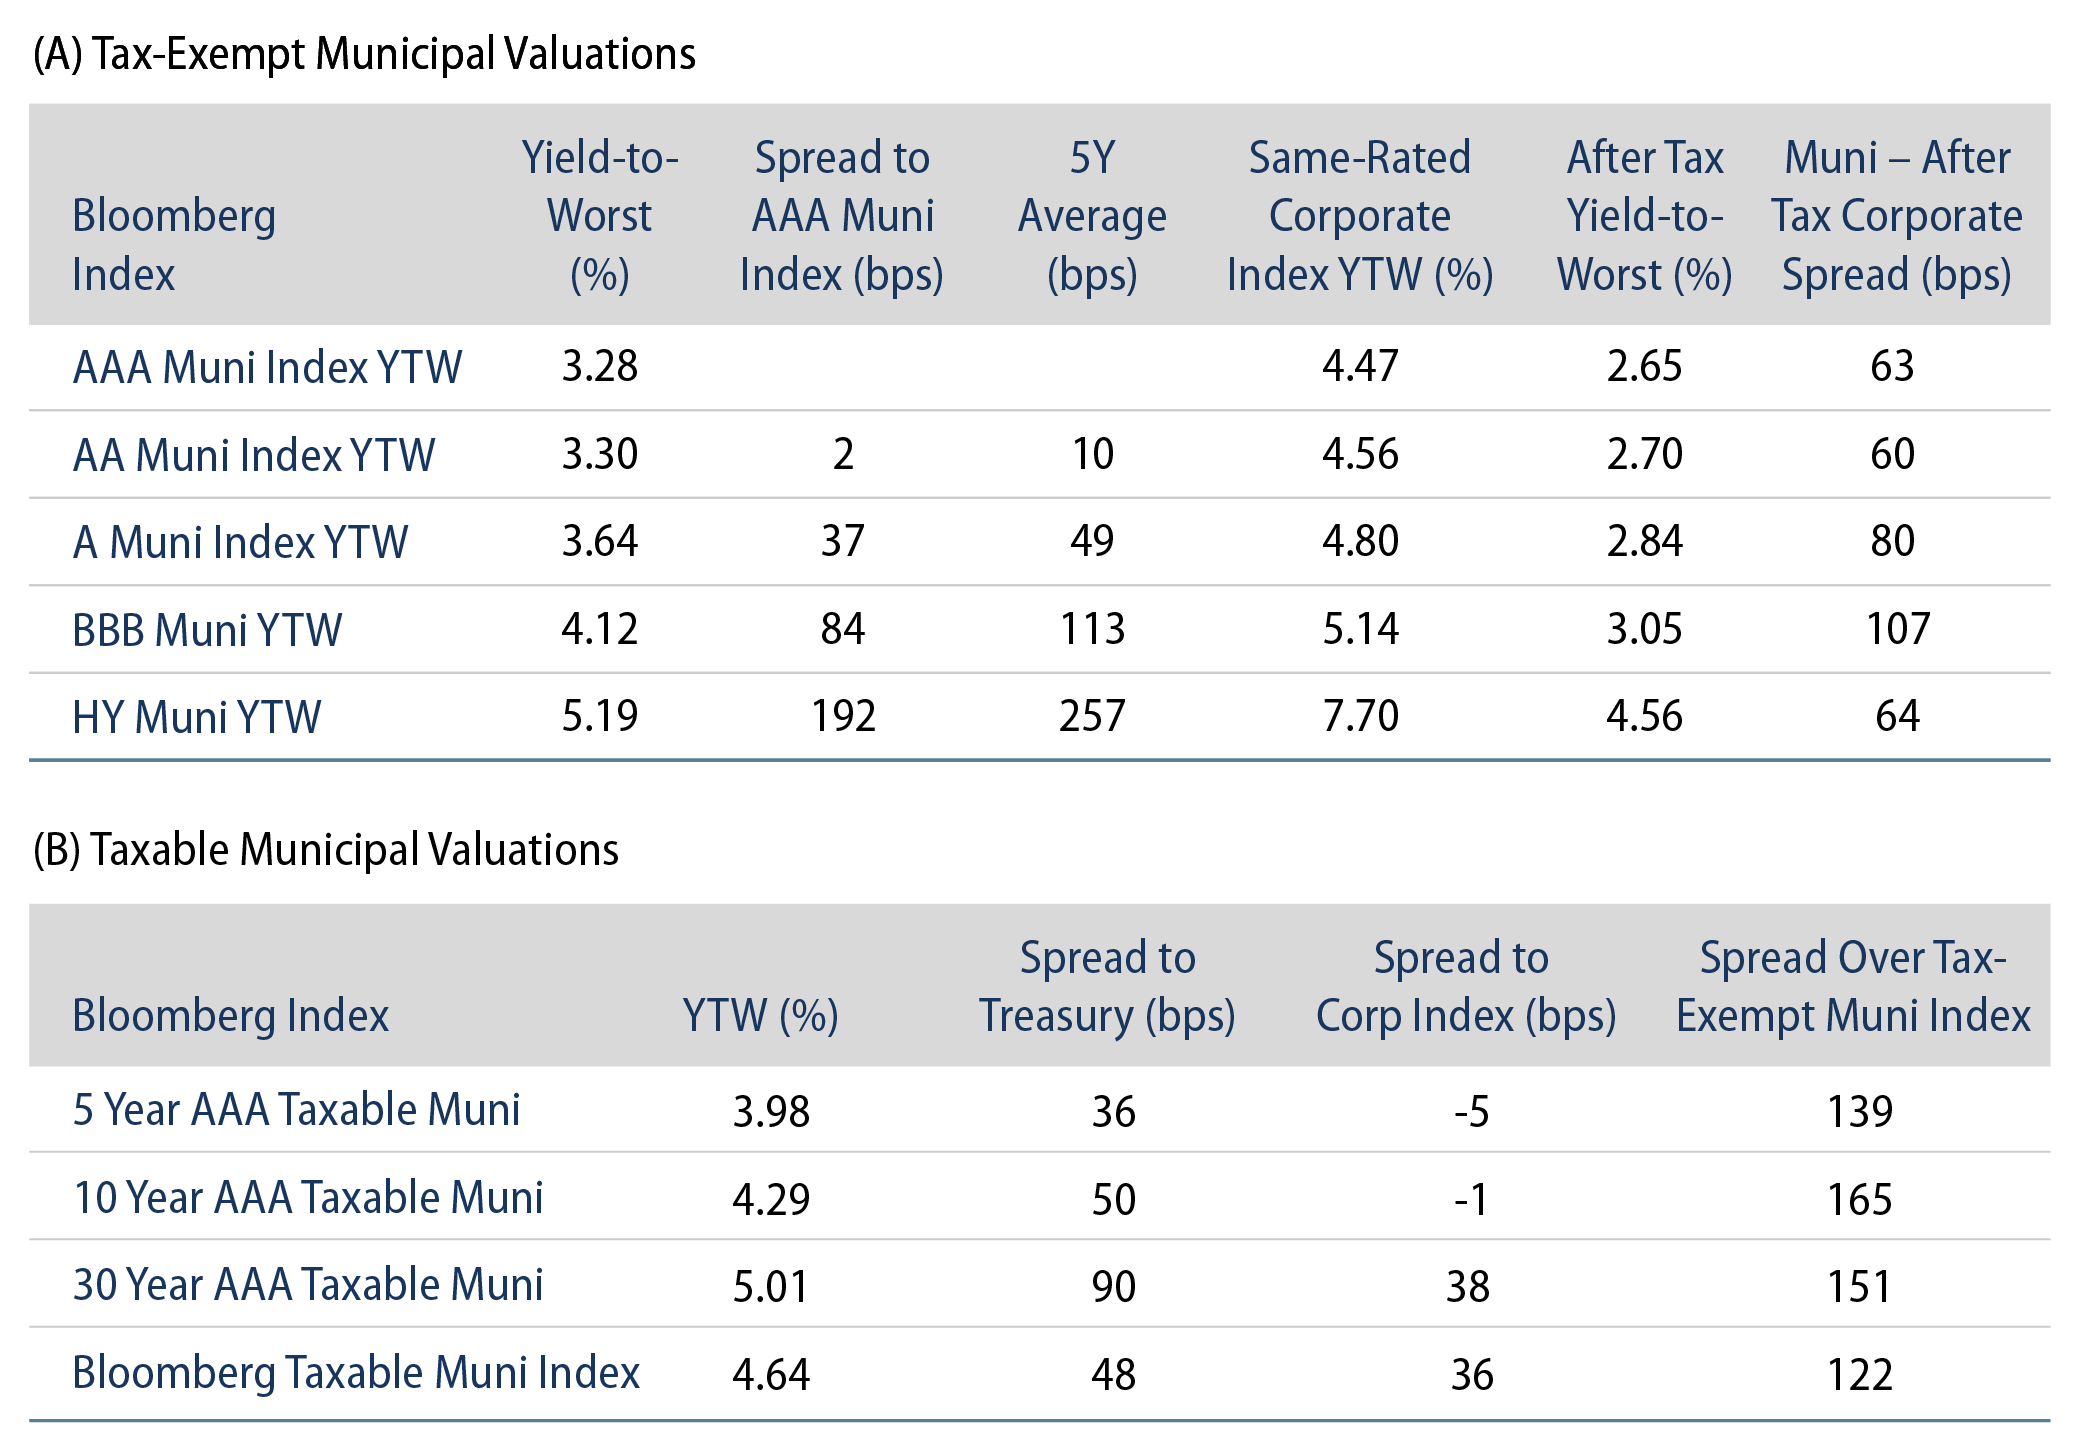
Even if supply declines an above-average 10% in the second half of 2024, total tax-exempt supply will still likely eclipse a record year, indicative of the scope of elevated supply observed in the first half of the year. These supply levels and relative muni underperformance have provided an attractive entry point for relatively attractive after-tax income levels. Since the beginning of July, the average Bloomberg Muni Index yield-to-worst (YTW) declined just 32 basis points (bps), while Bloomberg Corporate and Treasury indices declined 78 bps and 60 bps, respectively. This has resulted in improved after-tax yield advantages for the muni asset class for high taxpayers, which still range above 100 bps in longer maturity and lower credit quality cohorts.

Exhibit 3: After-Tax Yield Pickup by Quality Cohort
After-Tax Yield Pickup by Quality Cohort
Source: Bloomberg, Western Asset. As of 02 Aug 24: 10- and 30-Year comparison reflects Bloomberg Valuation Service (BVAL) AAA Muni Curve and US On-/Off-the-Run Sovereign Curve. AA Muni reflects the Bloomberg AA Muni Bond Index. A Muni reflects the Bloomberg A Muni Bond Index. BBB Muni reflects the Bloomberg BBB Muni Bond Index. HY Muni reflects the Bloomberg High Yield Muni Bond Index. AA Corp reflects the Bloomberg AA Corporate Bond Index. A Corp reflects the Bloomberg A Corporate Bond Index. BBB Corp reflects the Bloomberg BBB Corporate Bond Index. After-tax yield considers top marginal tax rate of 40.8%. Indexes are unmanaged and one cannot directly invest in them. They do not include fees, expenses or sales charges. Past performance is not an indicator or a guarantee of future results. Select the image to expand the view.

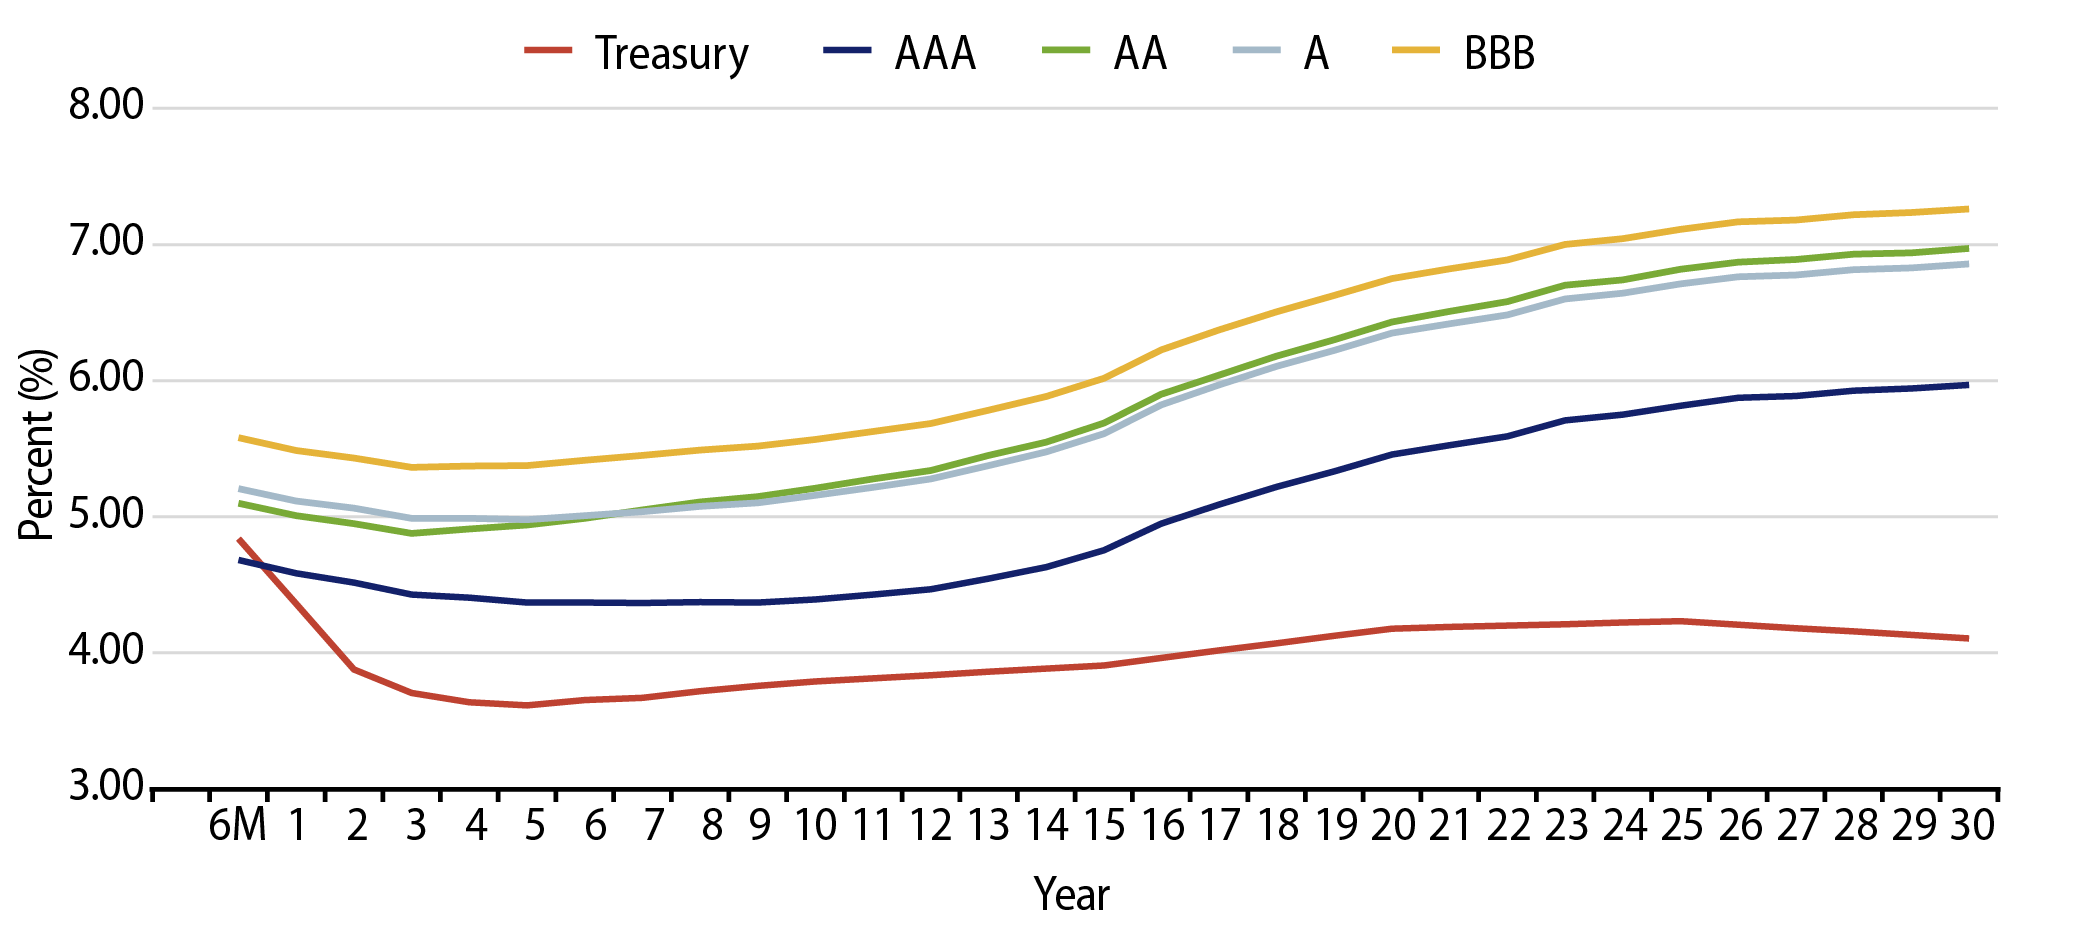
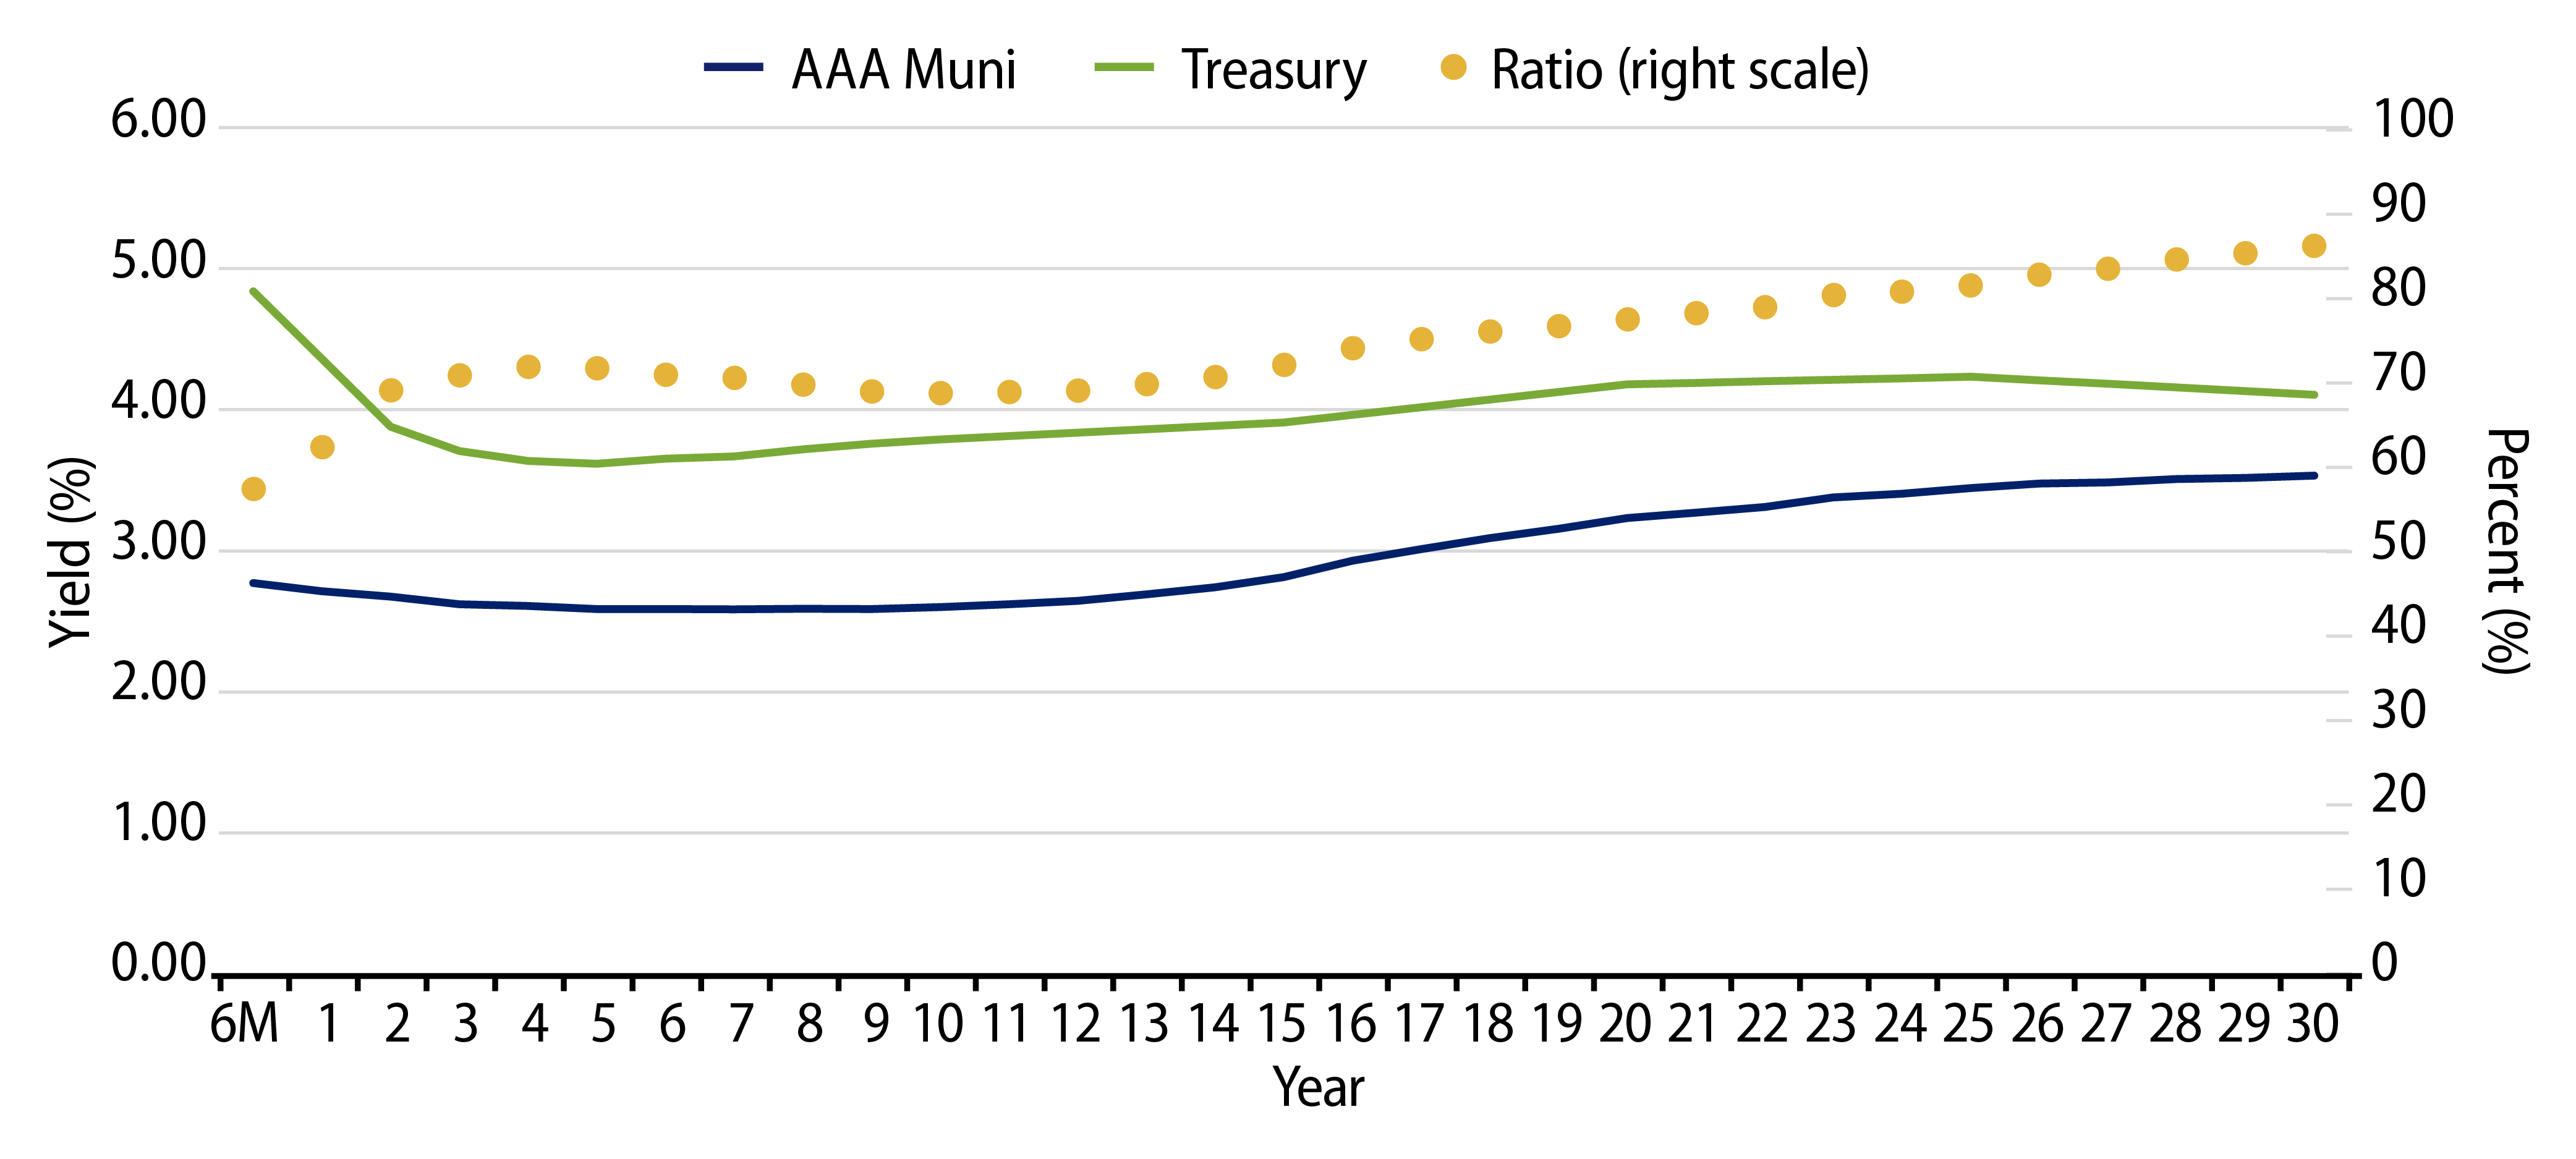
Municipal Credit Curves and Relative Value

Exhibit 4: Muni Credit Curves
Muni Credit Curves
Source: Bloomberg, Western Asset. As of 02 Aug 24. Bloomberg BVAL Municipal Credit Indices (AAA, AA, A, BBB, respectively) and US Sovereign Curves. Taxable-Equivalent Muni Credit Curves consider the top marginal effective tax rate of 40.8%. Select the image to expand the view.
Exhibit 5: Taxable-Equivalent Muni Credit Curves
Taxable-Equivalent Muni Credit Curves
Source: Bloomberg, Western Asset. As of 02 Aug 24. Bloomberg BVAL Municipal Credit Indices (AAA, AA, A, BBB, respectively) and US Sovereign Curves. Taxable-Equivalent Muni Credit Curves consider the top marginal effective tax rate of 40.8%. Select the image to expand the view.
Exhibit 6: AAA Munis vs. Treasuries
AAA Munis vs. Treasuries
Source: Muni Yields: Thomson Reuters MMD, Treasury Yields: Bloomberg. As of 02 Aug 24. Past performance is not a guarantee of future results. It is not possible to invest directly in an Index. Select the image to expand the view.
Exhibit 7: Tax-Exempt and Taxable Muni Valuations
Tax-Exempt and Taxable Muni Valuations
Source: Bloomberg. Yield-to-worst (YTW) is the lowest potential yield that can be received on a bond without the issuer actually defaulting. As of 02 Aug 24. Select the image to expand the view.

Western Asset Key Themes for Muni Investors

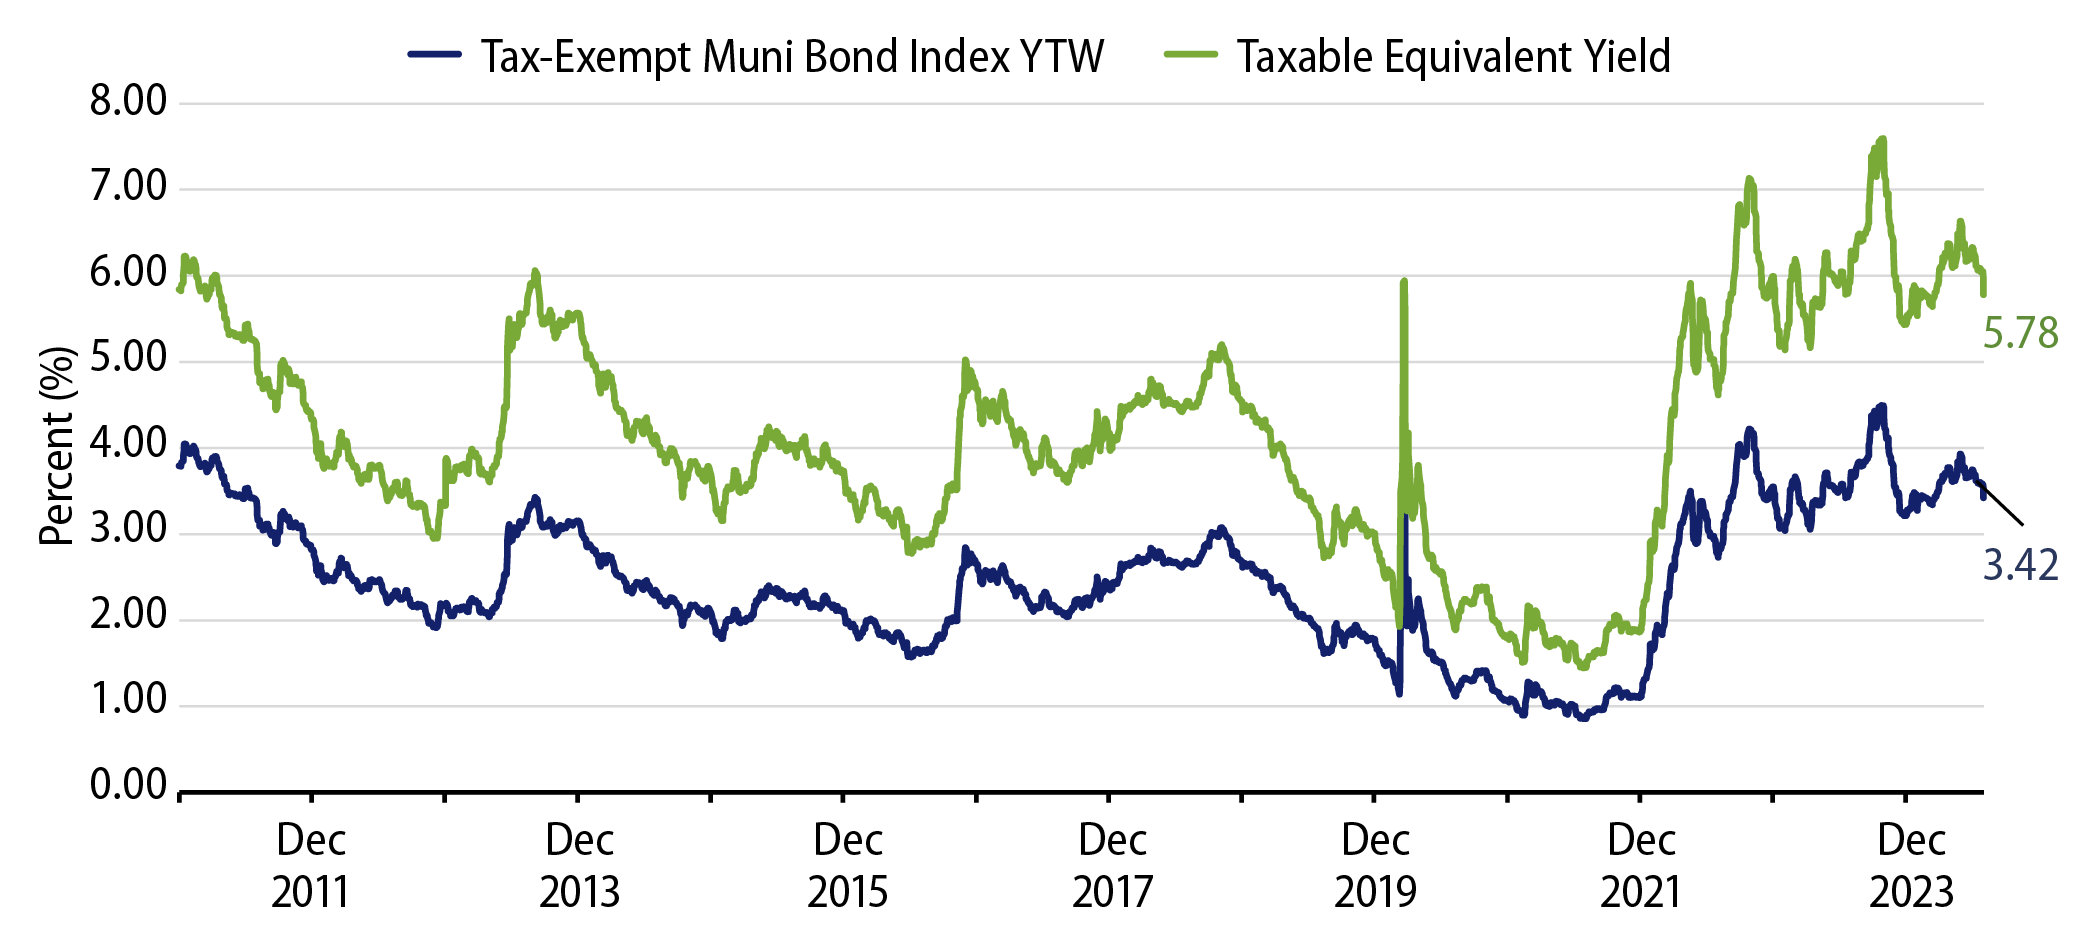
Theme #1: Municipal taxable-equivalent yields, and income opportunities, are above decade averages.

Exhibit 8: Muni and Taxable-Equivalent Muni Yield-to-Worst
Muni and Taxable-Equivalent Muni Yield-to-Worst
Source: Bloomberg, Western Asset. As of 12 Jul 24. Bloomberg Municipal Bond Index Yield Considering Highest Marginal Tax Rate of 40.8%. Indexes are unmanaged and one cannot directly invest in them. They do not include fees, expenses or sales charges. Past performance is not an indicator or a guarantee of future results. Select the image to expand the view.

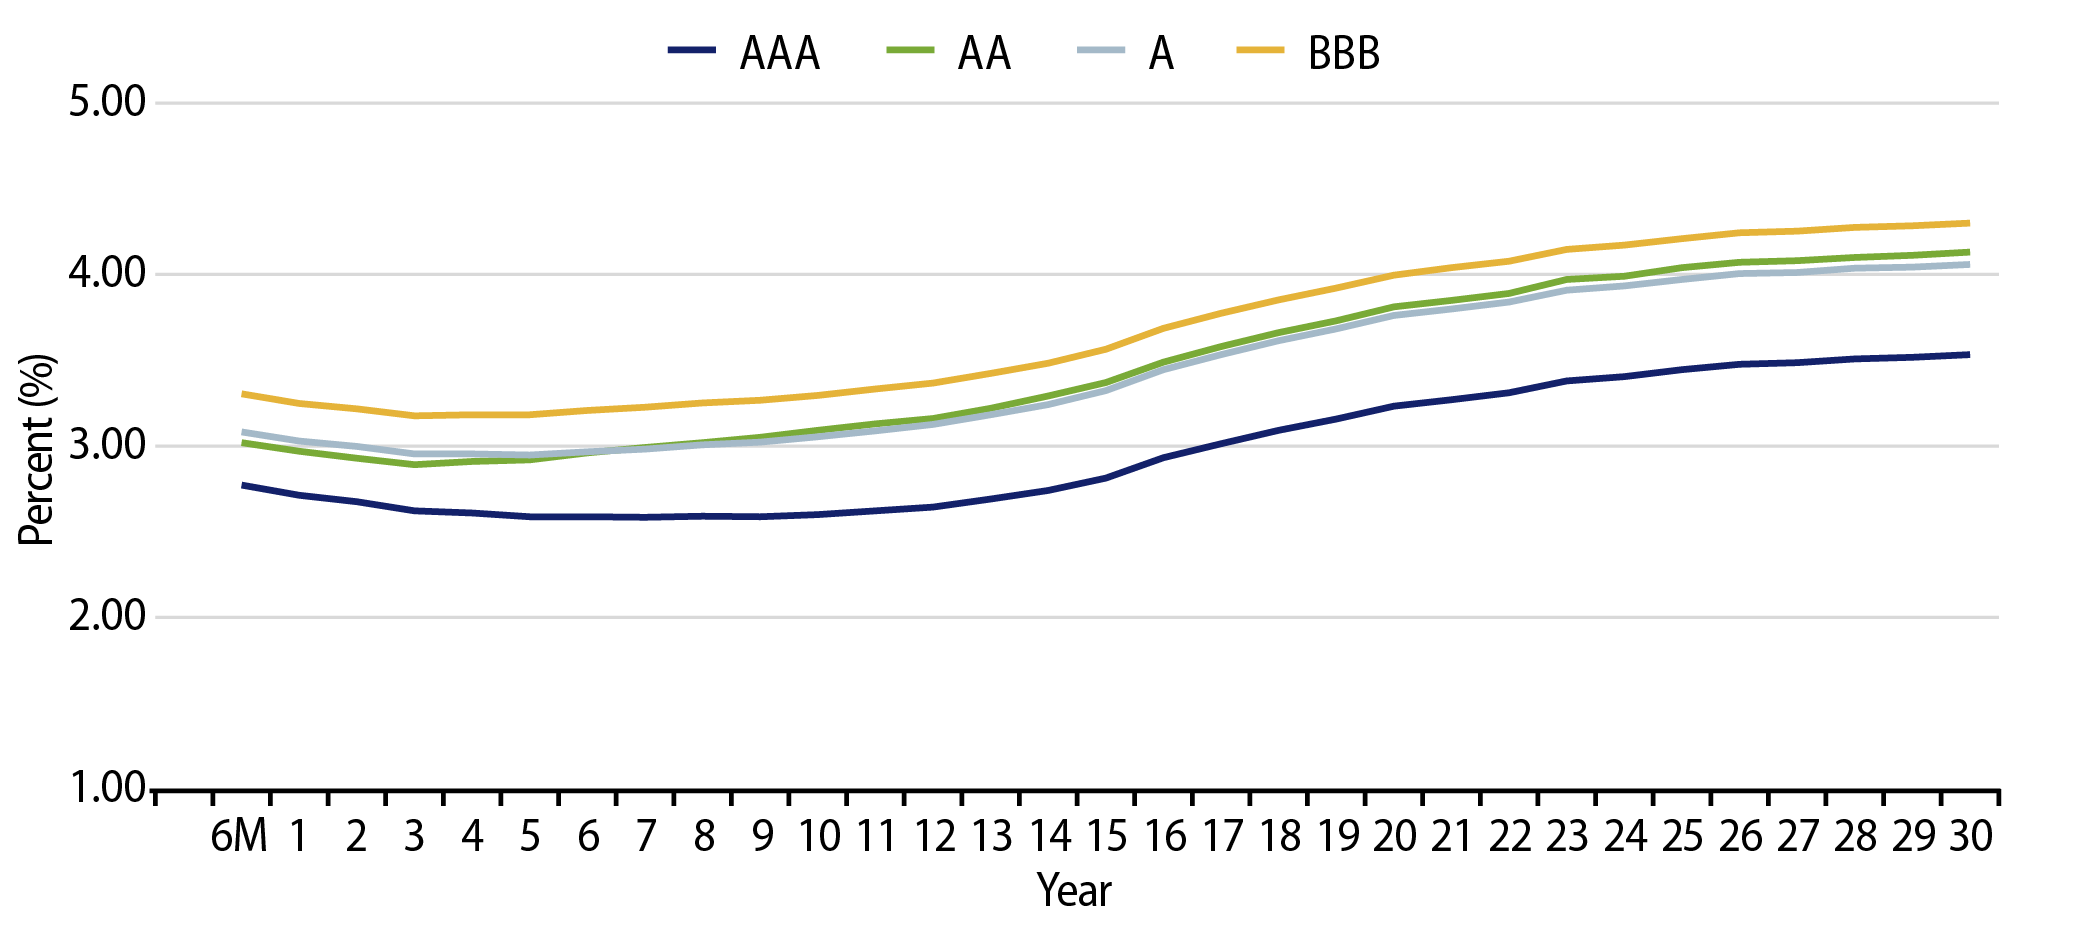
Theme #2: The muni yield curve has largely disinverted, offering potential value in extending maturities.

Exhibit 9: AAA Municipal vs. Treasury Yield Curves
AAA Municipal vs. Treasury Yield Curves
Source: Bloomberg, Western Asset. As of 02 Aug 24. Bloomberg Valuation Service (BVAL) AAA Muni Curve and US On-/Off-the-Run Sovereign Curve. Indexes are unmanaged and one cannot directly invest in them. They do not include fees, expenses or sales charges. Past performance is not an indicator or a guarantee of future results. Select the image to expand the view.

Theme #3: Munis offer attractive after-tax yield pickup versus longer-dated Treasuries and investment-grade corporate credit.

Exhibit 10: Municipal vs. Taxable Fixed-Income Yields by Quality
Municipal vs. Taxable Fixed-Income Yields by Quality
Source: Western Asset, Bloomberg. As 02 Aug 24. 10- and 30-Year comparison reflects Bloomberg Valuation Service (BVAL) AAA Muni Curve and US On-/Off-the-Run Sovereign Curve. AA Muni reflects the Bloomberg AA Muni Bond Index. A Muni reflects the Bloomberg A Muni Bond Index. BBB Muni reflects the Bloomberg BBB Muni Bond Index. HY Muni reflects the Bloomberg High Yield Muni Bond Index. AA Corp reflects the Bloomberg AA Corporate Bond Index. A Corp reflects the Bloomberg A Corporate Bond Index. BBB Corp reflects the Bloomberg BBB Corporate Bond Index. After-tax yield considers top marginal tax rate of 40.8%. Indexes are unmanaged and one cannot directly invest in them. They do not include fees, expenses or sales charges. Past performance is not an indicator or a guarantee of future results. Select the image to expand the view.

© Western Asset Management Company, LLC 2025. The information contained in these materials ("the materials") is intended for the exclusive use of the designated recipient ("the recipient"). This information is proprietary and confidential and may contain commercially sensitive information, and may not be copied, reproduced or republished, in whole or in part, without the prior written consent of Western Asset Management Company ("Western Asset").
Past performance does not predict future returns. These materials should not be deemed to be a prediction or projection of future performance. These materials are intended for investment professionals including professional clients, eligible counterparties, and qualified investors only.
These materials have been produced for illustrative and informational purposes only. These materials contain Western Asset's opinions and beliefs as of the date designated on the materials; these views are subject to change and may not reflect real-time market developments and investment views.
Third party data may be used throughout the materials, and this data is believed to be accurate to the best of Western Asset's knowledge at the time of publication, but cannot be guaranteed. These materials may also contain strategy or product awards or rankings from independent third parties or industry publications which are based on unbiased quantitative and/or qualitative information determined independently by each third party or publication. In some cases, Western Asset may subscribe to these third party's standard industry services or publications. These standard subscriptions and services are available to all asset managers and do not influence rankings or awards in any way.
Investment strategies or products discussed herein may involve a high degree of risk, including the loss of some or all capital. Investments in any products or strategies described in these materials may be volatile, and investors should have the financial ability and willingness to accept such risks.
Unless otherwise noted, investment performance contained in these materials is reflective of a strategy composite. All other strategy data and information included in these materials reflects a representative portfolio which is an account in the composite that Western Asset believes most closely reflects the current portfolio management style of the strategy. Performance is not a consideration in the selection of the representative portfolio. The characteristics of the representative portfolio shown may differ from other accounts in the composite. Information regarding the representative portfolio and the other accounts in the composite are available upon request. Statements in these materials should not be considered investment advice. References, either general or specific, to securities and/or issuers in the materials are for illustrative purposes only and are not intended to be, and should not be interpreted as, recommendation to purchase or sell such securities. Employees and/or clients of Western Asset may have a position in the securities or issuers mentioned.
These materials are not intended to provide, and should not be relied on for, accounting, legal, tax, investment or other advice. The recipient should consult its own counsel, accountant, investment, tax, and any other advisers for this advice, including economic risks and merits, related to making an investment with Western Asset. The recipient is responsible for observing the applicable laws and regulations of their country of residence.
Founded in 1971, Western Asset Management Company is a global fixed-income investment manager with offices in Pasadena, New York, London, Singapore, Tokyo, Melbourne, São Paulo, Hong Kong, and Zürich. Western Asset is a wholly owned subsidiary of Franklin Resources, Inc. but operates autonomously. Western Asset is comprised of six legal entities across the globe, each with distinct regional registrations: Western Asset Management Company, LLC, a registered Investment Adviser with the Securities and Exchange Commission; Western Asset Management Company Ltda. is regulated by Comissão de Valores Mobiliários; Western Asset Management Company Pty Ltd ABN 41 117 767 923 is the holder of the Australian Financial Services License 303160; Western Asset Management Company Pte. Ltd. Co. Reg. No. 200007692R is a holder of a Capital Markets Services License for fund management and regulated by the Monetary Authority of Singapore; Western Asset Management Company Ltd, a registered Financial Instruments Business Operator and regulated by the Financial Services Agency of Japan; and Western Asset Management Company Limited is authorised and regulated by the Financial Conduct Authority ("FCA") (FRN 145930). This communication is intended for distribution to Professional Clients only if deemed to be a financial promotion in the UK as defined by the FCA. This communication may also be intended for certain EEA countries where Western Asset has been granted permission to do so. For the current list of the approved EEA countries please contact Western Asset at +44 (0)20 7422 3000.