skip navigation
Blog

Stay up to date on timely topics and market events. Subscribe to our Blog now.

MARKETS
June 15, 2021

Weekly Municipal Monitor—Muni Payrolls Continue to Lag, Despite Stimulus

By Robert E. Amodeo, Michael J. Bazdarich, PhD, Dave Fare

Stay up to date on timely topics and market events. Subscribe to our Blog now.

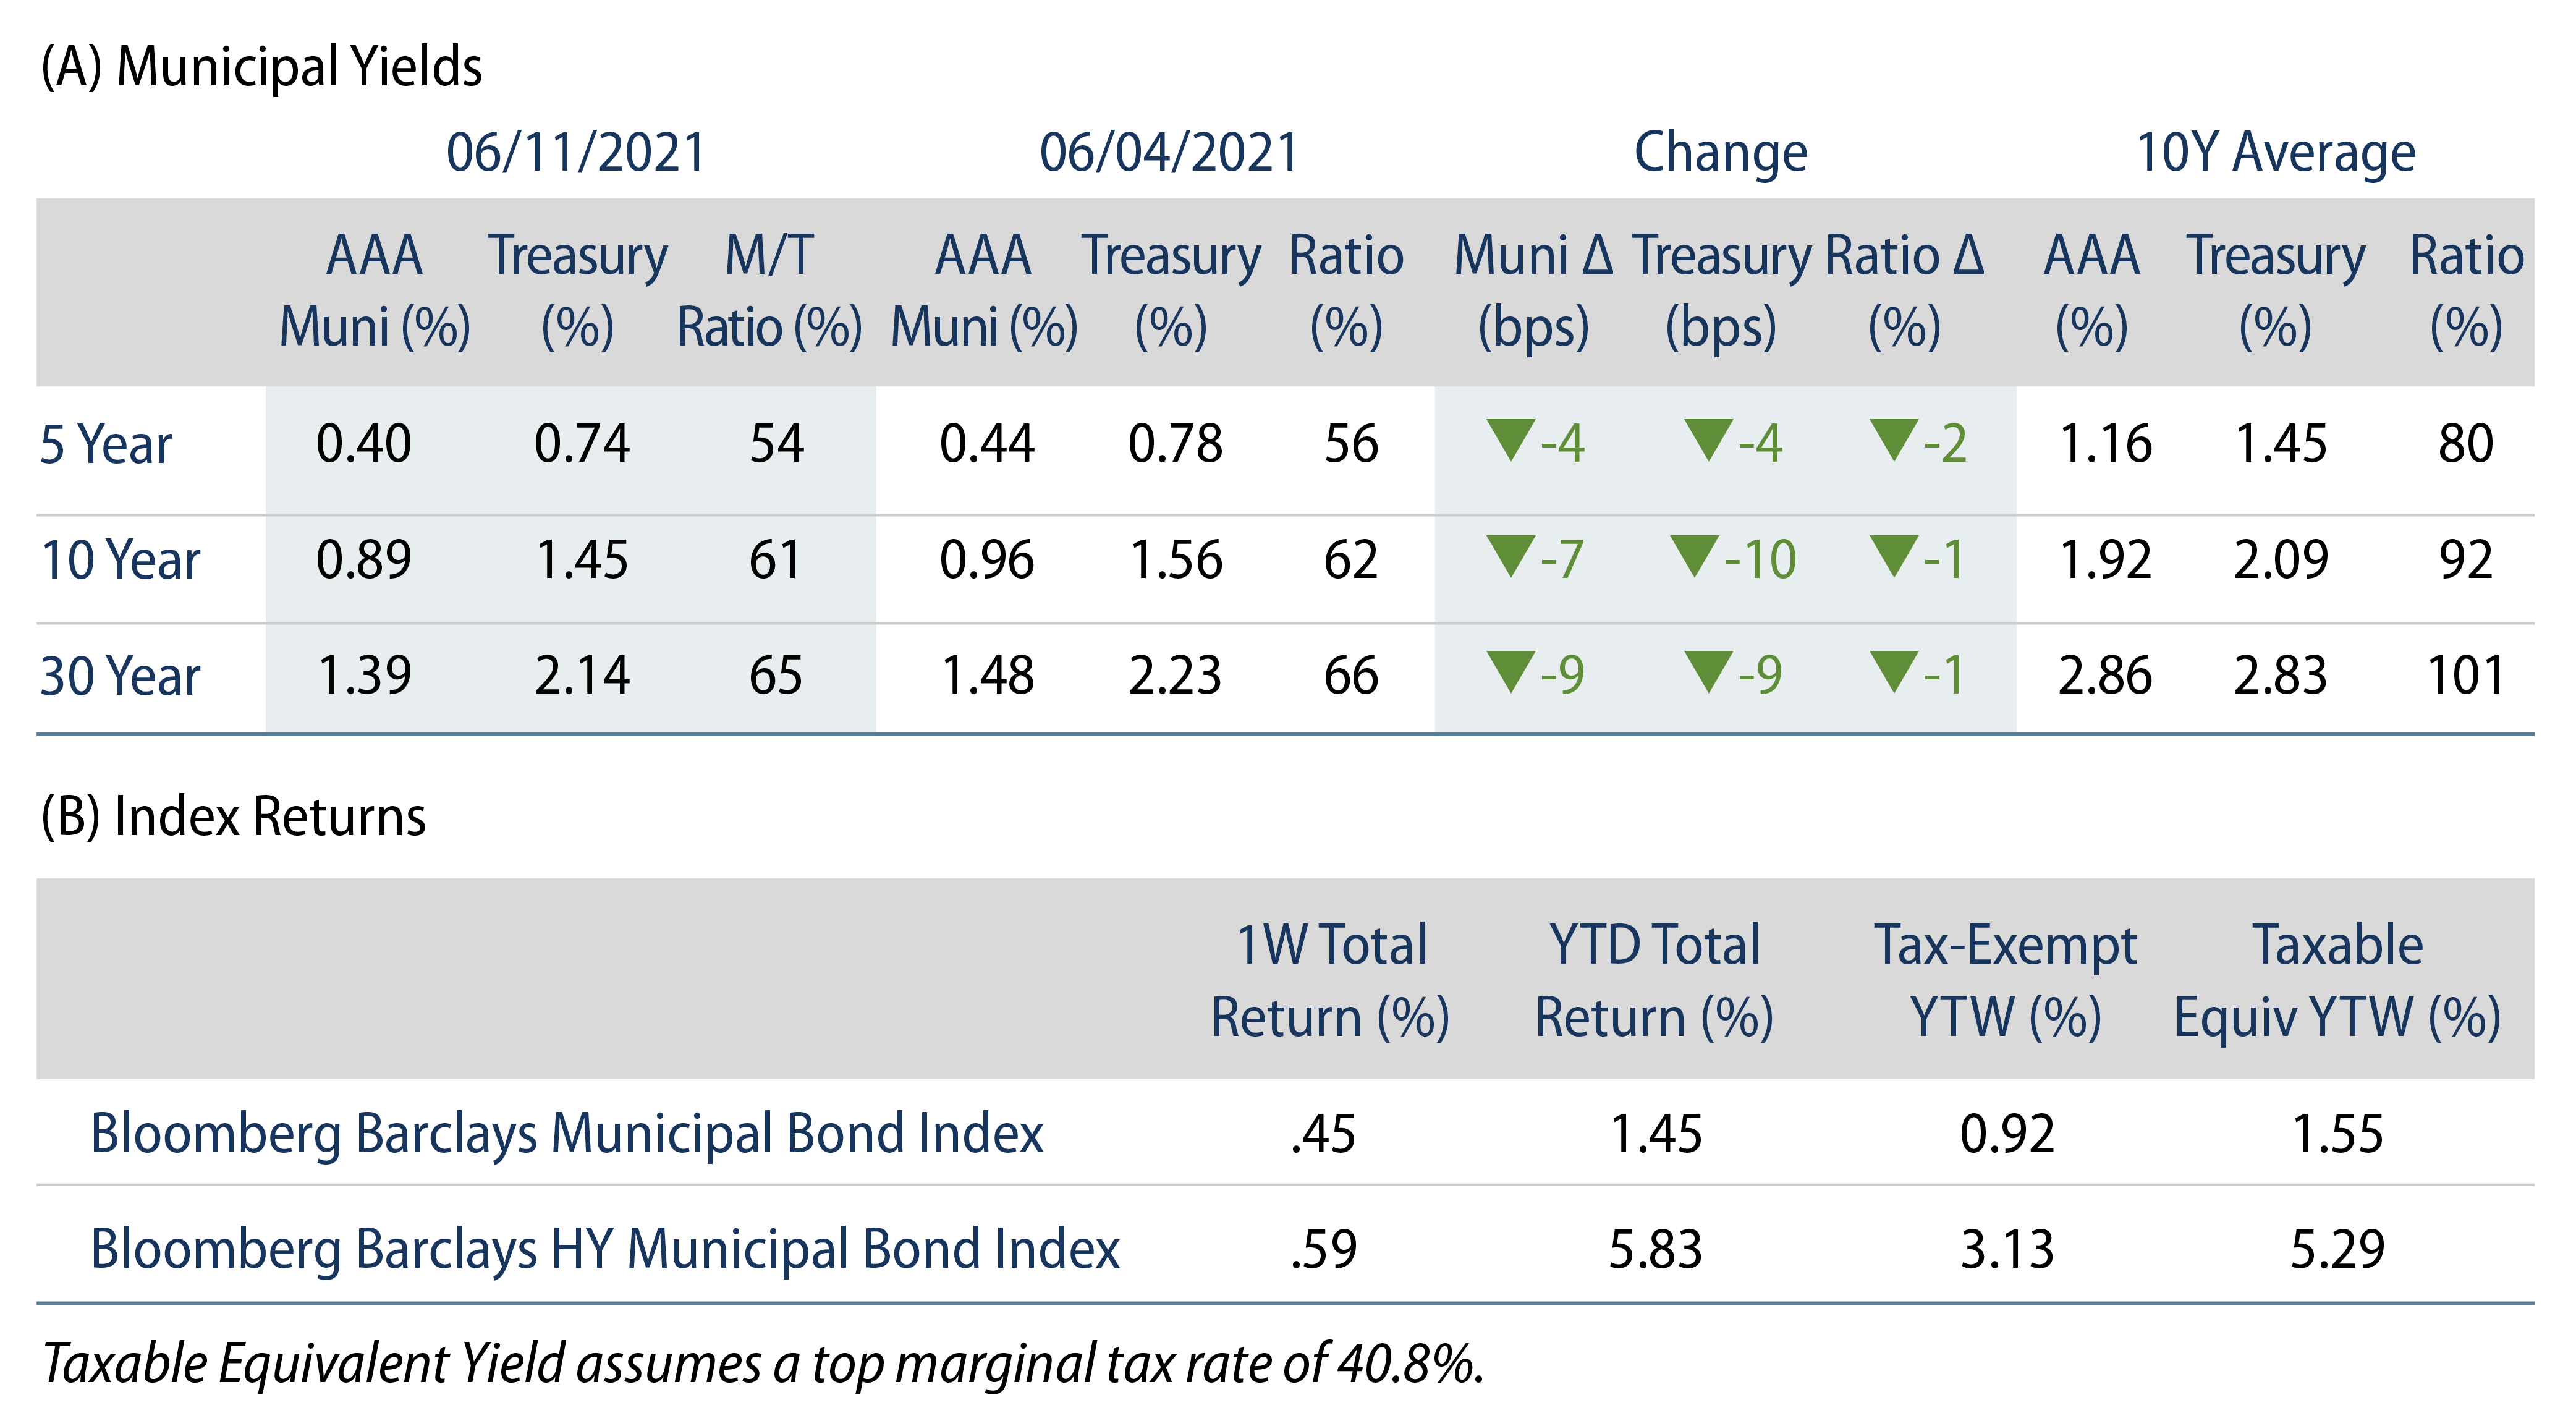
Municipal Yields Moved Lower with Treasuries

US municipal yields moved lower with Treasuries during the week. AAA municipal yields mover 4-9 bps lower across the curve, generally in line with Treasuries. The Bloomberg Barclays Municipal Index returned 0.21%, while the HY Muni Index returned 0.40%. Municipal mutual fund flows maintain a record pace. This week, following the May payroll release, we evaluate implications of lagging payroll trends in the state and local government sector.

Municipal Mutual Fund Flows Maintain Record Pace

Fund Flows: During the week ending June 9, municipal mutual funds recorded $2.5 billion of net inflows. Long-term funds recorded $1.8 billion of inflows, high-yield funds recorded $816 million of inflows and intermediate funds recorded $281 million of inflows. Municipal mutual funds have now recorded inflows 55 of the last 56 weeks totaling $115 billion, with net inflows year-to-date (YTD) maintaining a record pace at $54 billion.

Supply: The muni market recorded $11.7 billion of new-issue volume during the week. Total issuance YTD of $193 billion is 19% higher from last year’s levels, with tax-exempt issuance trending 20% higher year-over-year and taxable issuance 16% higher. This week’s new-issue calendar is expected to remain relatively steady at $12.3 billion of new issuance. The largest deals include $1.8 billion taxable New York Dormitory Authority (personal income tax) and $811 million Port of Seattle transactions.

This Week in Munis: Muni Payrolls Continue to Lag, Despite Stimulus

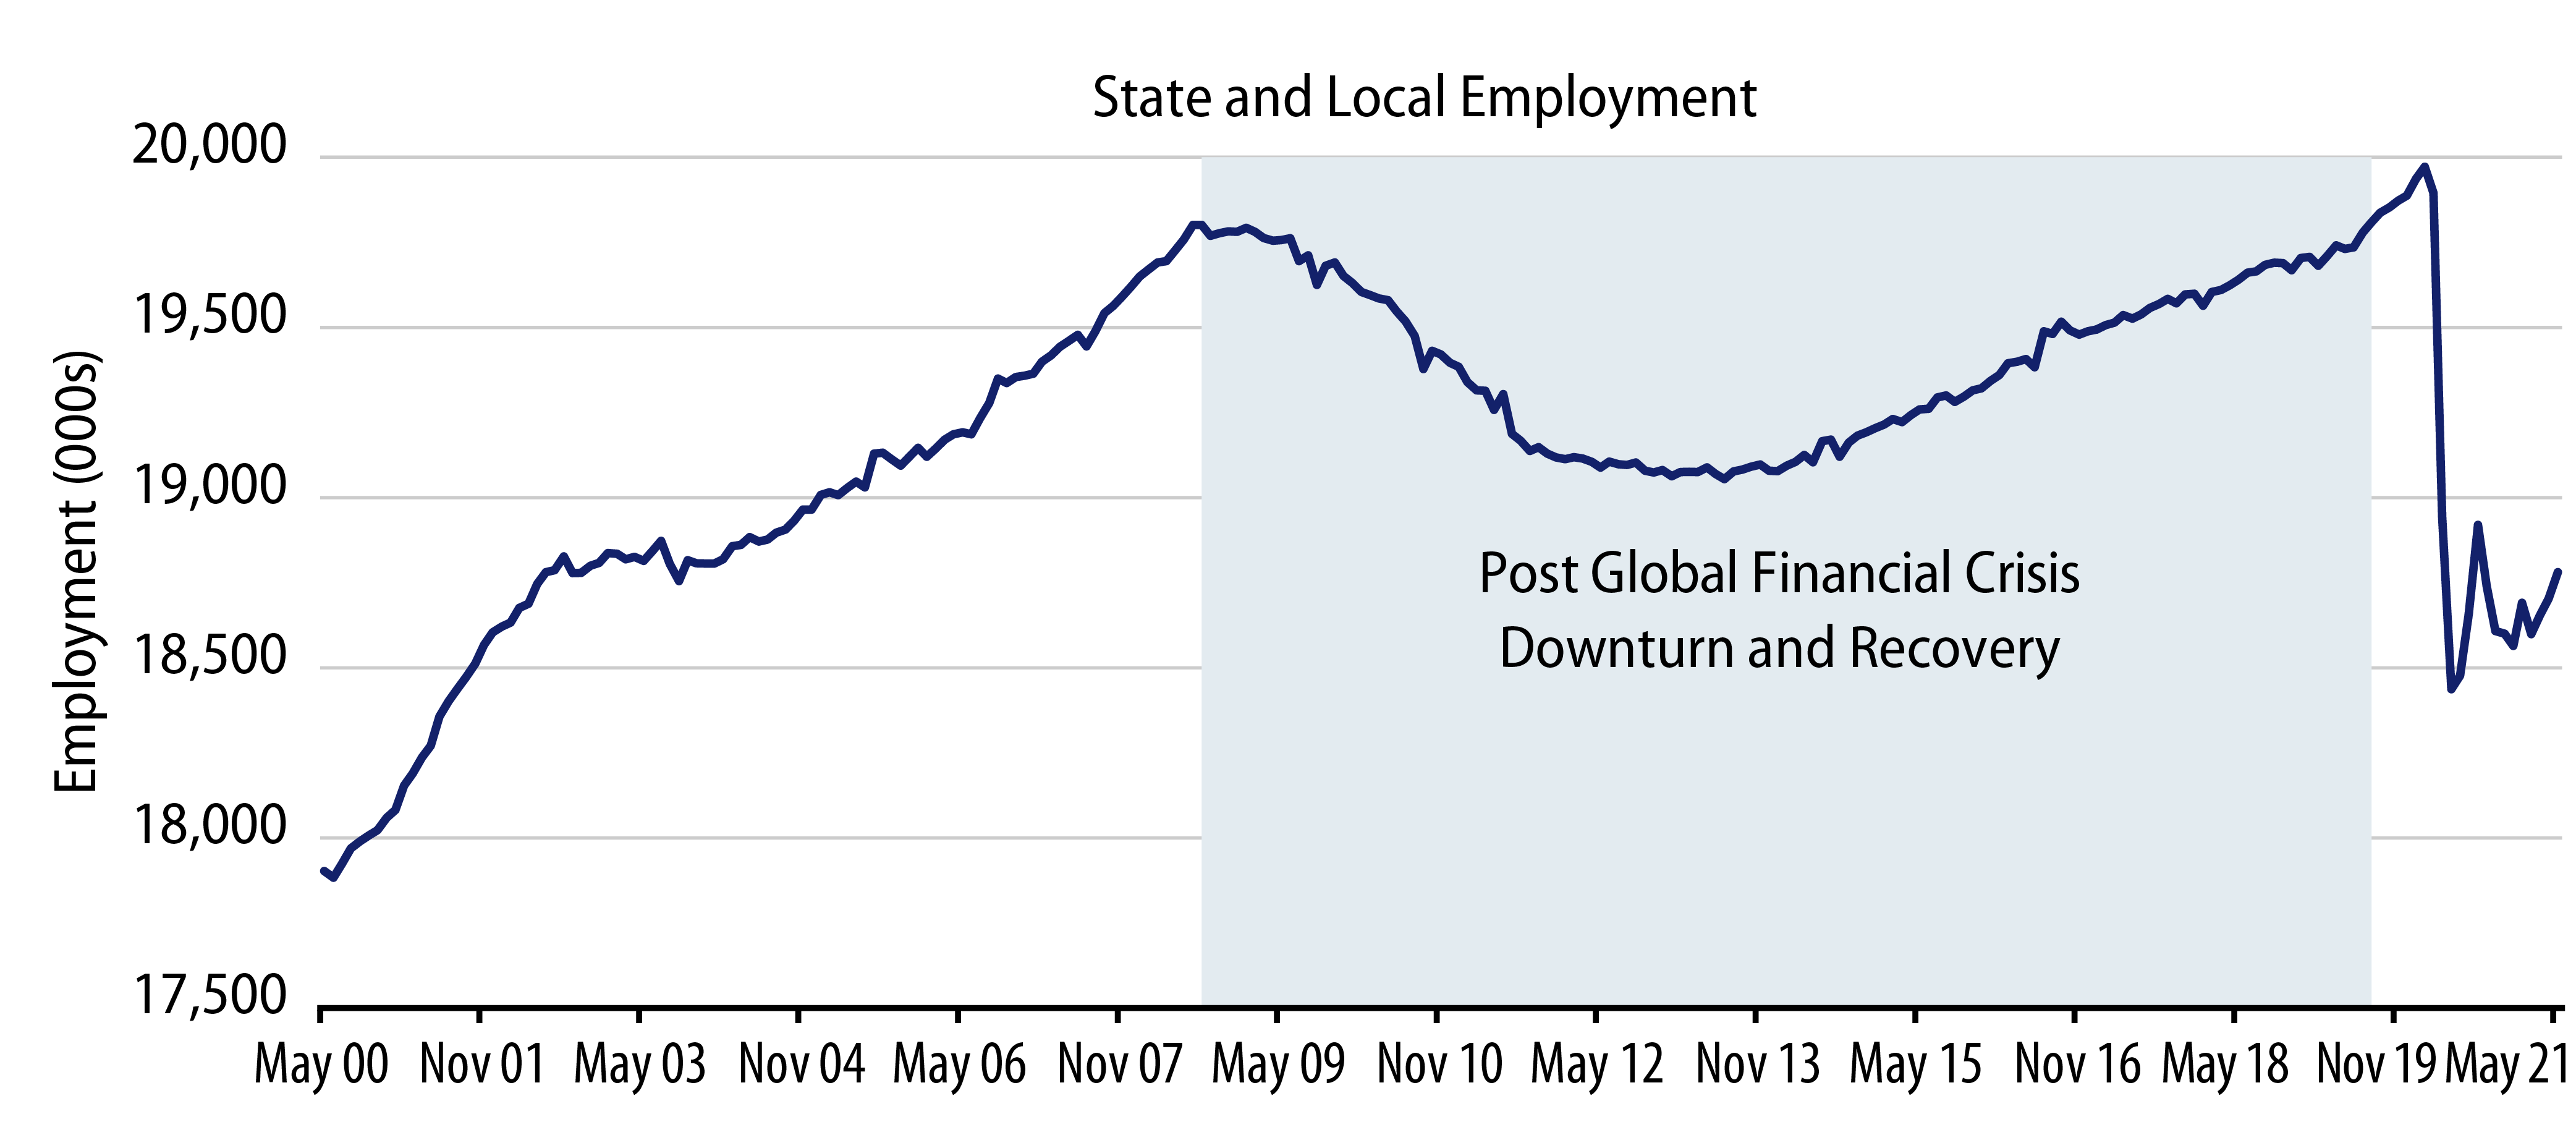
The state and local government sector is among the nation’s largest employment drivers, comprising 13.0% of total nonfarm payrolls. The nonfarm payroll figure released this month highlighted a gain of 559,000 new jobs (+0.4%) during May, while state and local payrolls were generally unchanged over the month. While the nation’s total nonfarm payrolls have increased 14.7 million (+11.3%) from the trough of the pandemic in April 2020, total payrolls remain 4% below February 2020 highs. Although the pandemic-driven state and local payroll decline followed the national trend, state and local payrolls diverged over the recent recovery period, declining 162,000 (-0.8%) from April 2020 to May 2021.

Exhibit 1: Change in Nonfarm Payrolls (April 2020 to May 2021)
Explore Change in Nonfarm Payrolls (April 2020 to May 2021)
Source: Bureau of Labor Statistics. As of 31 May 21. Select the image to expand the view.

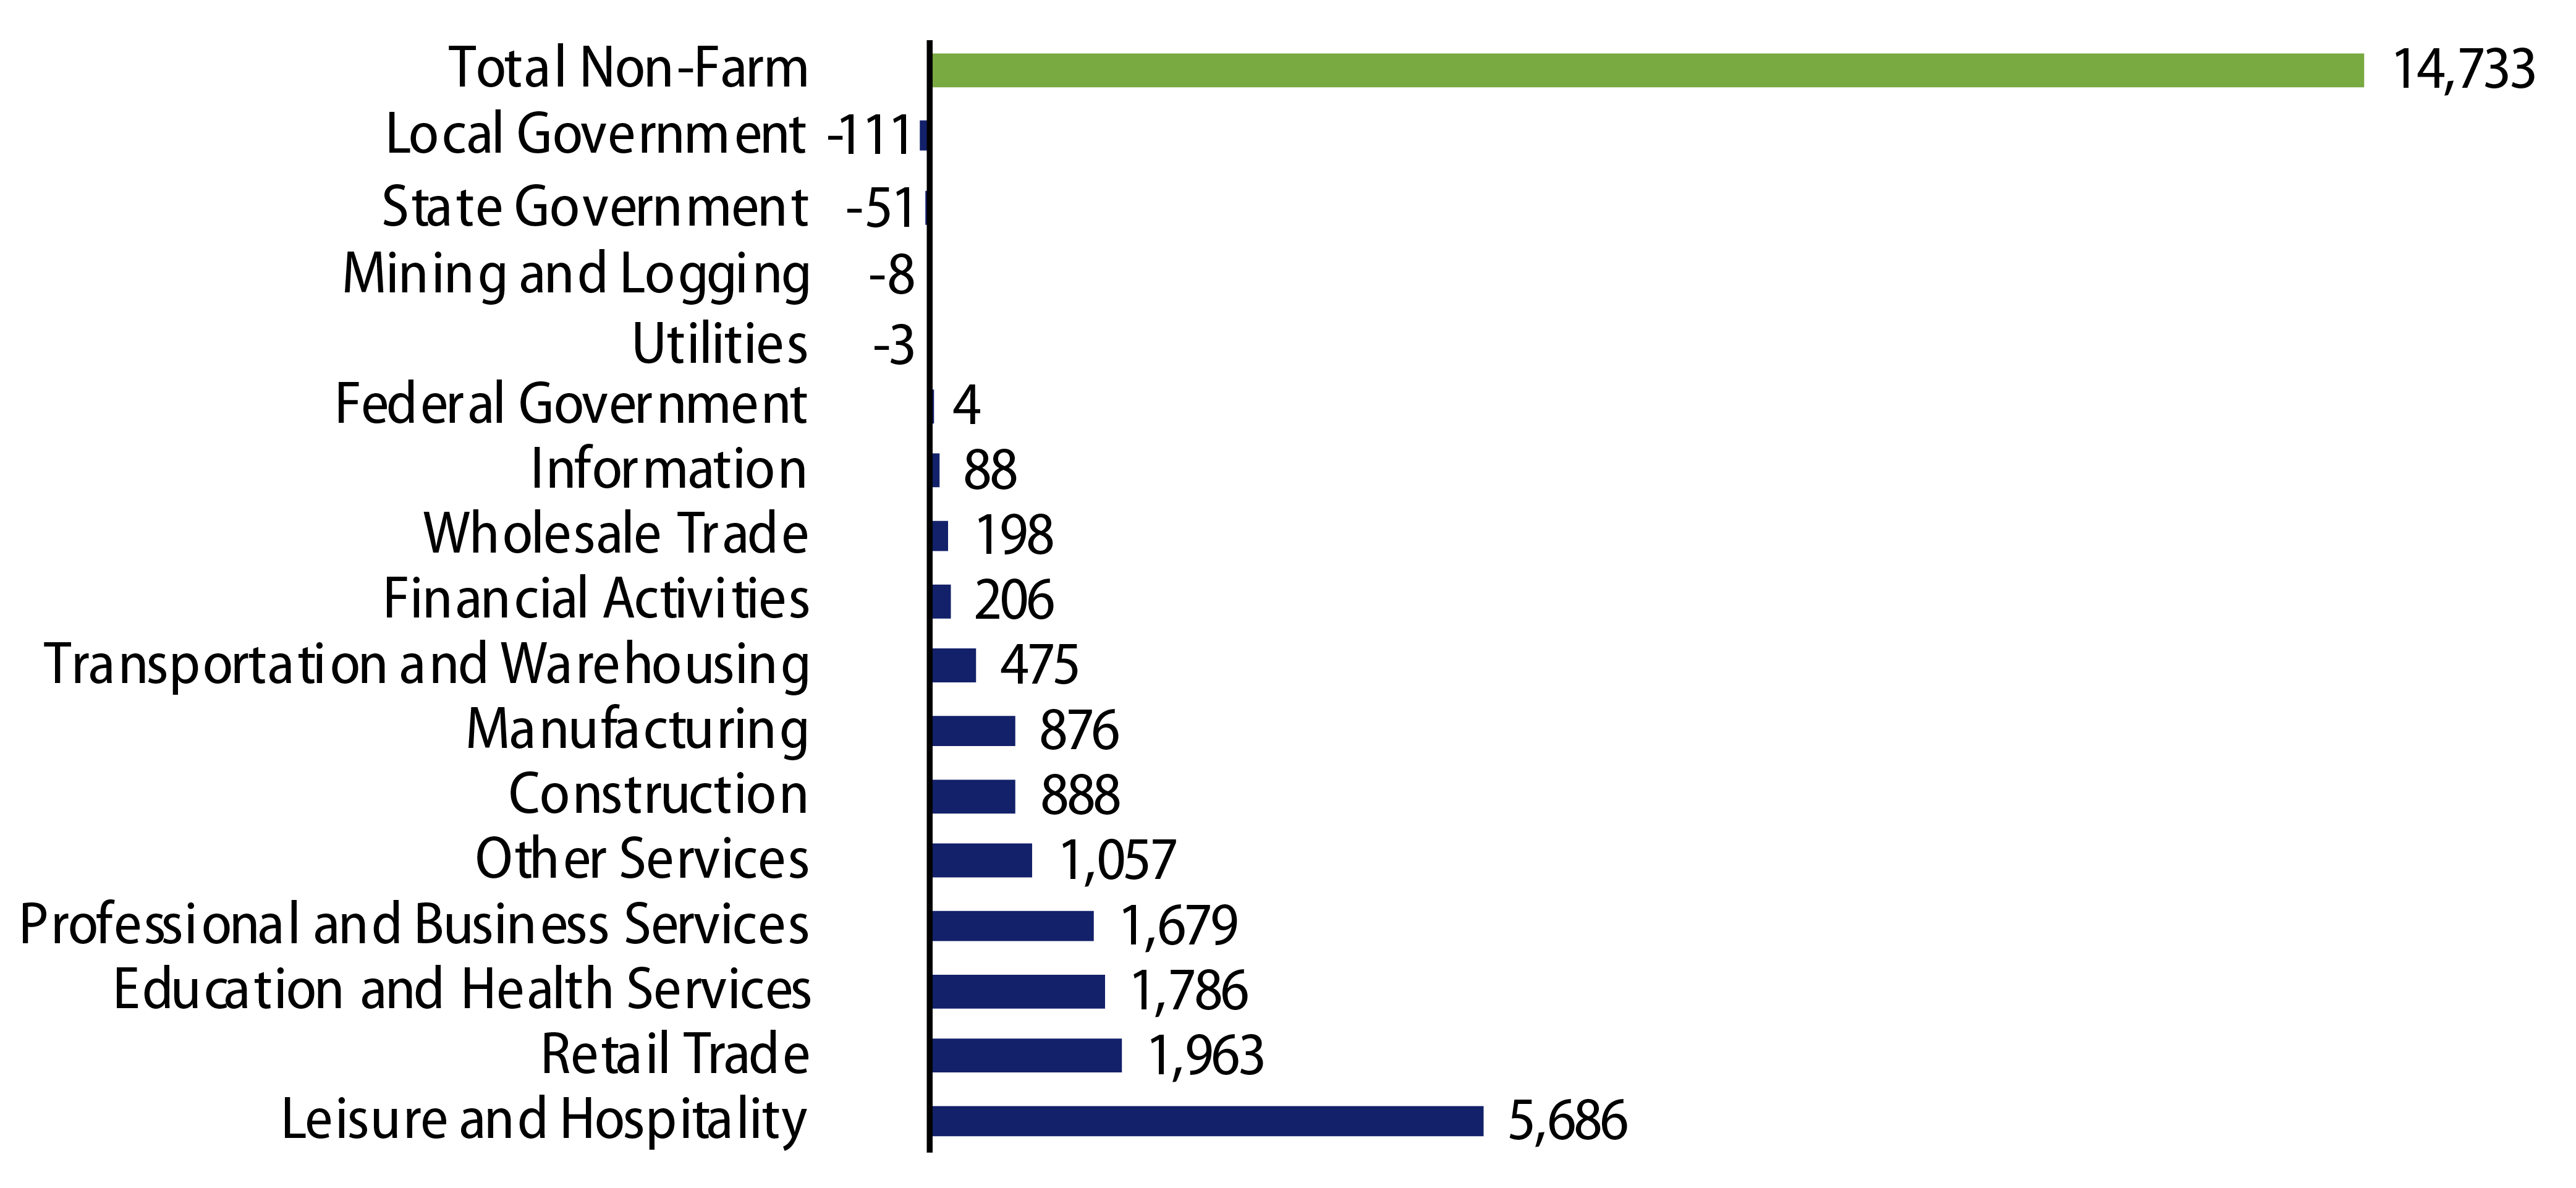
State and local employment has declined by 1.2 million workers (-6.0%) since the high levels observed in February 2020. During this period, local payrolls declined 921,000 (-6.3%), while state employment declined by 176,000 workers (-3.4%). The majority of state and local reductions were associated with the education sector, with local governments suspending 556,400 education positions (-6.9%) and states shelving 244,000 education positions (-9.4%). Local non-education positions declined 354,600 (-5.3%) and state non-education positions declined 35,500 (-1.3%). The largest non-education sector includes local administration (police, fire, and social services), and while it is down just 4% from pre-Covid levels, it has not shown any growth in 2021.

Exhibit 2: State and Local Employment Trends—Education vs. Non-Education Sectors
Explore State and Local Employment Trends—Education vs. Non-Education Sectors
Source: Bureau of Labor Statistics. As of 31 May 21. Select the image to expand the view.

The state and local employment decline was a key issue highlighted to rationalize the $350 billion direct state and local aid package within Biden’s American Rescue Plan. However, since its passage, we have not observed a material rebound in state and local hiring. As schools reopen and federal aid is disbursed we expect state and local employment will increase, but a full state and local government job recovery could take longer than some expect. It took over 10 years for state and local government employment to retrace a relatively lower degree of job losses following the global financial crisis (GFC), when subsequent austerity measures led to 800,000 state and local job losses before fully recovering to the 19.8 million high watermark seen in August 2008. While states and localities are undoubtedly in a better fiscal position than they were following the GFC, the demand for non-education workers could remain challenged, particularly as certain states and locals grapple with elevated fixed costs such as pension payments.

Exhibit 3: Post Global Financial Crisis Downturn and Recovery
Explore Post Global Financial Crisis Downturn and Recovery
Source: Bureau of Labor Statistics. As of 31 May 21. Select the image to expand the view.

While lower levels of employment should provide additional budget relief and be broadly supportive of state and local issuer credit, higher unemployment levels could serve as a longer-term drag on regional growth trends, and have a larger impact on issuers with higher socioeconomic dependence on the sector. We remain cautious on issuers and regions with limited economic diversity in evaluating opportunities in the sector, particularly considering the strong technicals in the market that have led to limited spread differentiation of such risk.

Exhibit 4: Municipal Bond Yields and Index Return
Explore Municipal Bond Yields and Index Return
Sources: (A) Muni yields: Thomson Reuters MMD; Treasury Yields: Bloomberg. As of 11 Jun 21. (B) Bloomberg. As of 11 Jun 21. Select the image to expand the view.
Exhibit 5: Tax-Exempt and Taxable Municipal Valuation
Explore Tax-Exempt and Taxable Municipal Valuation
Sources: (A) Bloomberg, Western Asset. AAA, AA, A, BBB Corporate Indices. After-tax yield assumes a top effective tax rate of 40.8%. As of 11 Jun 21. (B) Bloomberg, Western Asset; Taxable Muni Index Corporate comparable used is the long corporate (ex. BBB) to better align credit quality and duration. Select the image to expand the view.
© Western Asset Management Company, LLC 2024. The information contained in these materials ("the materials") is intended for the exclusive use of the designated recipient ("the recipient"). This information is proprietary and confidential and may contain commercially sensitive information, and may not be copied, reproduced or republished, in whole or in part, without the prior written consent of Western Asset Management Company ("Western Asset").
Past performance does not predict future returns. These materials should not be deemed to be a prediction or projection of future performance. These materials are intended for investment professionals including professional clients, eligible counterparties, and qualified investors only.
These materials have been produced for illustrative and informational purposes only. These materials contain Western Asset's opinions and beliefs as of the date designated on the materials; these views are subject to change and may not reflect real-time market developments and investment views.
Third party data may be used throughout the materials, and this data is believed to be accurate to the best of Western Asset's knowledge at the time of publication, but cannot be guaranteed. These materials may also contain strategy or product awards or rankings from independent third parties or industry publications which are based on unbiased quantitative and/or qualitative information determined independently by each third party or publication. In some cases, Western Asset may subscribe to these third party's standard industry services or publications. These standard subscriptions and services are available to all asset managers and do not influence rankings or awards in any way.
Investment strategies or products discussed herein may involve a high degree of risk, including the loss of some or all capital. Investments in any products or strategies described in these materials may be volatile, and investors should have the financial ability and willingness to accept such risks.
Unless otherwise noted, investment performance contained in these materials is reflective of a strategy composite. All other strategy data and information included in these materials reflects a representative portfolio which is an account in the composite that Western Asset believes most closely reflects the current portfolio management style of the strategy. Performance is not a consideration in the selection of the representative portfolio. The characteristics of the representative portfolio shown may differ from other accounts in the composite. Information regarding the representative portfolio and the other accounts in the composite are available upon request. Statements in these materials should not be considered investment advice. References, either general or specific, to securities and/or issuers in the materials are for illustrative purposes only and are not intended to be, and should not be interpreted as, recommendation to purchase or sell such securities. Employees and/or clients of Western Asset may have a position in the securities or issuers mentioned.
These materials are not intended to provide, and should not be relied on for, accounting, legal, tax, investment or other advice. The recipient should consult its own counsel, accountant, investment, tax, and any other advisers for this advice, including economic risks and merits, related to making an investment with Western Asset. The recipient is responsible for observing the applicable laws and regulations of their country of residence.
Founded in 1971, Western Asset Management Company is a global fixed-income investment manager with offices in Pasadena, New York, London, Singapore, Tokyo, Melbourne, São Paulo, Hong Kong, and Zürich. Western Asset is a wholly owned subsidiary of Franklin Resources, Inc. but operates autonomously. Western Asset is comprised of six legal entities across the globe, each with distinct regional registrations: Western Asset Management Company, LLC, a registered Investment Adviser with the Securities and Exchange Commission; Western Asset Management Company Distribuidora de Títulos e Valores Mobiliários Limitada is authorized and regulated by Comissão de Valores Mobiliários and Brazilian Central Bank; Western Asset Management Company Pty Ltd ABN 41 117 767 923 is the holder of the Australian Financial Services License 303160; Western Asset Management Company Pte. Ltd. Co. Reg. No. 200007692R is a holder of a Capital Markets Services License for fund management and regulated by the Monetary Authority of Singapore; Western Asset Management Company Ltd, a registered Financial Instruments Business Operator and regulated by the Financial Services Agency of Japan; and Western Asset Management Company Limited is authorised and regulated by the Financial Conduct Authority ("FCA") (FRN 145930). This communication is intended for distribution to Professional Clients only if deemed to be a financial promotion in the UK as defined by the FCA. This communication may also be intended for certain EEA countries where Western Asset has been granted permission to do so. For the current list of the approved EEA countries please contact Western Asset at +44 (0)20 7422 3000.