Macros, Markets and Munis
Municipals posted positive returns last week as economic data came in weaker and rates trended lower. Treasury yields rallied 6-16 basis points (bps) across the curve, while high-grade munis generally trailed rates lower and underperformed amid persistent elevated supply conditions. As geopolitical tensions eased, fixed-income markets focused on Federal Reserve rhetoric, which signaled likely cuts later this year. This was supported by weaker-than-anticipated economic data as consumer confidence fell below expectations and 1Q GDP came in at -0.5%, well below the prior quarter and expectations of -0.2%. Meanwhile, muni supply remained elevated amid modest inflows.
Muni Issuance Remained Elevated Despite the Holiday
Fund Flows (up $77 million): During the week ending June 25, weekly reporting municipal mutual funds recorded $77 million of net inflows, according to Lipper. Short and short-intermediate categories recorded the majority inflows, at $134 million collectively. Long-term funds recorded $156 million of outflows, intermediate funds recorded $99 million of inflows and high-yield funds recorded $45 million of inflows. Last week’s inflows marked a ninth consecutive week of inflows and led year-to-date (YTD) inflows higher to $10 billion.
Supply (YTD supply of $278 billion; up 27% YoY): The muni market recorded $13 billion of new-issue supply last week, remaining at elevated levels. YTD new-issue supply of $287 billion is 27% higher than the prior record year’s pace, with tax-exempt issuance up 8% and taxable issuance up 29%, respectively. This week’s calendar is expected to decline to $7 billion ahead of the July 4 holiday. The largest deals include $939 million Massachusetts Bay Transportation Authority and $834 million Kentucky Public Energy Authority transactions.
This Week in Munis: Mid-Year Update
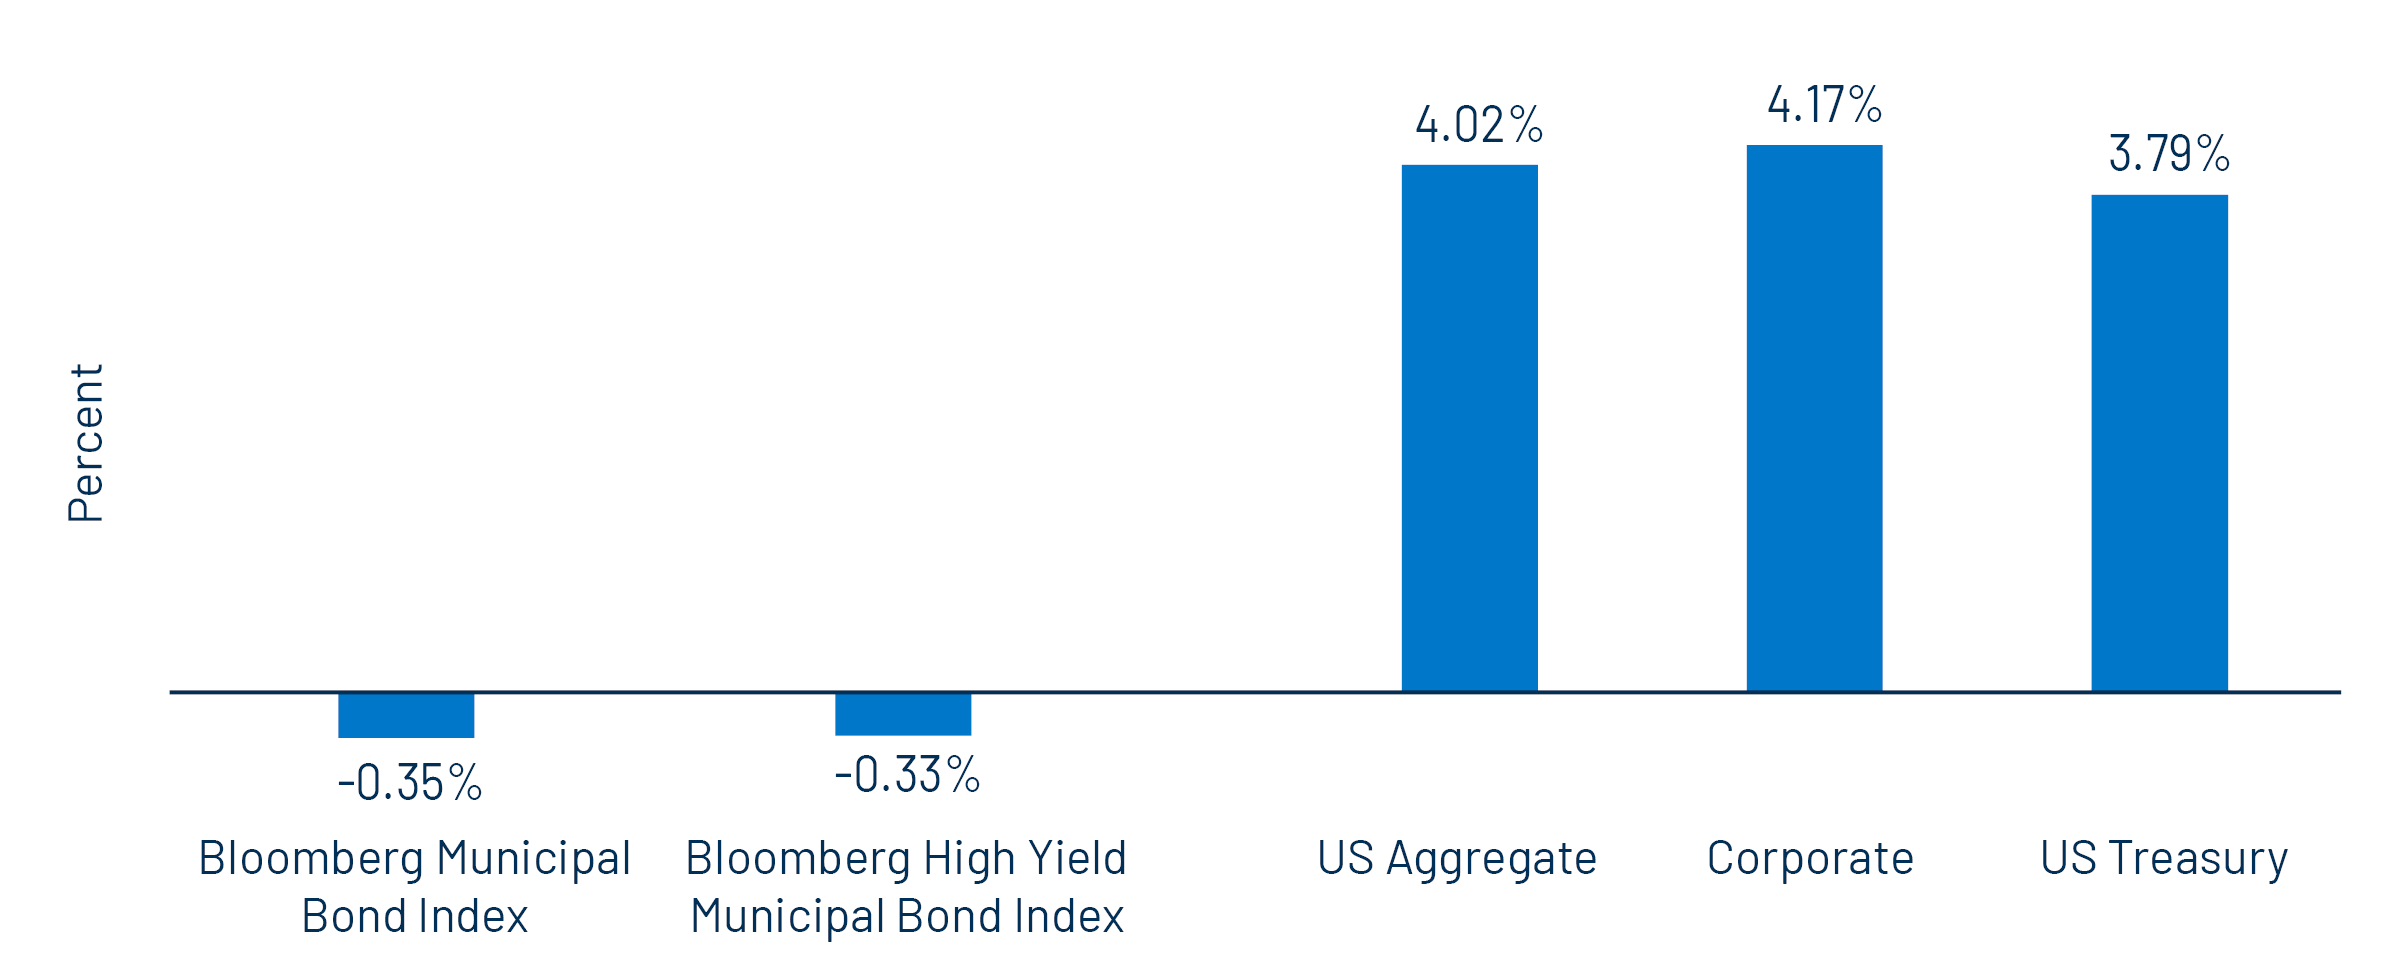
PerformanceThe muni market posted negative returns in the first half of the year as the market contended with record supply levels, tax season weakness and broader rate volatility associated with the potential outcomes of tariff policies. The investment-grade Bloomberg Municipal Bond Index returned -0.35% in the first half of the year, underperforming the stronger returns observed in taxable fixed-income markets. Shorter-duration securities generally outperformed as the municipal yield curve steepened, with longer-maturity yields moving higher and shorter-maturity yields moving lower, contrasting with the Treasury market, where yields moved lower across most maturities.
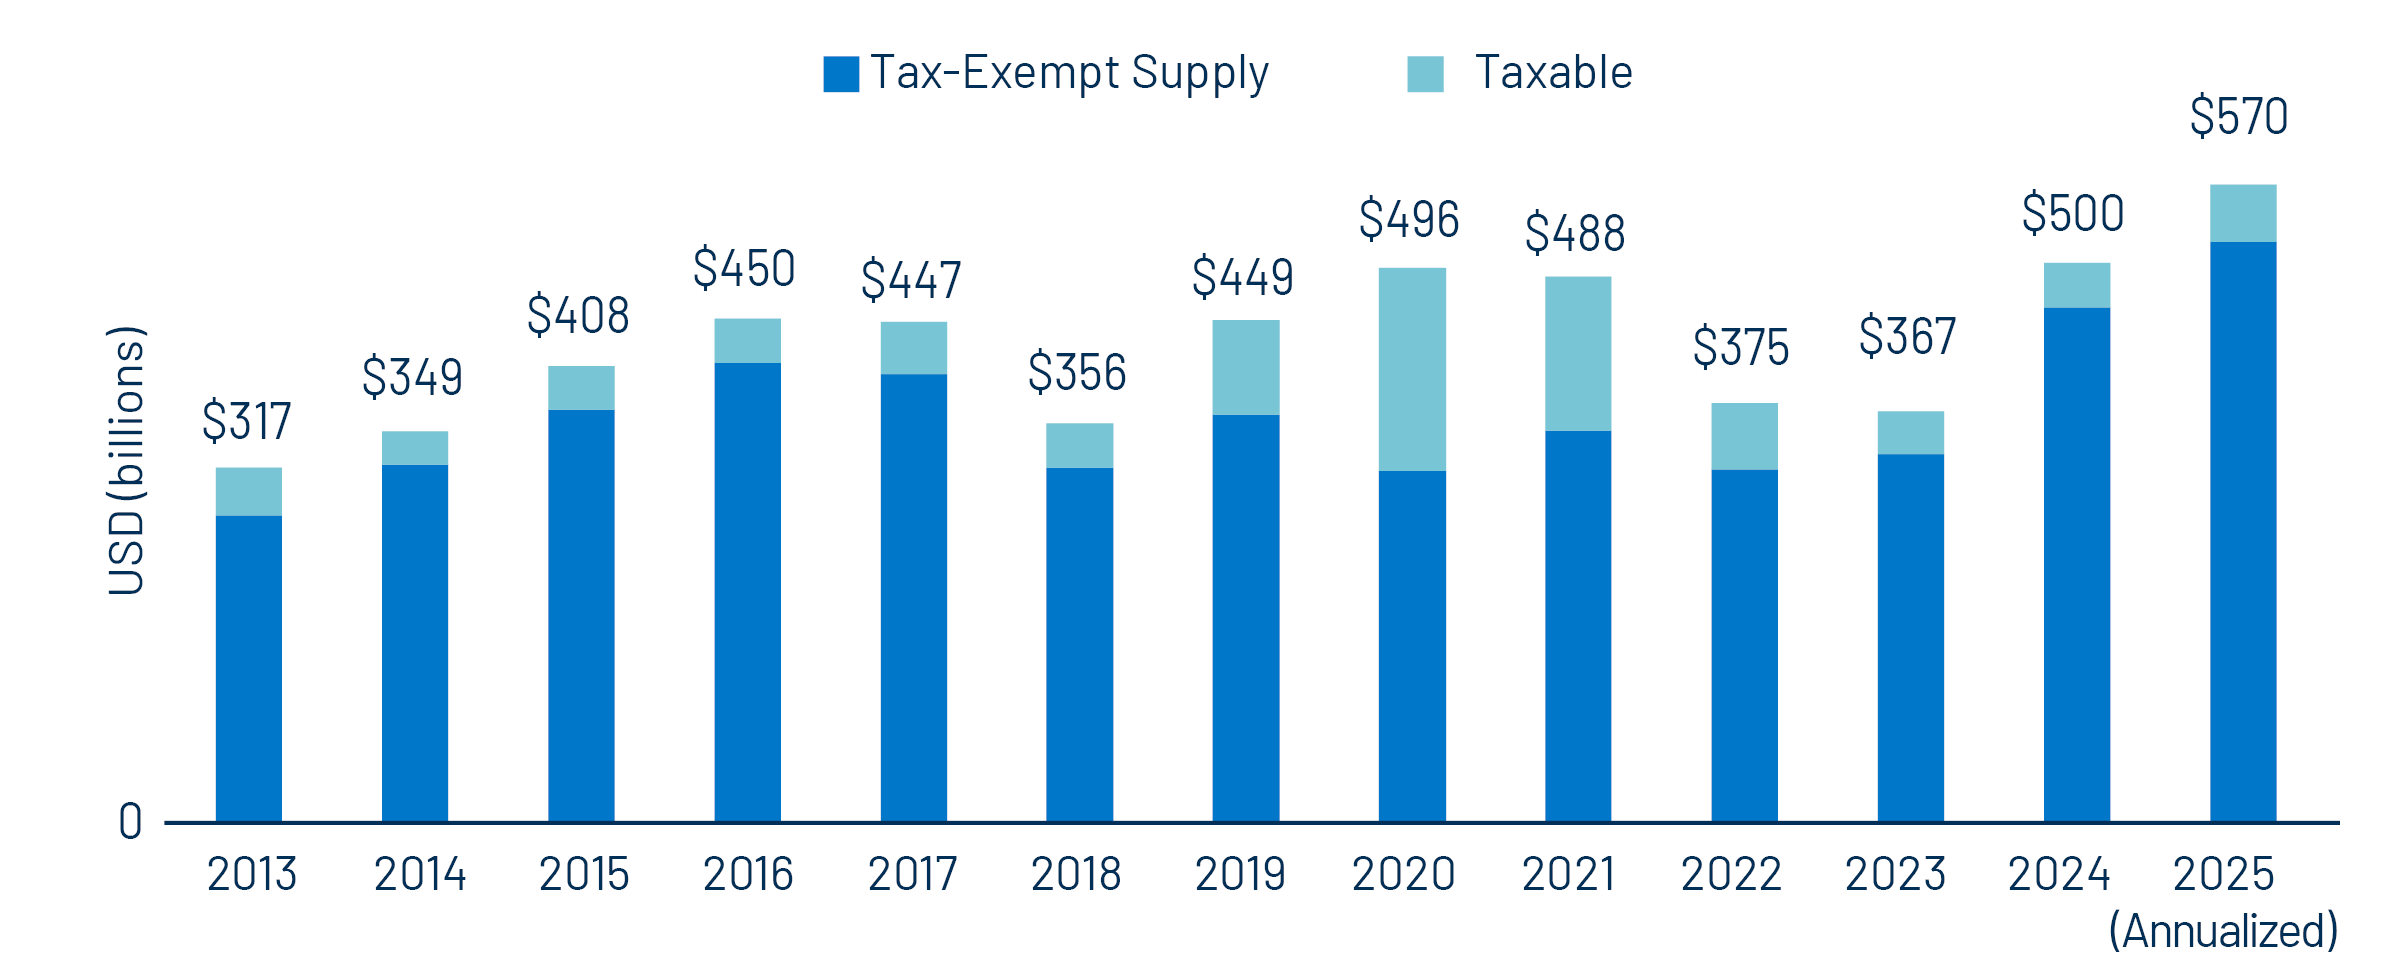
Supply/DemandNew issuance reached $285 billion in the first half of the year, up 19% from 1H24, a record level itself. Tax-exempt municipal issuance of $259 billion was up 18% year-over-year (YoY). Taxable supply of $26 billion was 21% higher than the levels of the prior year. Muni supply is on pace to reach $570 billion in 2025, $70 billion (+14%) above last year’s record levels.
Municipal mutual funds recorded approximately $10 billion of net inflows in the first half of the year, according to Lipper. YTD fund flows were largely concentrated in short and short/intermediate strategies, which recorded over $6 billion of inflows. High-yield municipals also recorded strong flows of $4 billion. While positive, when considering the $52 billion of net inflows recorded since January 2024, demand for municipal funds remains limited relative to the magnitude of the greater than $120 billion of outflows observed in 2022 and 2023.
FundamentalsThe Census released 1Q25 state and local tax collection estimates, which indicated continued revenue growth for state and local governments. First quarter major state and local government tax collections increased 5.2% from 1Q24 levels to $512 billion. Among the major state revenue sources, individual income taxes increased 10%, corporate income tax collections increased 8% and sales tax collections increased 2% YoY. Property tax collections, the primary source of revenues for local governments, increased 4% YoY to $194 billion.
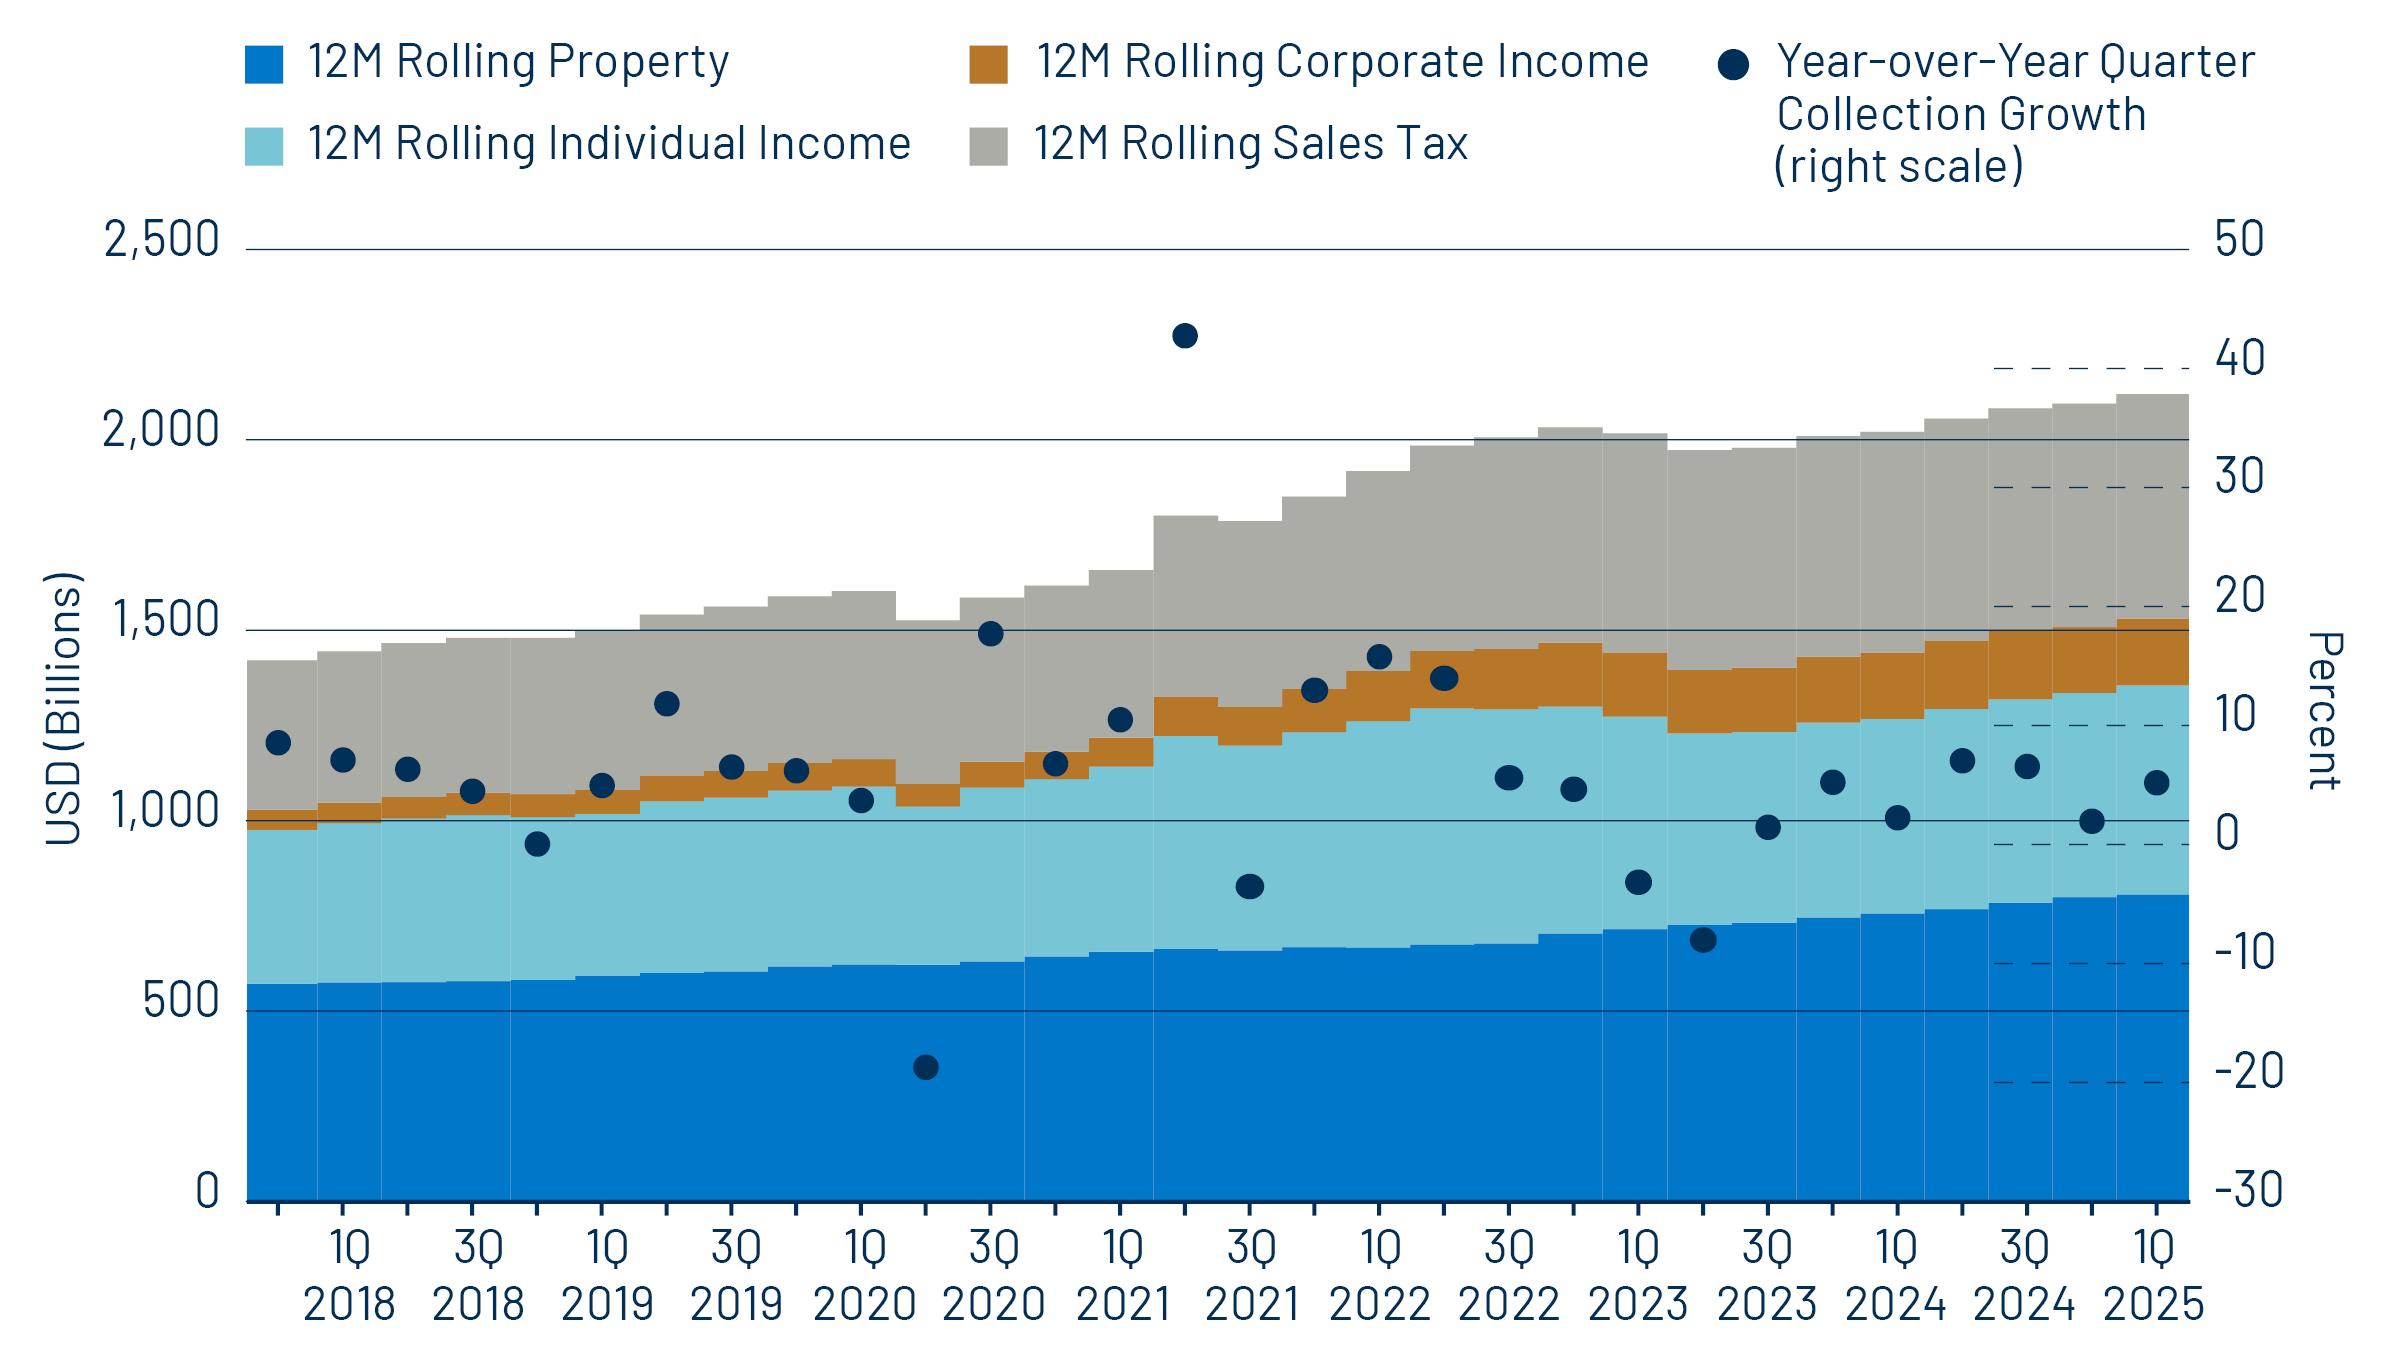
While credit fundamentals remain generally strong, they show signs of slowing. The pace of credit rating improvement from the three major rating agencies slowed in 1H25. According to Bloomberg data, total entities upgraded (620) continued to exceed downgrades (472); however, total downgrades by par value of $122 billion outpaced upgrades of $112 billion. Meanwhile, first-time payment defaults totaled $1 billion, exceeding the prior year level of $711 million.
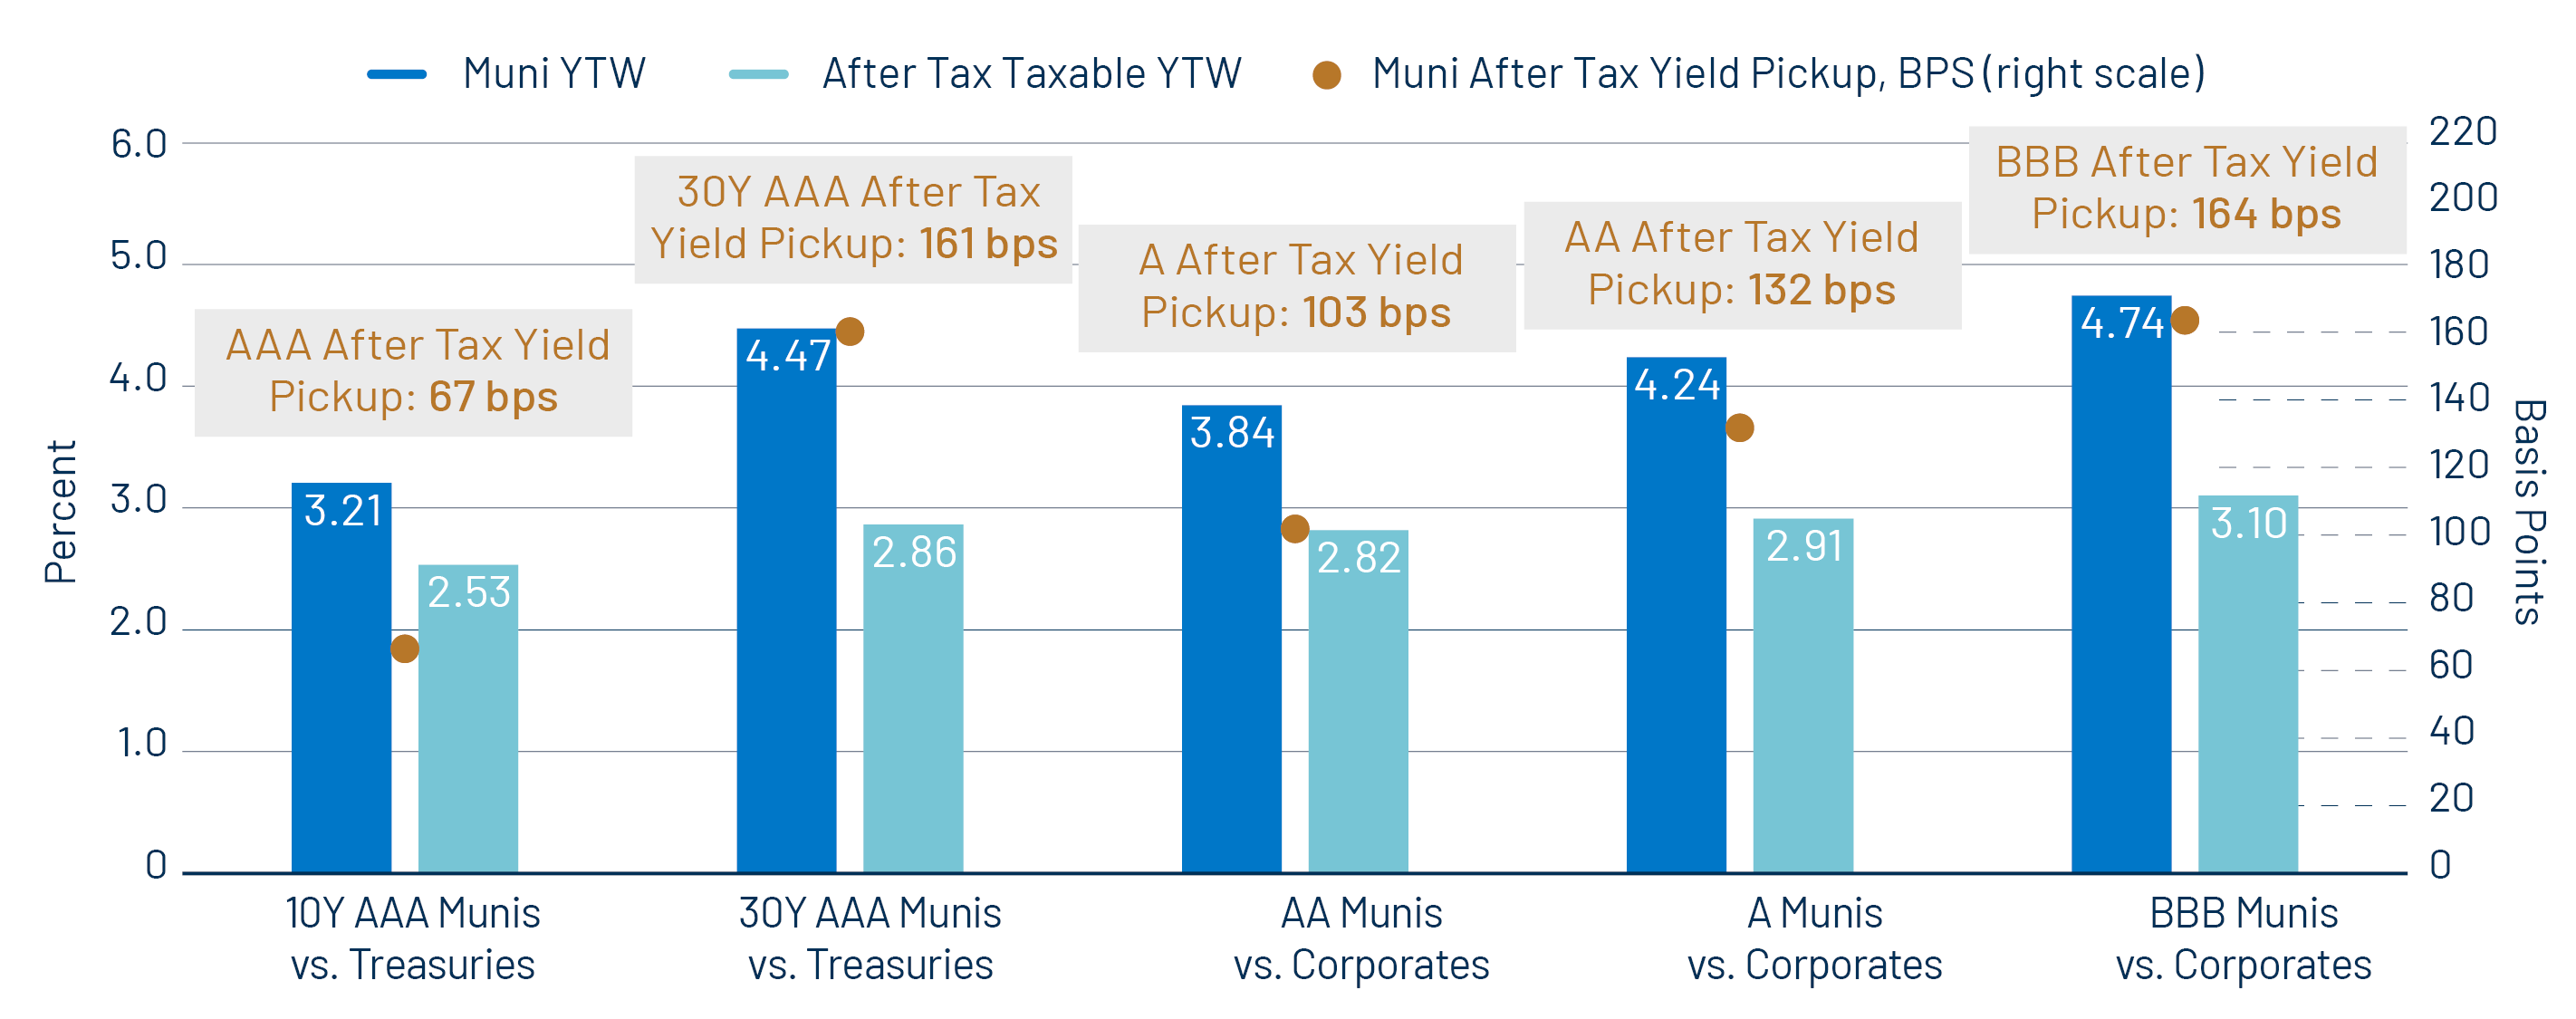
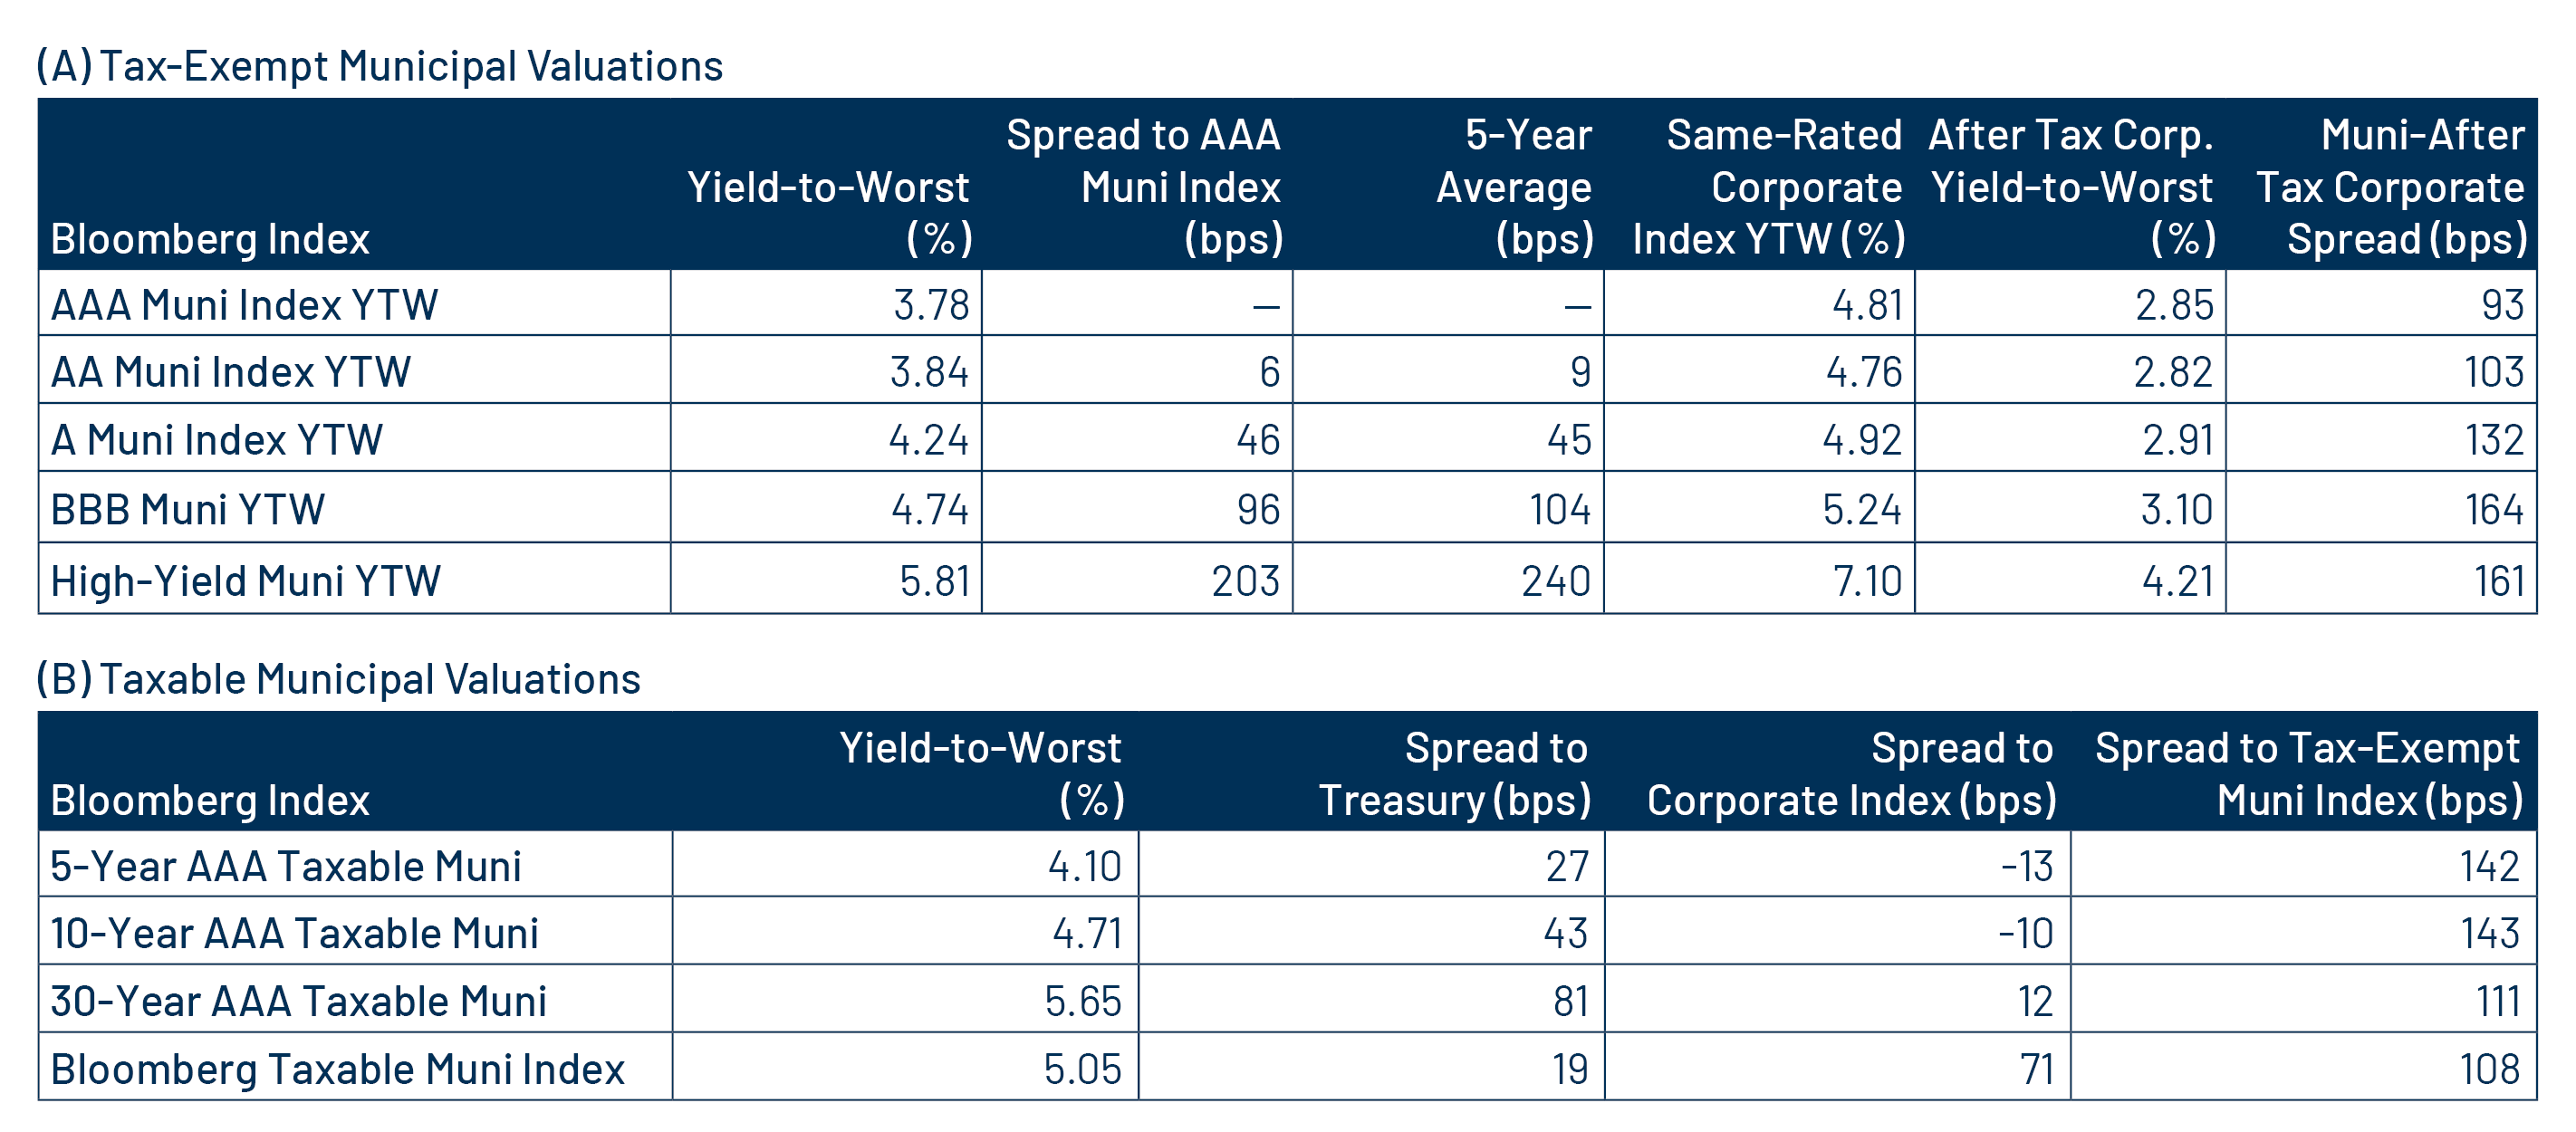
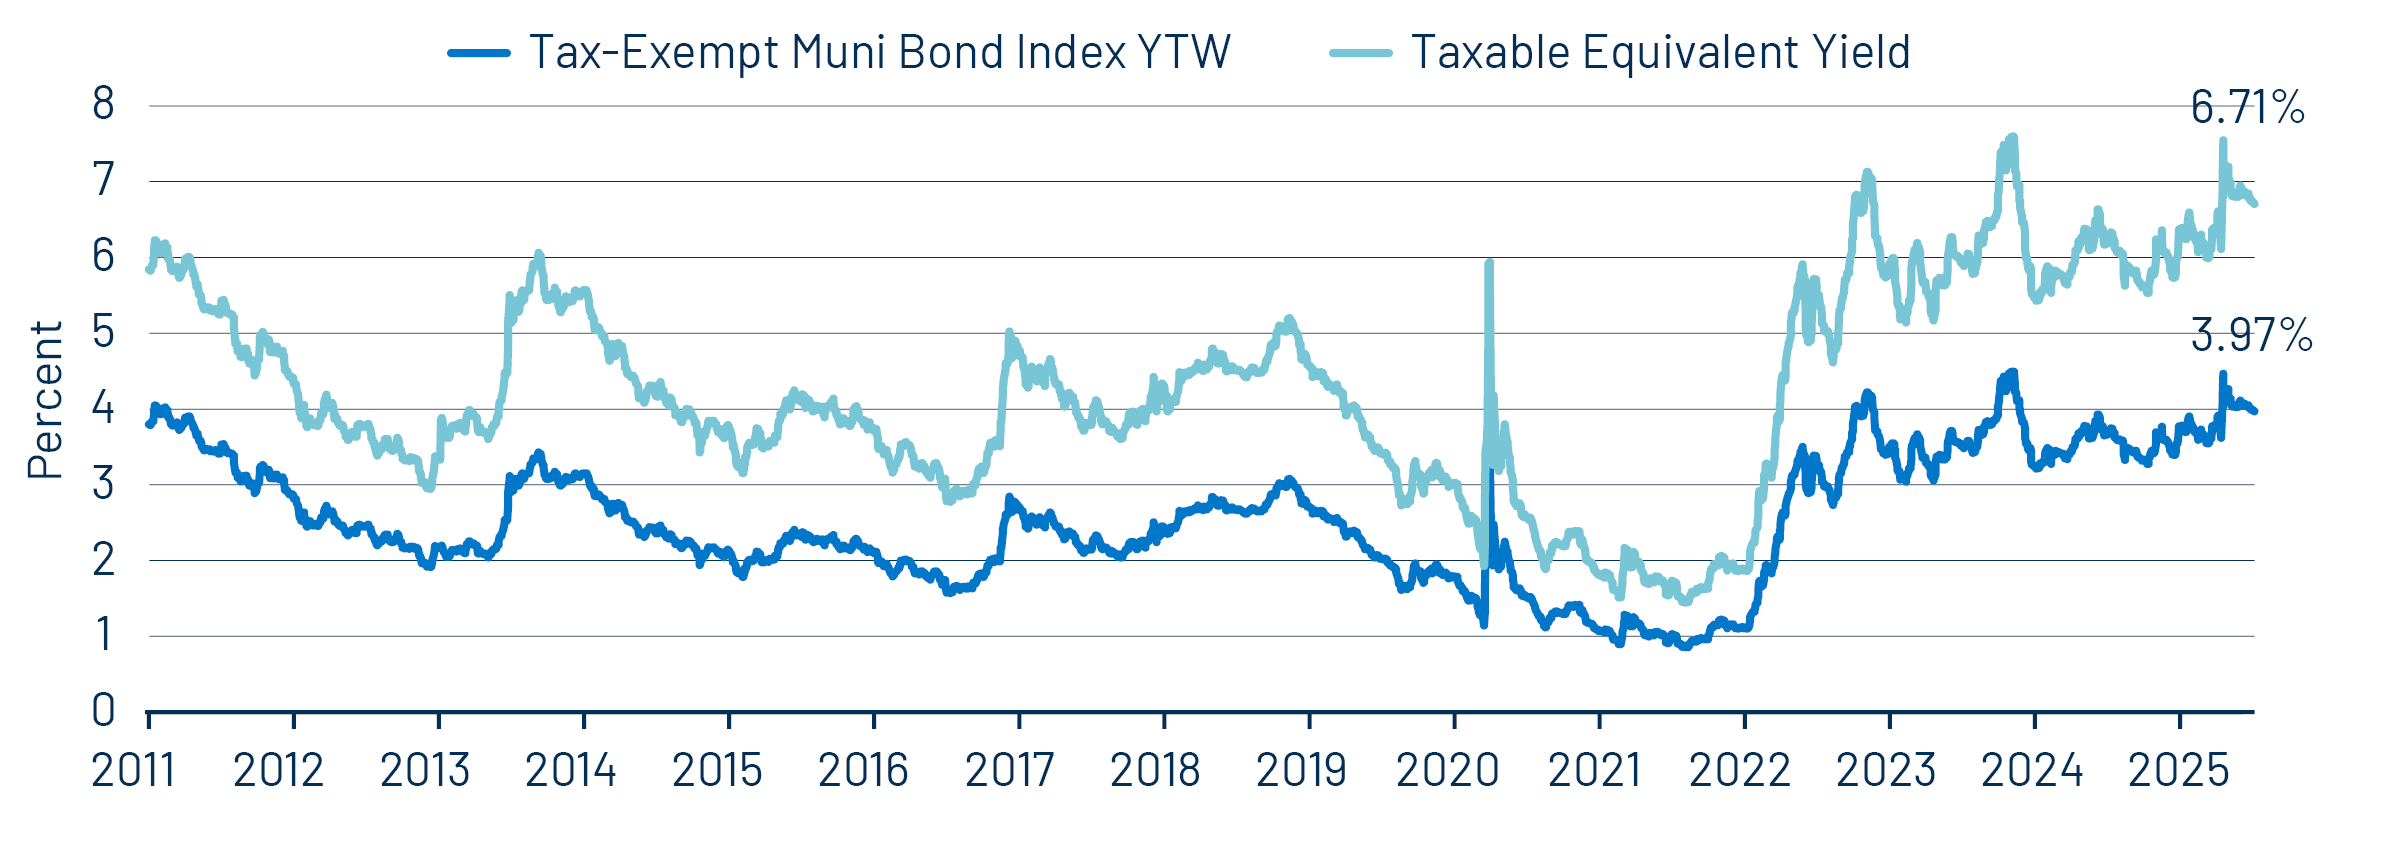
ValuationsYTD underperformance has resulted in higher tax-exempt municipal income opportunities and improved relative value of the municipal asset class. So far this year, the average Bloomberg Municipal Bond Index yield-to-worst (YTW) increased by 23 bps to 3.97%. Compared to taxable alternatives, municipals offer a compelling relative value proposition. Longer-duration and lower-investment-grade municipal credit offer above 100 bps of excess after-tax yield pickup versus like-structured Treasuries and corporate counterparts. We find that supply and demand imbalances that contribute to attractive entry points do tend to revert, and we expect that a potential supply slowdown in summer months, along with consistent demand, could support positive market sentiment and outperformance in the back half of the year.
Municipal Credit Curves and Relative Value
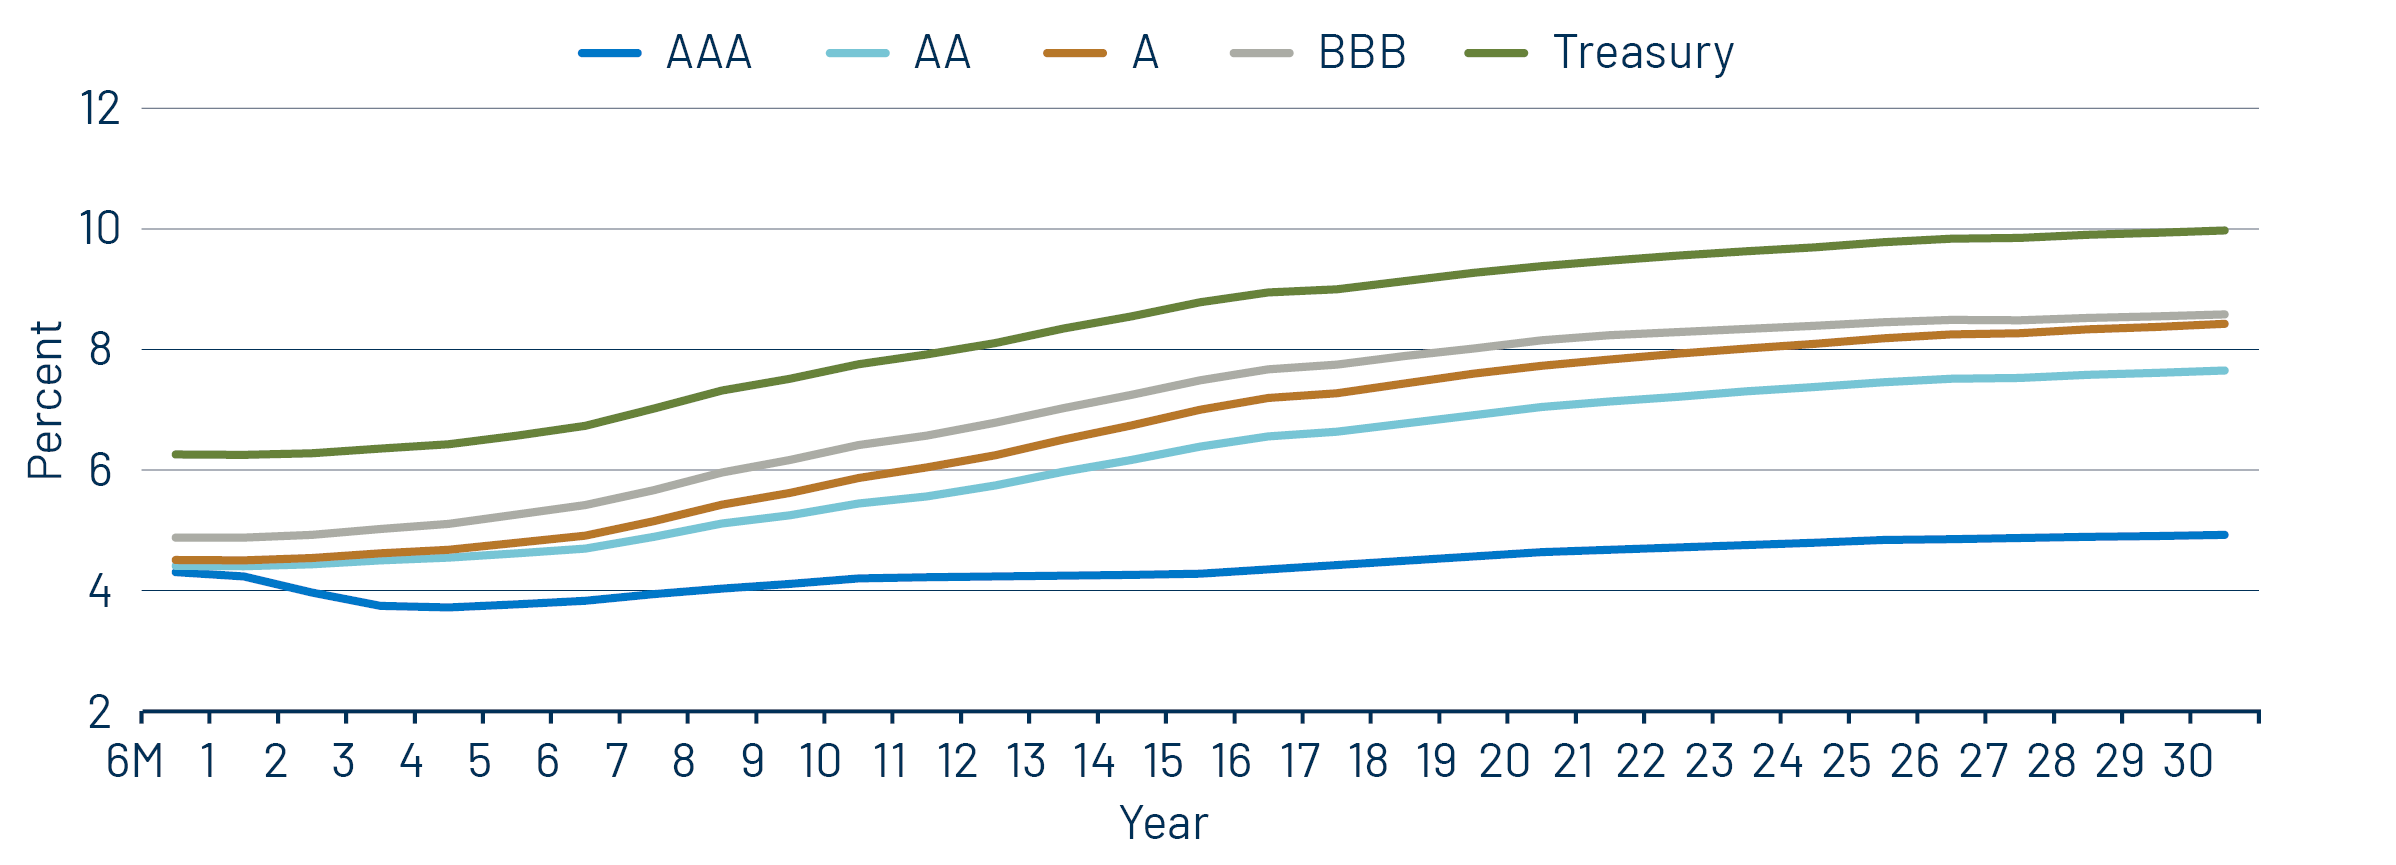
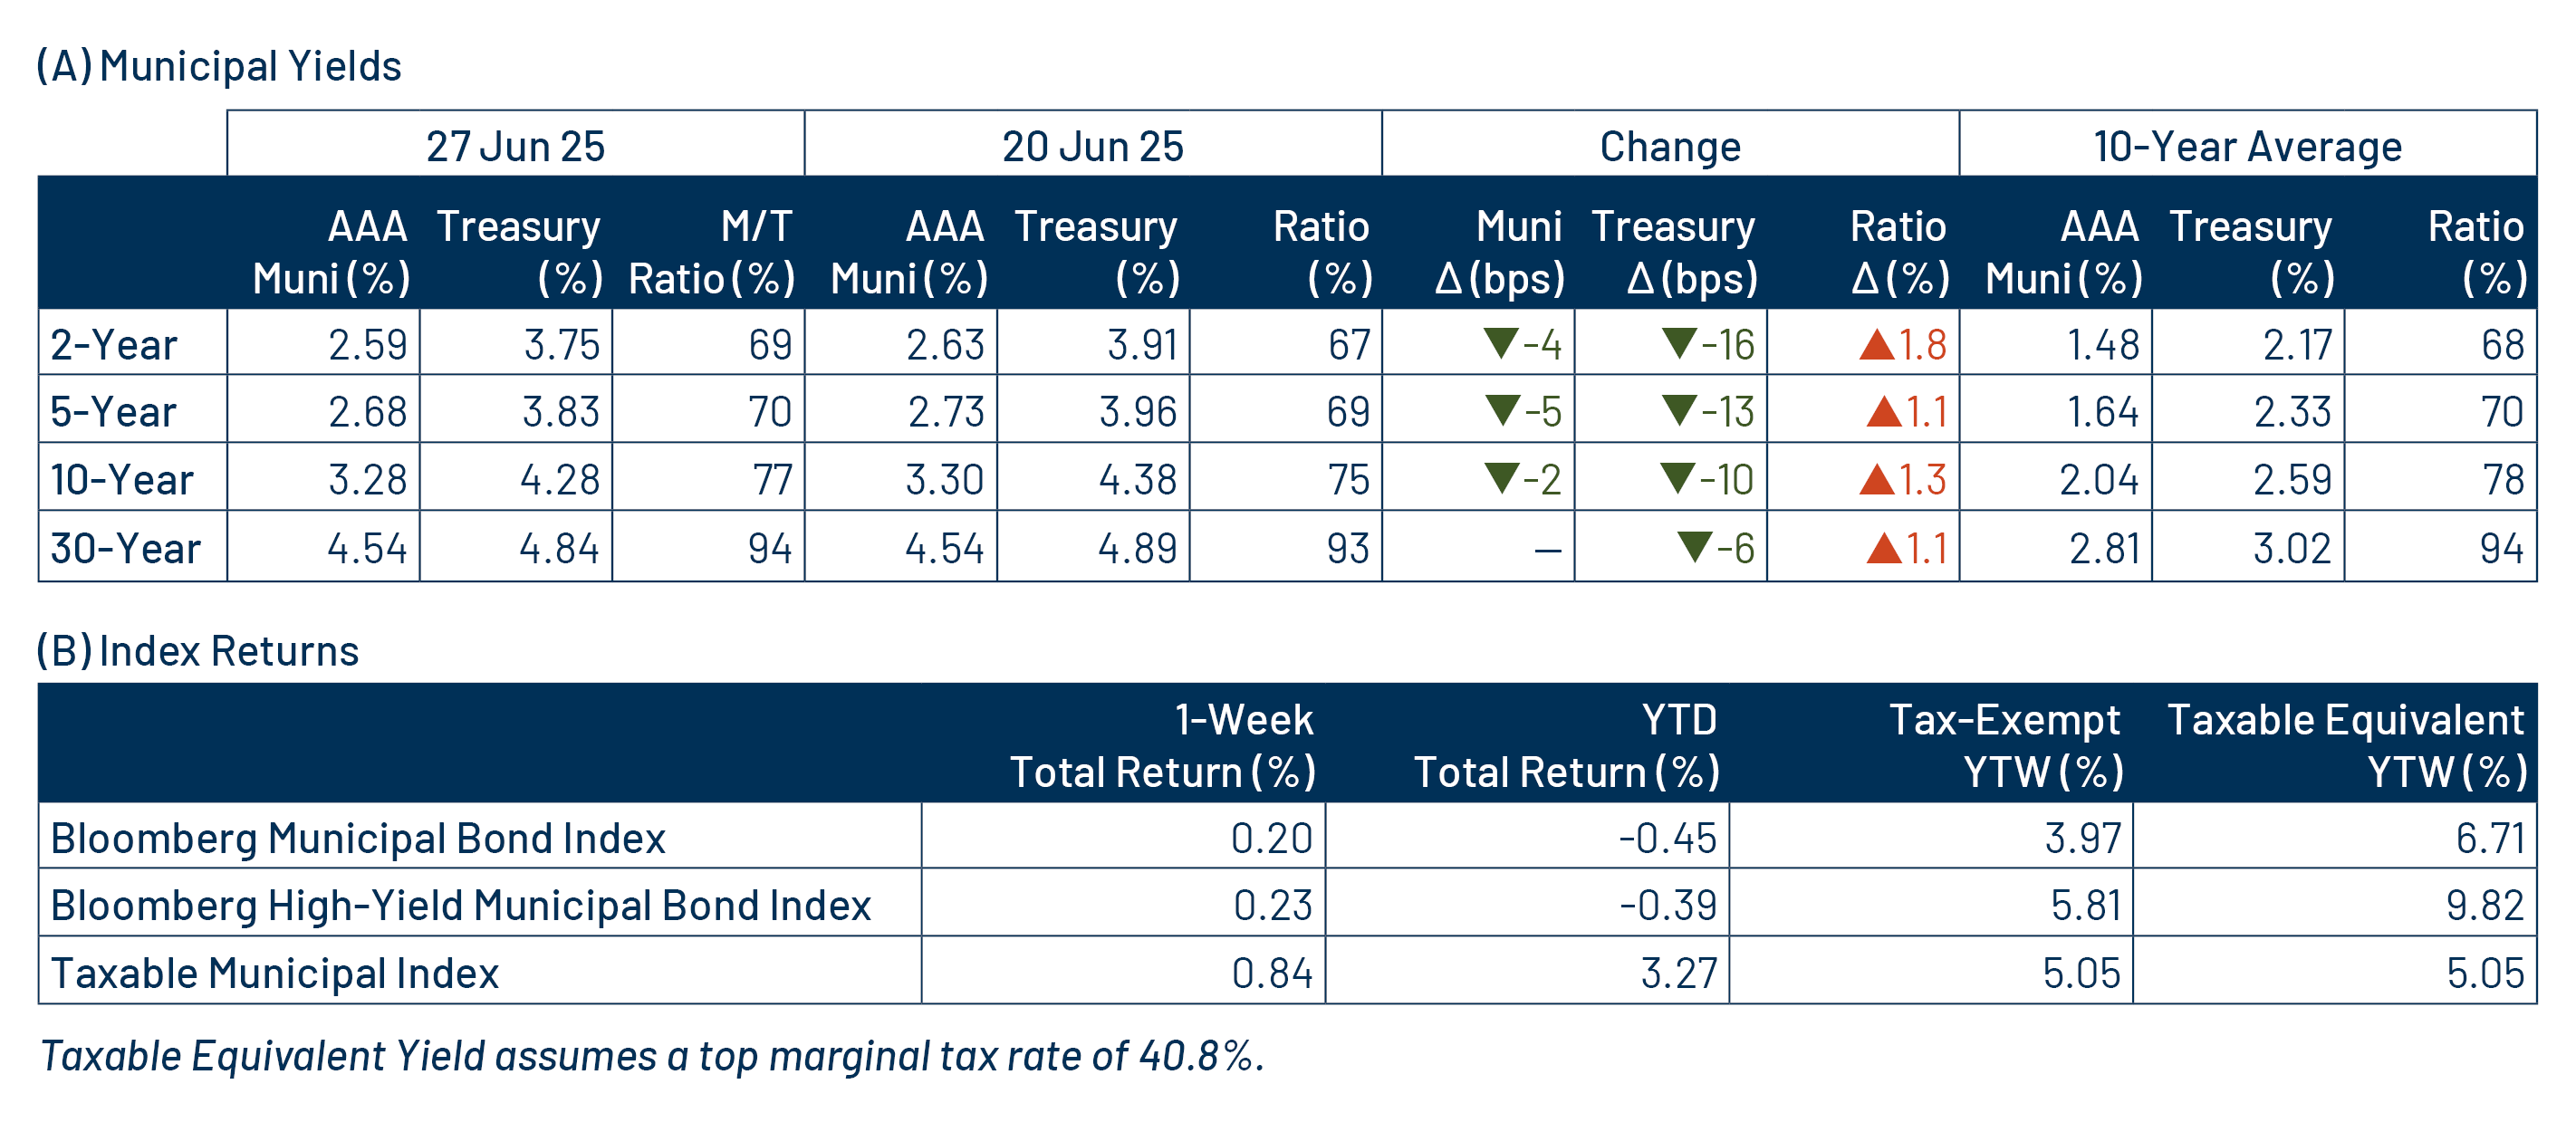
Theme #1: Municipal taxable-equivalent yields and income opportunities remain near decade-high levels.
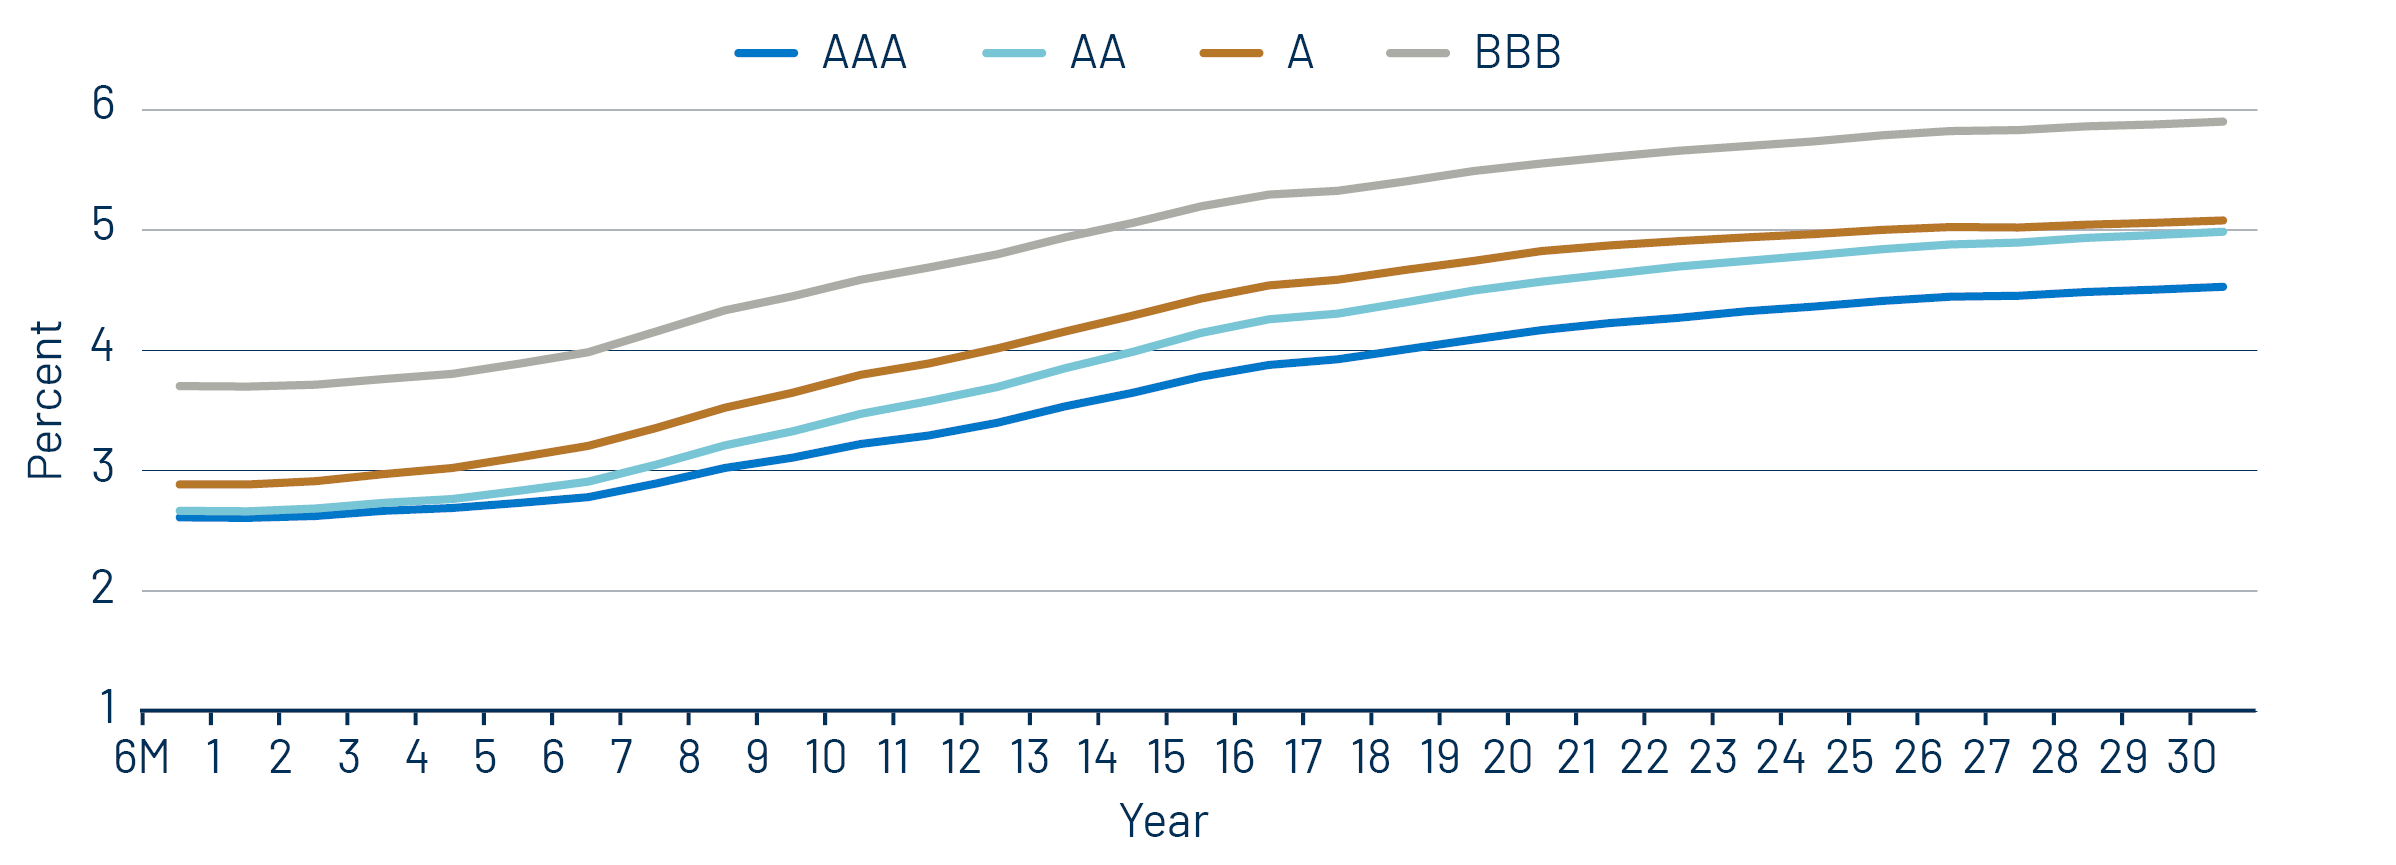
Theme #2: The AAA muni curve has steepened, offering better value in intermediate and longer maturities.
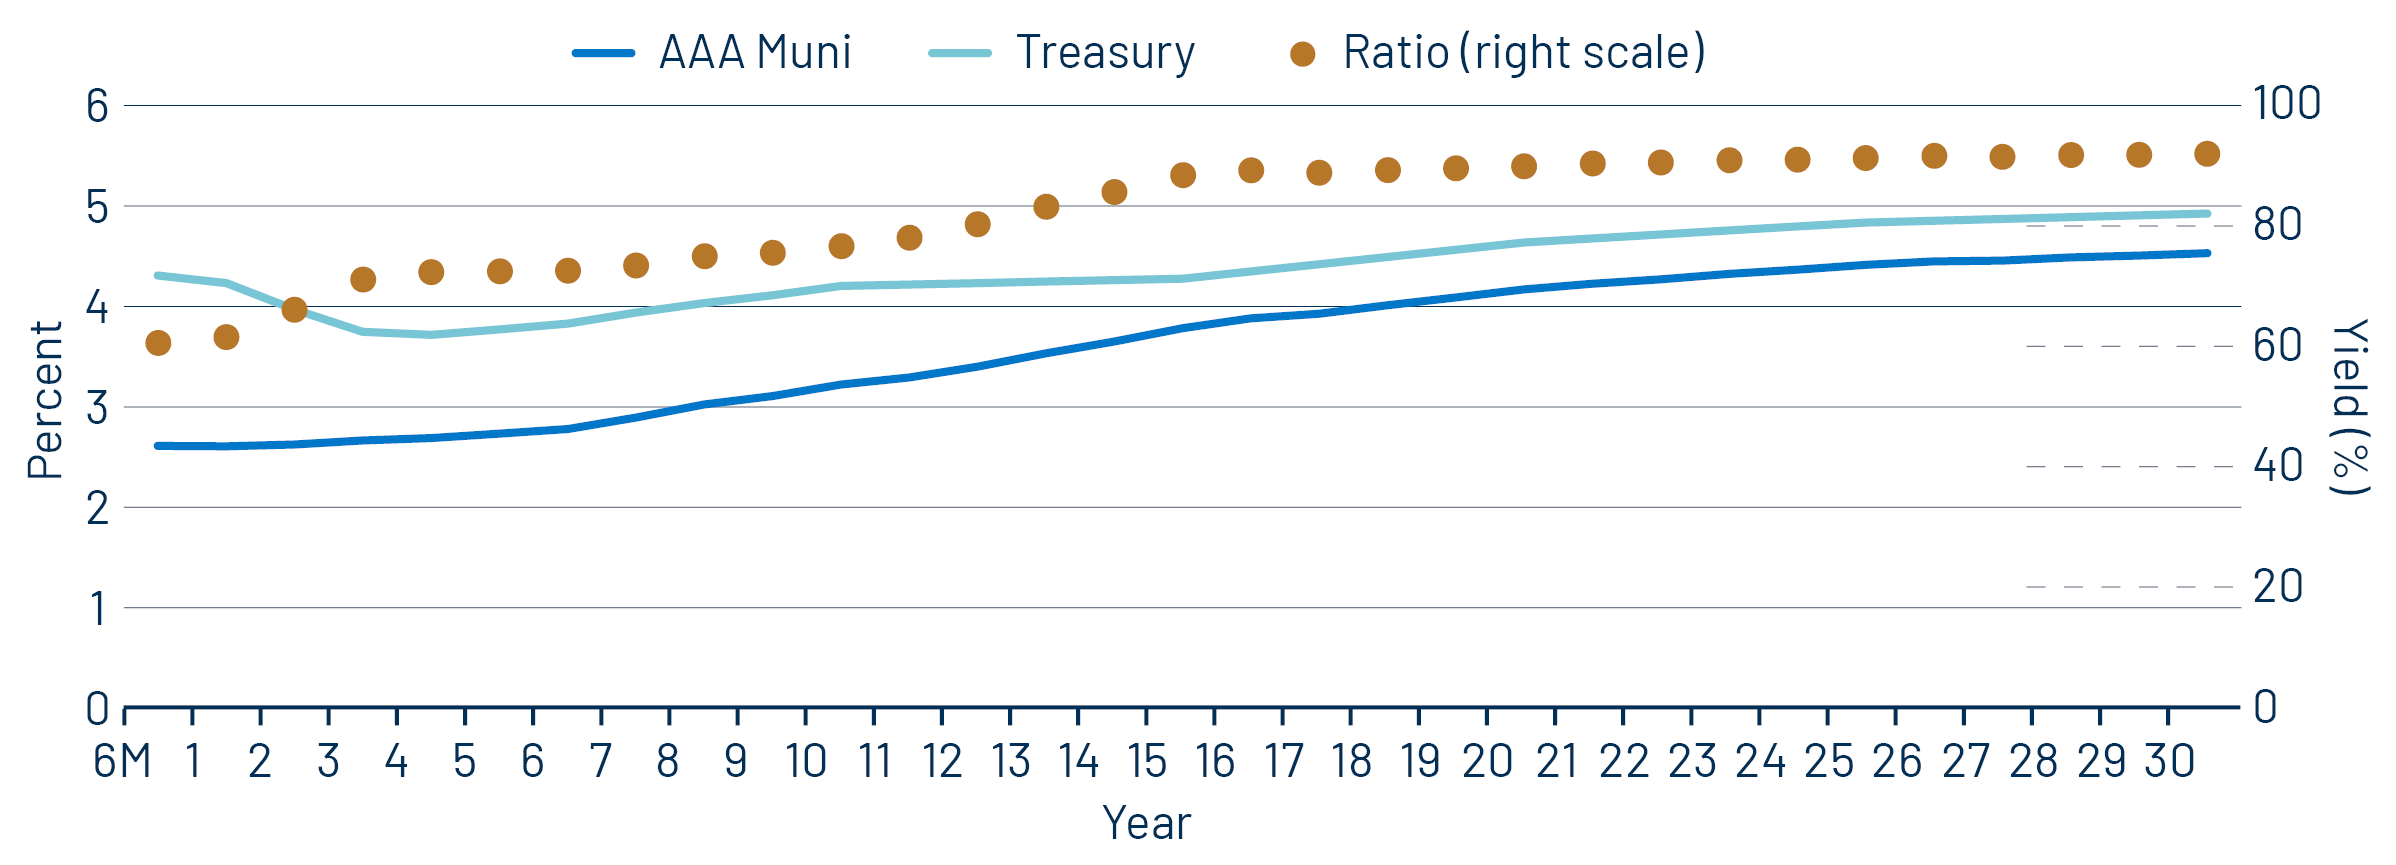
Theme #3: Munis offer attractive after-tax yield compared to taxable alternatives.


