skip navigation
Blog

Stay up to date on timely topics and market events. Subscribe to our Blog now.

MARKETS
January 17, 2023

Weekly Municipal Monitor—January Effect

By Sam Weitzman

Stay up to date on timely topics and market events. Subscribe to our Blog now.

Municipals Continued to Rally Last Week

Municipals continued to rally, as high-grade municipal yields moved 16-20 bps lower last week. Throughout the week, municipals steadily outperformed Treasuries, which moved lower on Thursday’s Consumer Price Index (CPI) report that reinforced inflation has continued to ease. Headline CPI fell 6.5% year-over-year (YoY), in line with the consensus and increasing expectations that the Federal Reserve (Fed) would slow hikes to 25 bps. Meanwhile, muni mutual fund flows turned positive. The Bloomberg Municipal Index returned 1.15%, the HY Muni Index returned 2.07% and the Taxable Muni Index returned 1.11%. This week we provide context on key drivers of the “January Effect” supporting year-to-date (YTD) muni outperformance.

Municipal Mutual Fund Flows Turn Positive

Fund Flows: During the week ending January 11, Lipper weekly reporting municipal mutual funds recorded $2.0 billion of net inflows. Long-term funds recorded $361 million of inflows, high-yield funds recorded $788 million of inflows and intermediate funds recorded $1.4 billion of inflows. Through the first two weeks of the year, YTD outflows stand at $4.8 billion.

Supply: The muni market recorded $4.5 billion of new-issue volume last week, up from the prior week. YTD issuance stands at $5.8 billion, 93% of which is tax-exempt. Despite the holiday, issuance is expected to pick up to $10 billion this week. Large transactions include $700 million Tennessee Energy Acquisition Corporation and $696 million Main Street Natural Gas transactions.

This Week in Munis: January Effect

This week’s municipal outperformance is a signal that the “January Effect” is in full swing. The January Effect in the muni market is characterized by low supply, elevated reinvestment from seasonally high January 1 coupon payments and market relief from potential reinvestment associated with year-end tax-selling.

Exhibit 1: Long-Term Municipal Issuance
Explore Long-Term Municipal Issuance
Source: Bloomberg. Long-term issuance defined as municipal securities with maturities beyond two years. As of 31 Dec 22. Select the image to expand the view.

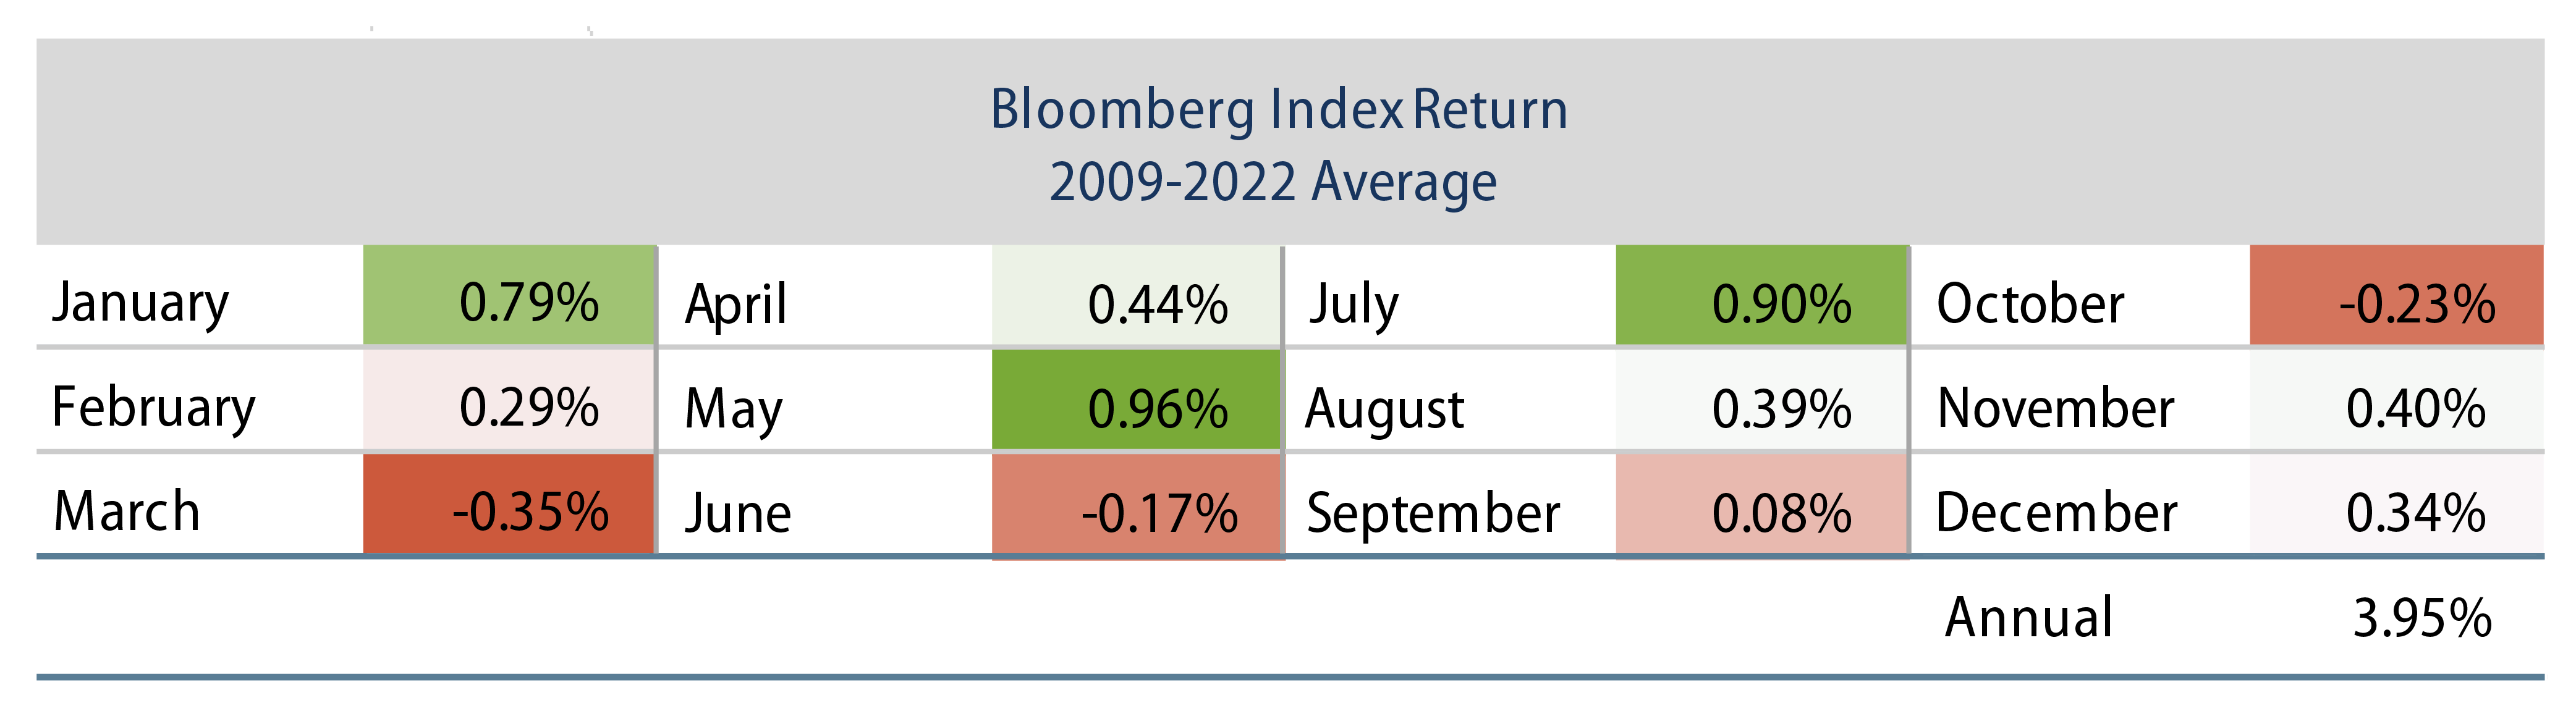
The month of January ranked as the lowest supply month in 11 of the last 14 calendar years, and ranked second lowest in the other three years. January long-term issuance averaged $16 billion since 2009, and comprised 4.0% of annual new-issue volume. The strong technicals in the month have contributed to above-average municipal index performance. The average January return of 0.79% ranked as the third highest month of returns from 2009, just shy of May and July average returns of 0.96% and 0.90%, respectively.

Exhibit 2: Average Bond Index Returns Since 2009
Explore Average Bond Index Returns Since 2009
Source: Bloomberg. As of 31 Dec 22. Select the image to expand the view.

Following significant negative municipal returns last year, we expect that a portion of the heavy tax loss selling that occurred last year was put back to work, and was a partial driver to the $2.0 billion of weekly municipal fund flows observed last week. In addition to signs of demand returning to the marketplace, elevated coupon payments early this month estimated at $17 billion, which are often reinvested in the market and further support muni demand.

So far, January issuance has been very limited at $6 billion. However, considering the $10 billion expected calendar this week, we anticipate that we might see above-average January issuance this year. Still, we believe that any marginally higher issuance would be quickly overwhelmed by the higher demand driven by the early-month coupons and improved fixed-income market sentiment as inflation continues to show signs of stabilizing. As highlighted in last week’s outlook, we anticipate a supportive technical backdrop in 2023, and this year’s January Effect represents a start of this trend.

Exhibit 3: Municipal Bond Yields and Index Returns
Explore Municipal Bond Yields and Index Returns
Source: Bloomberg. As of 13 Jan 23. Select the image to expand the view.
Exhibit 4: Tax-Exempt and Taxable Muni Valuations
Explore Tax-Exempt and Taxable Muni Valuations
Source: Bloomberg. As of 13 Jan 23. Select the image to expand the view.
© Western Asset Management Company, LLC 2024. The information contained in these materials ("the materials") is intended for the exclusive use of the designated recipient ("the recipient"). This information is proprietary and confidential and may contain commercially sensitive information, and may not be copied, reproduced or republished, in whole or in part, without the prior written consent of Western Asset Management Company ("Western Asset").
Past performance does not predict future returns. These materials should not be deemed to be a prediction or projection of future performance. These materials are intended for investment professionals including professional clients, eligible counterparties, and qualified investors only.
These materials have been produced for illustrative and informational purposes only. These materials contain Western Asset's opinions and beliefs as of the date designated on the materials; these views are subject to change and may not reflect real-time market developments and investment views.
Third party data may be used throughout the materials, and this data is believed to be accurate to the best of Western Asset's knowledge at the time of publication, but cannot be guaranteed. These materials may also contain strategy or product awards or rankings from independent third parties or industry publications which are based on unbiased quantitative and/or qualitative information determined independently by each third party or publication. In some cases, Western Asset may subscribe to these third party's standard industry services or publications. These standard subscriptions and services are available to all asset managers and do not influence rankings or awards in any way.
Investment strategies or products discussed herein may involve a high degree of risk, including the loss of some or all capital. Investments in any products or strategies described in these materials may be volatile, and investors should have the financial ability and willingness to accept such risks.
Unless otherwise noted, investment performance contained in these materials is reflective of a strategy composite. All other strategy data and information included in these materials reflects a representative portfolio which is an account in the composite that Western Asset believes most closely reflects the current portfolio management style of the strategy. Performance is not a consideration in the selection of the representative portfolio. The characteristics of the representative portfolio shown may differ from other accounts in the composite. Information regarding the representative portfolio and the other accounts in the composite are available upon request. Statements in these materials should not be considered investment advice. References, either general or specific, to securities and/or issuers in the materials are for illustrative purposes only and are not intended to be, and should not be interpreted as, recommendation to purchase or sell such securities. Employees and/or clients of Western Asset may have a position in the securities or issuers mentioned.
These materials are not intended to provide, and should not be relied on for, accounting, legal, tax, investment or other advice. The recipient should consult its own counsel, accountant, investment, tax, and any other advisers for this advice, including economic risks and merits, related to making an investment with Western Asset. The recipient is responsible for observing the applicable laws and regulations of their country of residence.
Founded in 1971, Western Asset Management Company is a global fixed-income investment manager with offices in Pasadena, New York, London, Singapore, Tokyo, Melbourne, São Paulo, Hong Kong, and Zürich. Western Asset is a wholly owned subsidiary of Franklin Resources, Inc. but operates autonomously. Western Asset is comprised of six legal entities across the globe, each with distinct regional registrations: Western Asset Management Company, LLC, a registered Investment Adviser with the Securities and Exchange Commission; Western Asset Management Company Distribuidora de Títulos e Valores Mobiliários Limitada is authorized and regulated by Comissão de Valores Mobiliários and Brazilian Central Bank; Western Asset Management Company Pty Ltd ABN 41 117 767 923 is the holder of the Australian Financial Services License 303160; Western Asset Management Company Pte. Ltd. Co. Reg. No. 200007692R is a holder of a Capital Markets Services License for fund management and regulated by the Monetary Authority of Singapore; Western Asset Management Company Ltd, a registered Financial Instruments Business Operator and regulated by the Financial Services Agency of Japan; and Western Asset Management Company Limited is authorised and regulated by the Financial Conduct Authority ("FCA") (FRN 145930). This communication is intended for distribution to Professional Clients only if deemed to be a financial promotion in the UK as defined by the FCA. This communication may also be intended for certain EEA countries where Western Asset has been granted permission to do so. For the current list of the approved EEA countries please contact Western Asset at +44 (0)20 7422 3000.