

Municipals Posted a Third Consecutive Week of Positive Returns
Municipals posted positive returns for a third consecutive week, as high-grade municipal yields moved 6-12 bps lower. Strong technicals led municipals to outperform Treasuries, which moved lower on weaker than expected US retail sales and Producer Price Index (PPI) data releases. The Bloomberg Municipal Index returned +0.51%, the HY Muni Index returned +0.57% and the Taxable Muni Index returned +0.28%. Following a second consecutive week of muni fund inflows, we evaluate the scope of the 2022 record outflow cycle and the factors that could shift demand into the asset class in 2023.
Municipal Mutual Funds Post a Second Consecutive Week of Inflows
Fund Flows: During the week ending January 18, Lipper weekly reporting municipal mutual funds recorded $1.5 billion of net inflows. Long-term funds recorded $1.5 billion of inflows, high-yield funds recorded $823 million of inflows and intermediate funds recorded $185 million of inflows. The week’s inflows reduce year-to-date (YTD) outflows to $3.3 billion.
Supply: The muni market recorded $10 billion of new-issue volume last week, more than doubling the prior week’s level. YTD issuance stands at $16 billion, 91% of which was tax-exempt. This week’s calendar is expected to decline to $6 billion. Large transactions include $2.1 billion University of California and $950 million Port of Portland, Oregon transactions.
This Week in Munis: Inflows Ahead?
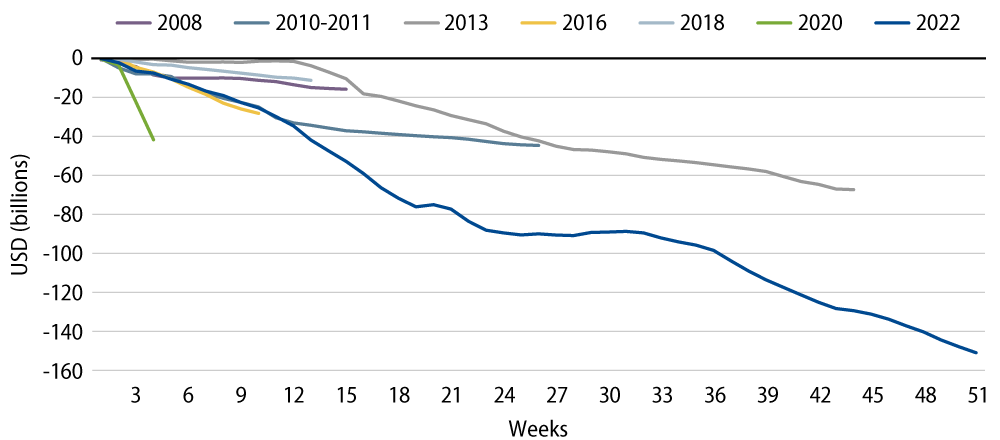
In recent weeks we highlighted an expectation of rebounding municipal technicals in 2023, largely driven by demand returning to the muni asset class following a record open-end fund outflow cycle that reached $151 billion over 51 weeks, according to ICI. The 2022 muni fund flow drawdown was also more acute than the drawdowns observed from taxable fixed-income sectors. Morningstar estimates that 2022 municipal fund outflows comprised 11% of starting assets under management (AUM), compared to just 4% flow drawdowns from taxable fixed-income.
Historically, positive muni demand cycles and favorable performance have followed sizable outflow cycles. Assessing what could drive the next inflow cycle, we point to the factors that we believe were primary drivers of the 2022 negative demand cycle, including: (1) relatively tight municipal valuations at the start of the year, (2) upside inflation surprises that contributed to interest-rate volatility and (3) end-of-year tax-loss selling. Entering 2023, we see signs of optimism across these factors. Higher rates have improved municipal relative value, inflation has shown signs of abating and tax-loss selling has decelerated. Moreover, during prior outflow cycles, municipal market prices typically recovered less than halfway through the period, with the second half of outflow cycles typically experiencing positive returns. We anticipate that the market price recovery observed in the last quarter could serve as a signal of stability and attract demand back to the municipal market this year.

The past two weeks may prologue the start of the next inflow cycle, and we expect most municipal investors would be eager to experience performance comparable to prior positive demand cycles. The Bloomberg Muni Bond Index returned 13.4%, on average, during the prior six inflow cycles. While we believe that the strong performance observed so far this year should warrant caution and could contribute to potential near-term price volatility, we anticipate that supportive supply and demand technicals could lead to challenging entry points for traditional muni investors throughout the year. An active manager can help investors navigate relative value during these periods.

