skip navigation
Blog

Stay up to date on timely topics and market events. Subscribe to our Blog now.

MARKETS
September 24, 2024

Weekly Municipal Monitor—Impact of Fed Cuts

By Sam Weitzman

Stay up to date on timely topics and market events. Subscribe to our Blog now.

Munis Posted Positive Returns Last Week

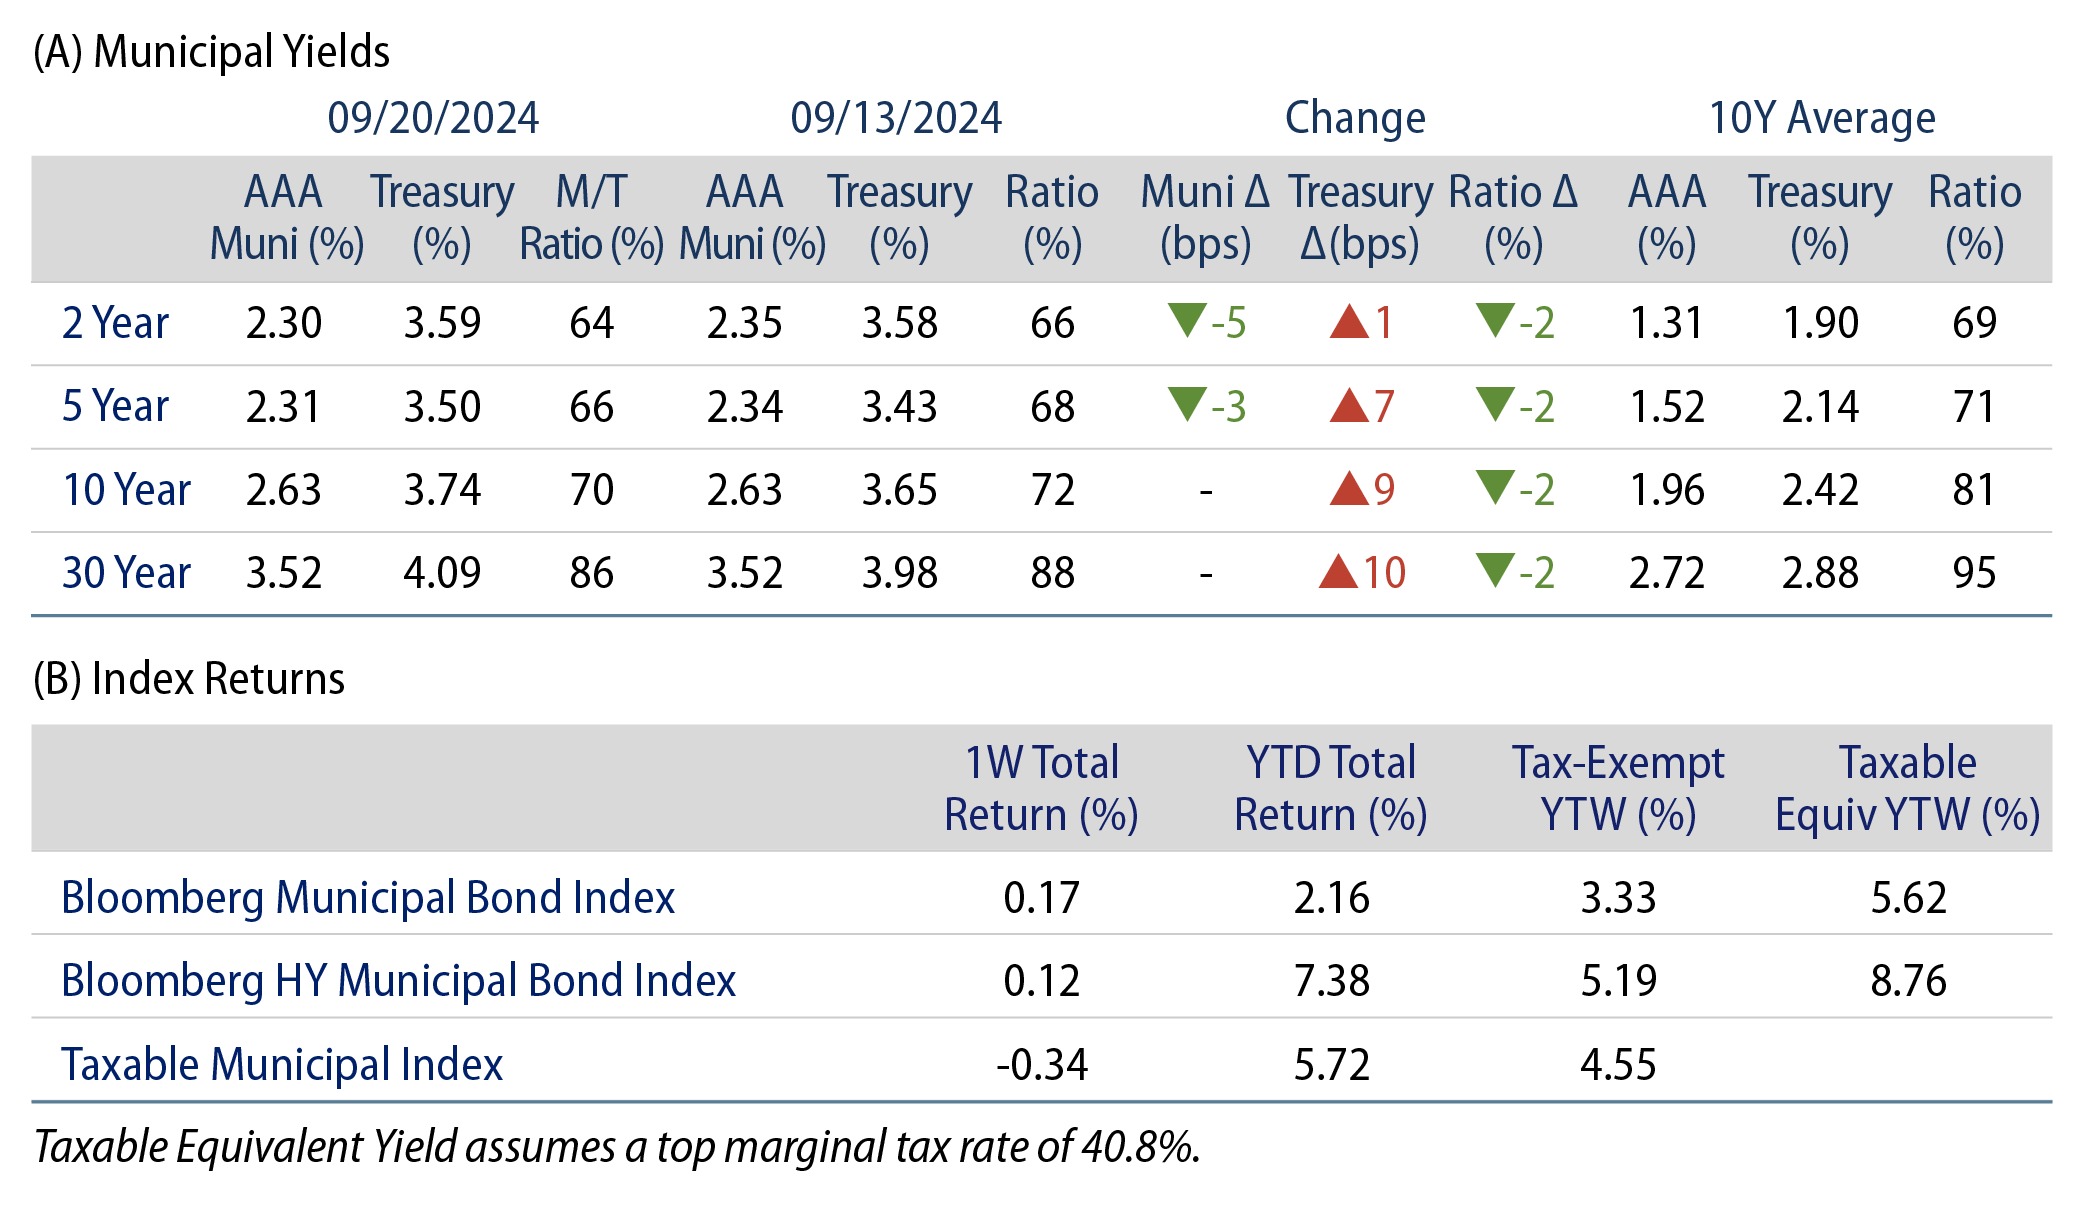
Municipals posted positive returns last week as muni yields outperformed Treasuries, which moved higher following the Federal Reserve’s (Fed) 50-bp rate cut. Meanwhile, high-grade muni yields moved just 3-5 bps lower in short maturities, and supply and demand trends remained elevated. The Bloomberg Municipal Index returned 0.17% during the week, the High Yield Muni Index returned 0.12% and the Taxable Muni Index returned -0.34%. Following the Fed’s rate cut last week, we highlight the municipal market reaction to prior rate-cutting cycles.

Muni Inflows Continued for a 12th Consecutive Week

Fund Flows (up $ 716 million): During the week ending September 18, weekly reporting municipal mutual funds recorded $716 million of net inflows, according to Lipper. Long-term funds recorded $628 million of inflows, intermediate funds recorded $107 million of inflows and high-yield funds recorded $389 million of inflows. This week’s inflows mark the 12th consecutive week of inflows and lead estimated year-to-date (YTD) net inflows higher to $25 billion.

Supply (YTD supply of $360 billion, up 42% YoY): The muni market recorded $9 billion of new-issue volume last week, down 38% from the prior week. YTD issuance of $360 billion is 42% higher than last year’s level, with tax-exempt issuance 47% higher and taxable issuance 12% higher year-over year (YoY). This week’s calendar is expected to jump to $15 billion. The largest deals include $1.3 billion Texas Water Development Board and $1.1 billion Los Angeles Unified School District transactions.

This Week in Munis: Impact of Fed Cuts

Last week, the Fed delivered a 50-bp reduction to the fed funds rate, lowering the top end of the rate range from 5.50% to 5.00%. The rate reduction was well telegraphed considering slowing inflation and labor market trends, and represents the start of a potential new rate-cutting cycle.

Rate-cutting cycles have historically contributed to fixed-income and municipal performance, which is not surprising due to the inverse relationship between interest rates and fixed-income price returns. During the prior seven significant rate-cutting cycles observed since 1981, the Bloomberg U.S. Aggregate Bond Index returned an average of 33.8% (or 10.4% annualized). The Bloomberg Municipal Bond Index generally mirrored these strong returns, posting an average of 31.6% during these cycles (9.5% annualized), and outperformed the Bloomberg U.S. Aggregate Bond and U.S. Treasury indices in three of the last four cycles. Considering that these index returns do not reflect income tax liabilities, municipals have outperformed these indices on an after-tax basis for most taxpayers.

Exhibit 1: Rate-Cutting Cycles and Muni Yield Changes
Rate-Cutting Cycles and Muni Yield Changes
Source: Bloomberg, Western Asset. Rate-cutting cycles are defined by the last day of the peak fed funds rate and the last day of the trough of the fed funds rate: 1981-1983: 5/29/81-4/29/83; 1984-1986: 10/1/84-12/15/86; 1989-1994: 6/2/89-2/2/94; 1995-1999: 7/3/95-6/30/99; 2001-2004: 1/19/01-6/29/04; 2007-2015: 9/17/07-12/15/15; 2019-2022: 7/30/19-3/15/22. As of 20 Sep 24. Select the image to expand the view.

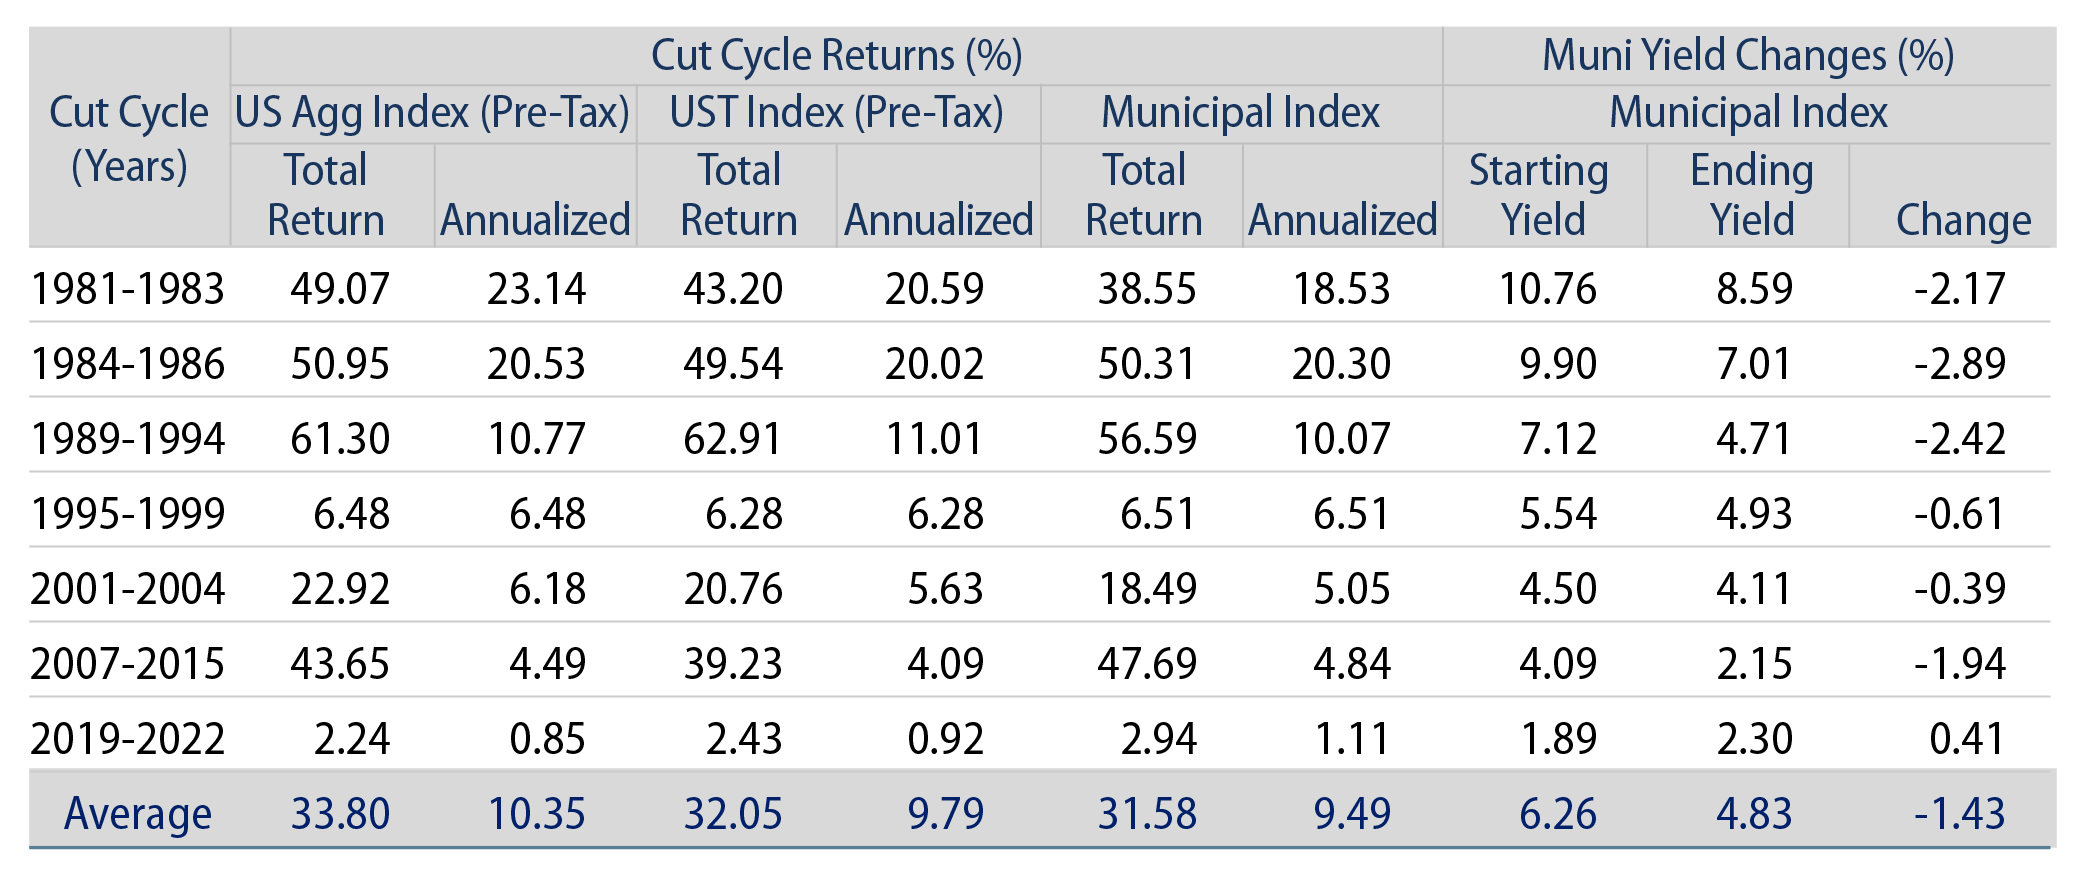
Rate-cutting cycles have also generally contributed to lower tax-exempt income opportunities by the end of the cycle. The average yield to worst of the Muni Bond Index declined in six of the last seven rate cut cycles by an average of 1.4%, underscoring the value income seekers can achieve by entering the asset class ahead of the rate cut cycle.

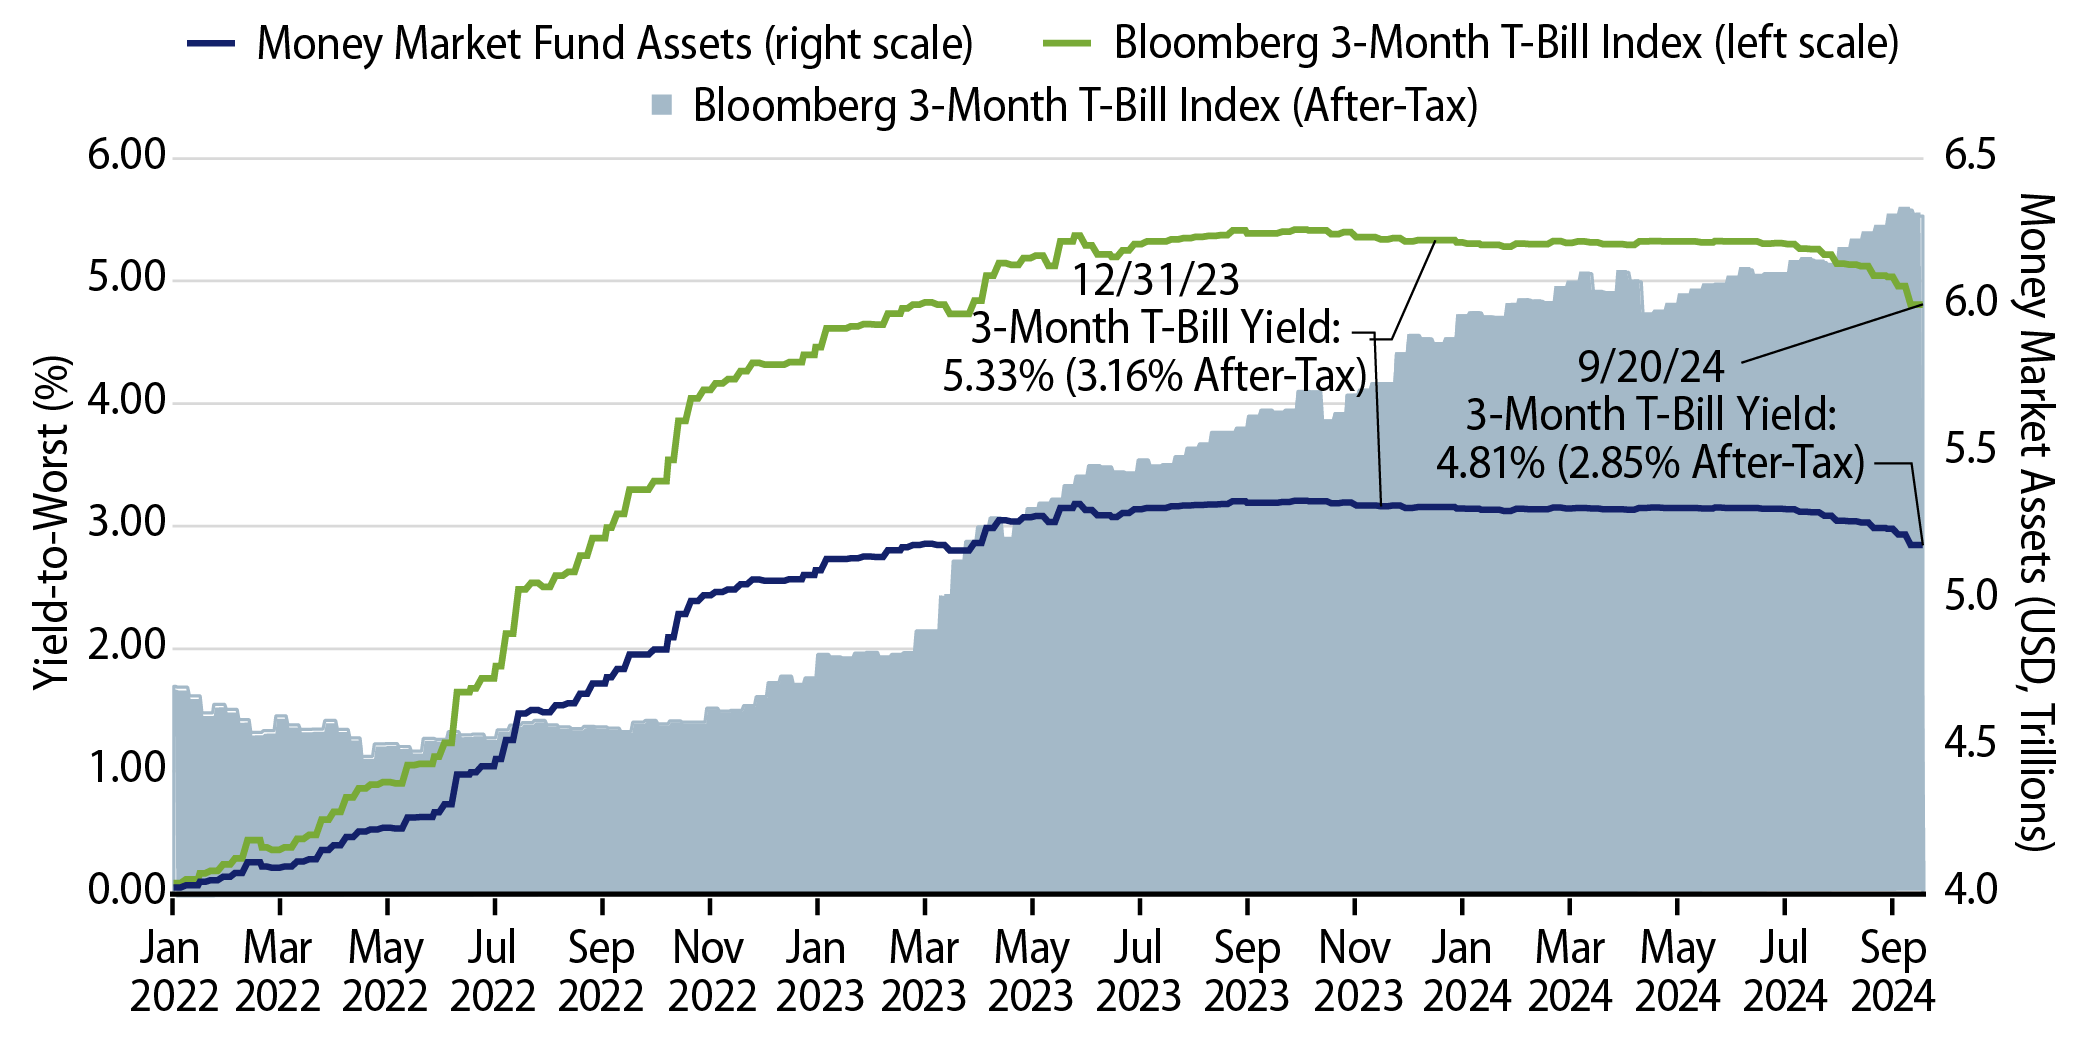
Western Asset believes that the longer-duration structure of the municipal asset class offers investors attractive tax-exempt income opportunities today, along with the potential for additional price appreciation in a potential lower rate environment ahead. In the near term, we expect the Fed cut could have a pronounced impact on the front end of the curve and cash-like investment products (such as money market funds and CDs), which could add an improved demand tailwind to the municipal asset class should the over $6 trillion from these products flow to attractive after-tax yield opportunities offered by munis.

Exhibit 2: 3-Month T-Bill Index Yield to Worst vs. Money Market Fund Assets
3-Month T-Bill Index Yield to Worst vs. Money Market Fund Assets
Source: Bloomberg, ICI, Western Asset. Bloomberg 3-month T-Bill Index, ICI Total Money Market Fund AUM; After-tax yield assumes top federal tax rate of 40.8%. Yield-to-worst (YTW) is the lowest potential yield that can be received on a bond without the issuer actually defaulting. Select the image to expand the view.

Municipal Credit Curves and Relative Value

Exhibit 3: Muni Credit Curves
Muni Credit Curves
Source: Bloomberg, Western Asset. As of 20 Sep 24. Bloomberg BVAL Municipal Credit Indices (AAA, AA, A, BBB, respectively) and US Sovereign Curves. Taxable-Equivalent Muni Credit Curves consider the top marginal effective tax rate of 40.8%. Select the image to expand the view.
Exhibit 4: Taxable-Equivalent Muni Credit Curves
Taxable-Equivalent Muni Credit Curves
Source: Bloomberg, Western Asset. As of 20 Sep 24. Bloomberg BVAL Municipal Credit Indices (AAA, AA, A, BBB, respectively) and US Sovereign Curves. Taxable-Equivalent Muni Credit Curves consider the top marginal effective tax rate of 40.8%. Select the image to expand the view.
Exhibit 5: AAA Munis vs. Treasuries
AAA Munis vs. Treasuries
Source: Muni Yields: Thomson Reuters MMD, Treasury Yields: Bloomberg. As of 20 Sep 24. Past performance is not a guarantee of future results. It is not possible to invest directly in an index. Select the image to expand the view.
Exhibit 6: Tax-Exempt and Taxable Muni Valuations
Tax-Exempt and Taxable Muni Valuations
Source: Bloomberg. Yield-to-worst (YTW) is the lowest potential yield that can be received on a bond without the issuer actually defaulting. As of 20 Sep 24. Select the image to expand the view.

Western Asset Key Themes for Muni Investors

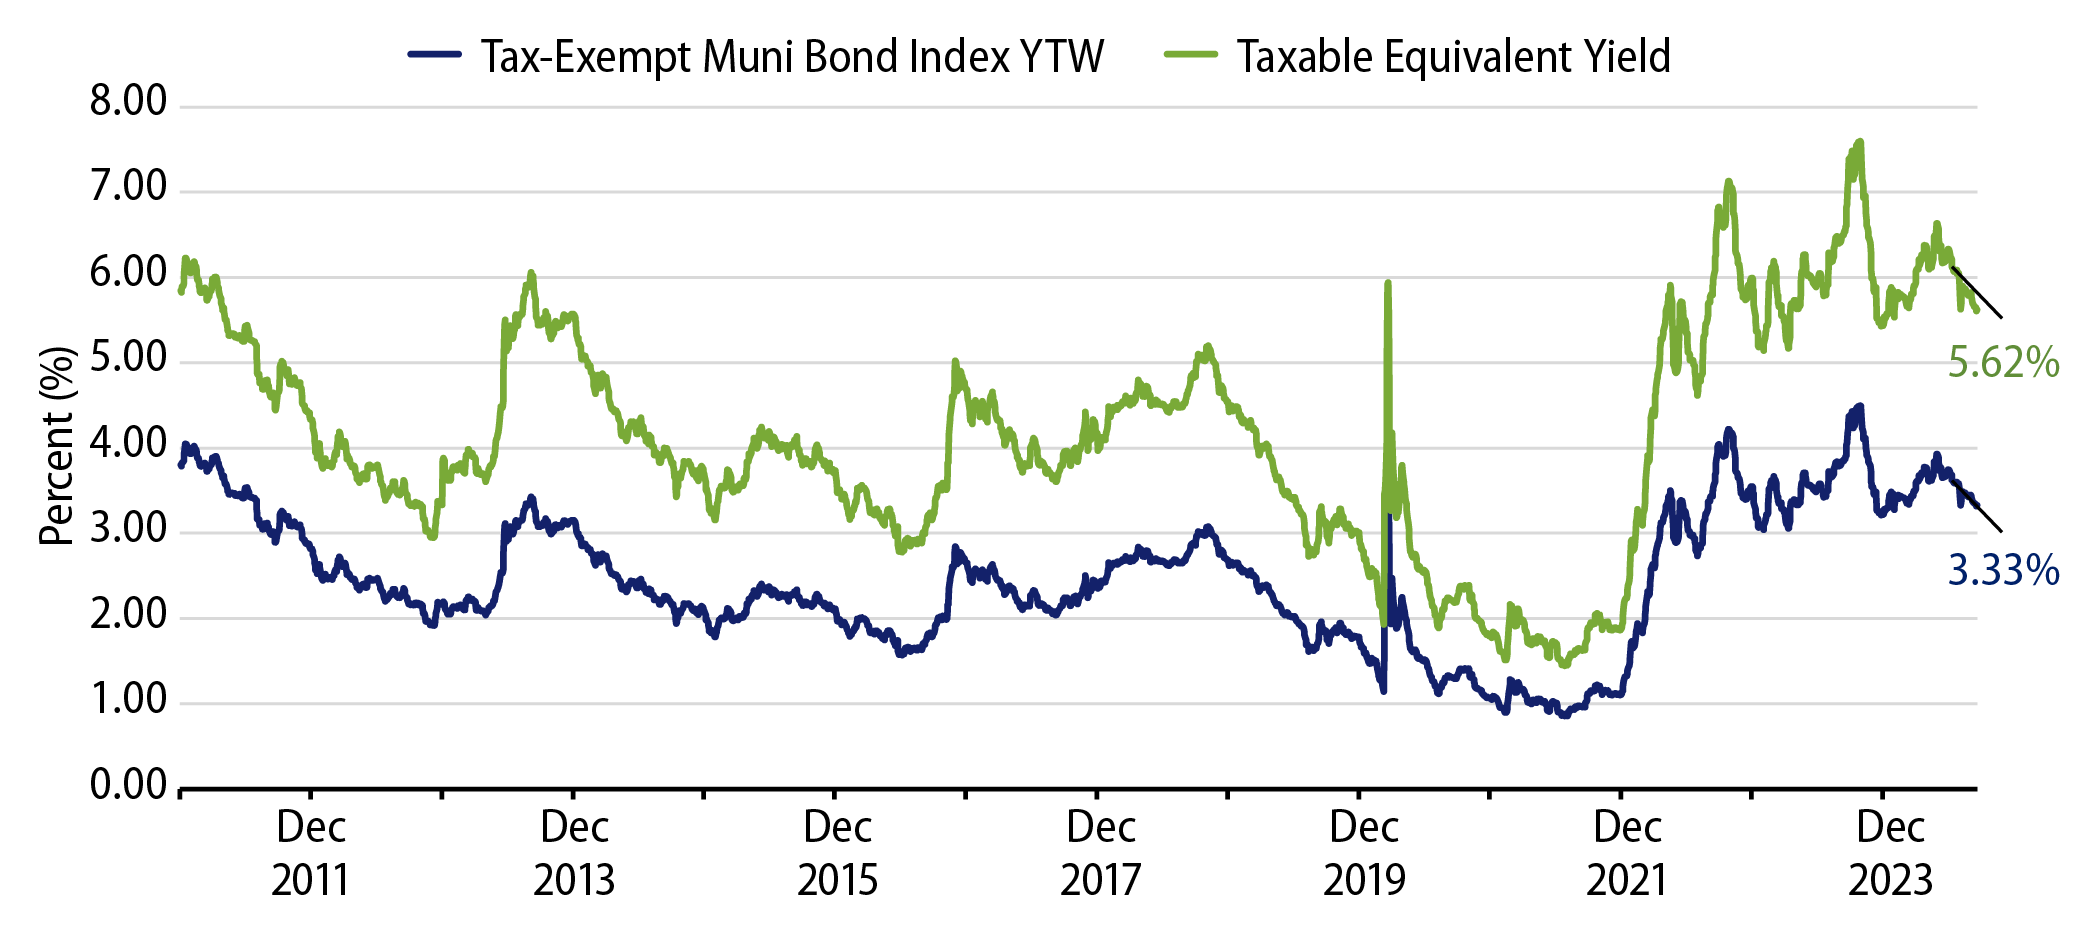
Theme #1: Municipal taxable-equivalent yields and income opportunities are above decade averages.

Exhibit 7: Muni and Taxable-Equivalent Muni Yield-to-Worst
Muni and Taxable-Equivalent Muni Yield-to-Worst
Source: Bloomberg, Western Asset. As of 20 Sep 24. Bloomberg Municipal Bond Index yield considering highest marginal tax rate of 40.8%. Indexes are unmanaged and one cannot directly invest in them. They do not include fees, expenses or sales charges. Past performance is not an indicator or a guarantee of future results. Select the image to expand the view.

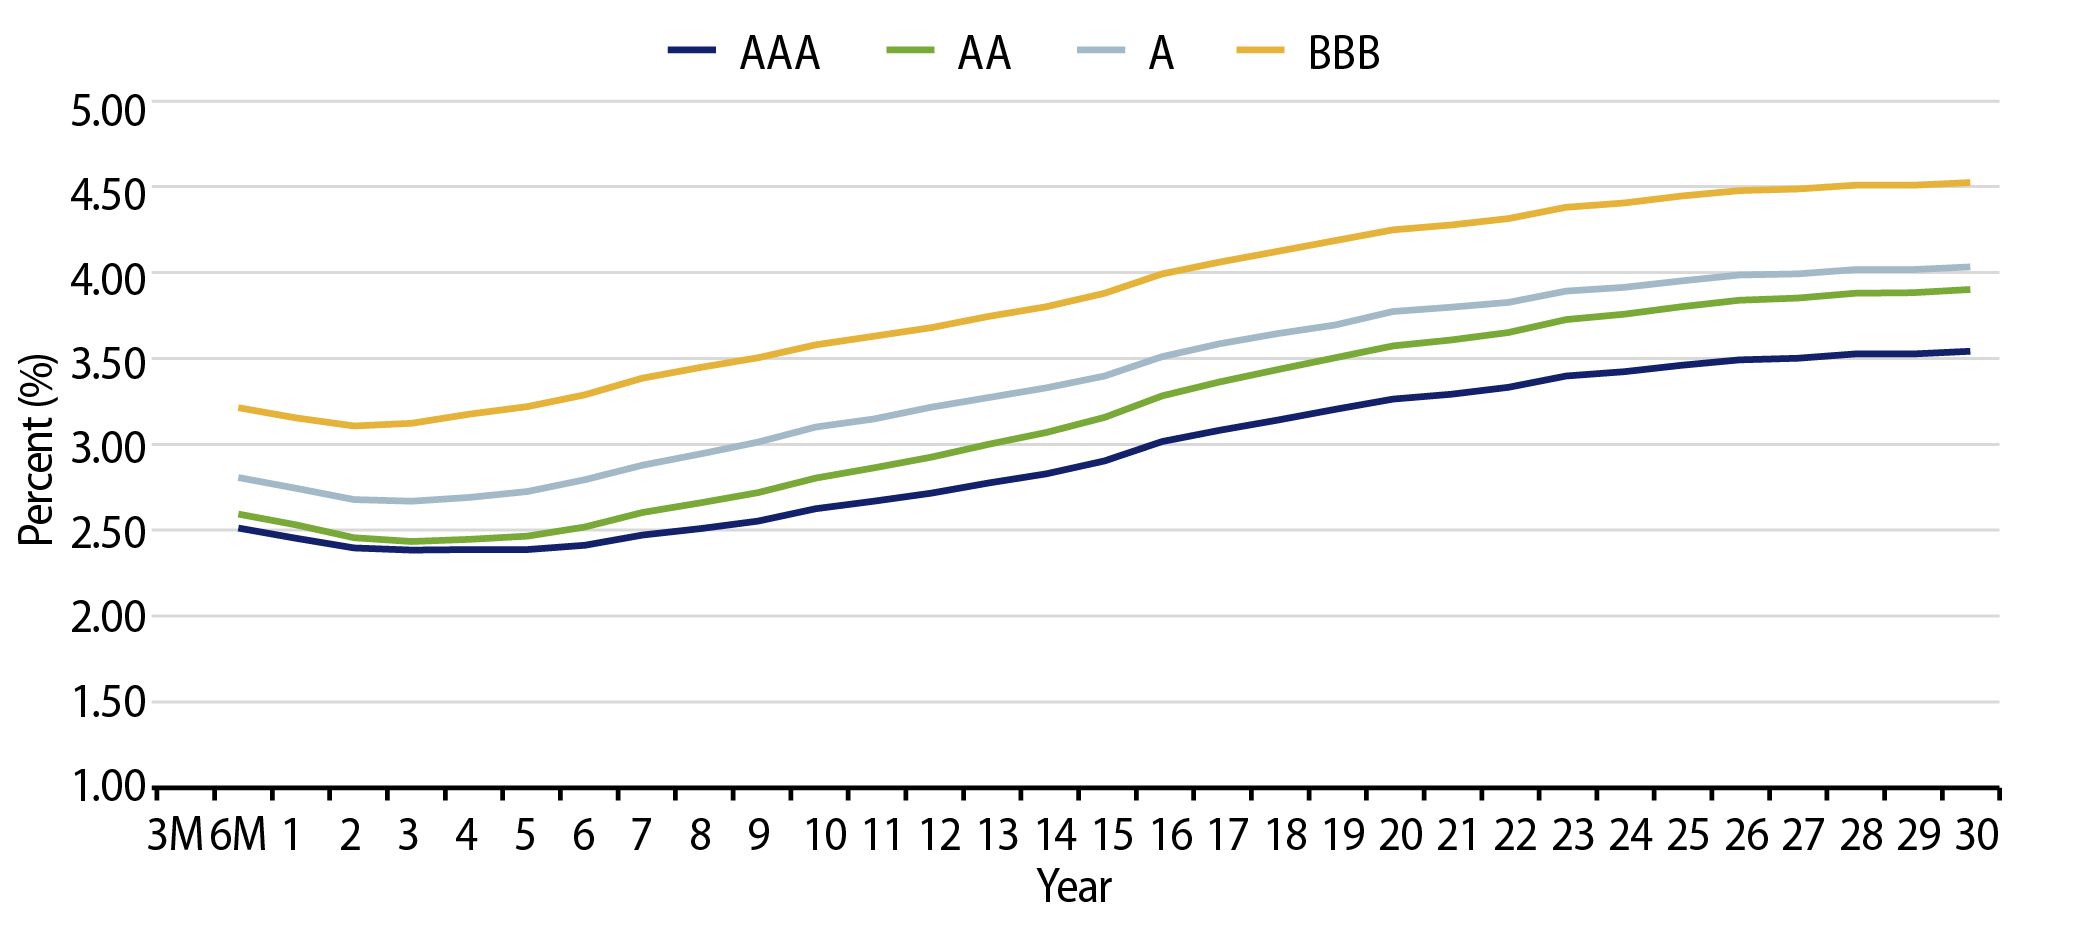
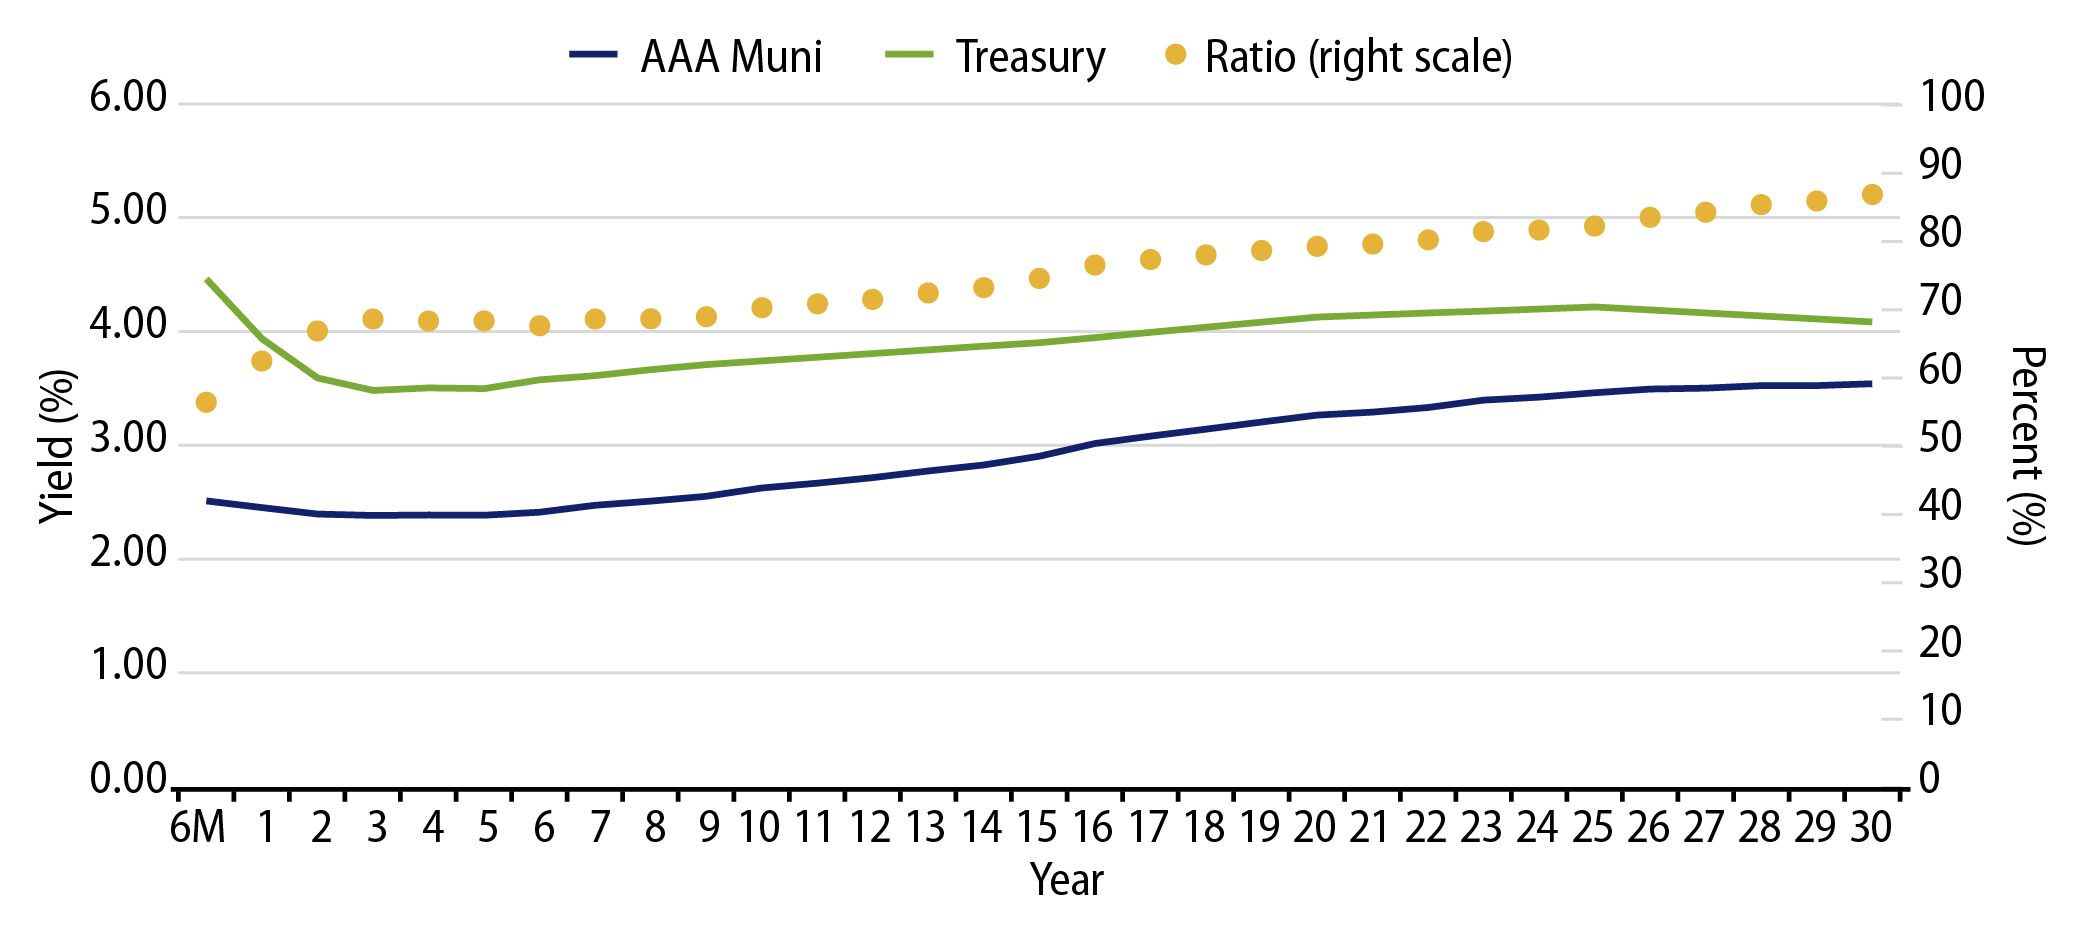
Theme #2: The muni yield curve has disinverted, offering better rolldown opportunity in intermediate maturities.

Exhibit 8: AAA Municipal vs. Treasury Yield Curves
AAA Municipal vs. Treasury Yield Curves
Source: Bloomberg, Western Asset. As of 20 Sep 24. Bloomberg Valuation Service (BVAL) AAA Muni Curve and US On-/Off-the-Run Sovereign Curve. Indexes are unmanaged and one cannot directly invest in them. They do not include fees, expenses or sales charges. Past performance is not an indicator or a guarantee of future results. Select the image to expand the view.

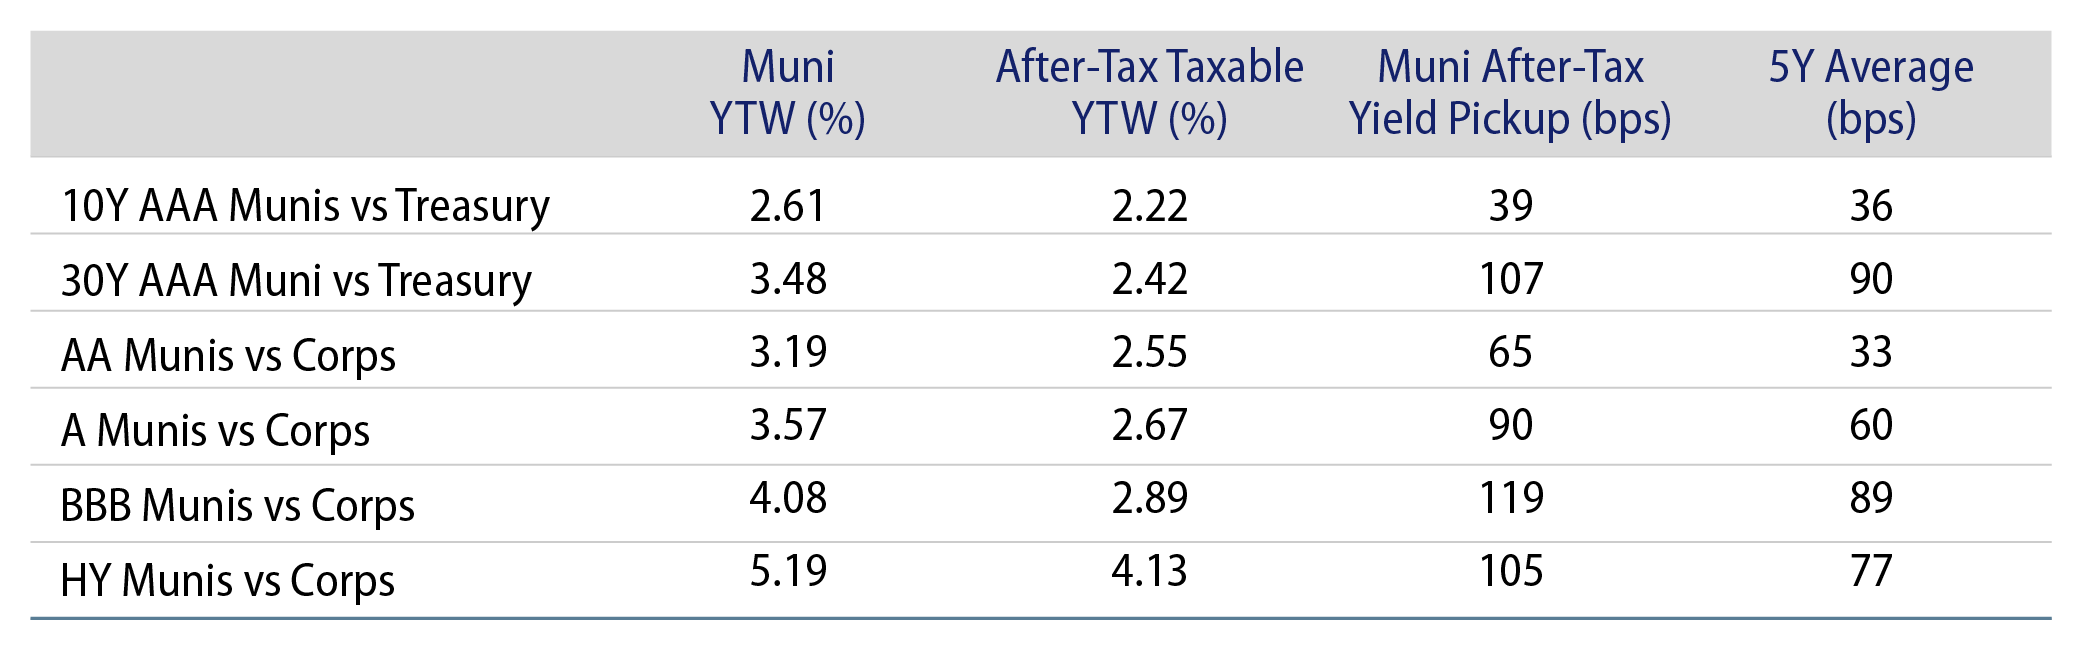
Theme #3: Munis offer attractive after-tax yield pickup versus longer-dated Treasuries and investment-grade corporate credit.

Exhibit 9: Municipal vs. Taxable Fixed-Income Yields by Quality
Municipal vs. Taxable Fixed-Income Yields by Quality
Source: Western Asset, Bloomberg. As 20 Sep 24. 10- and 30-Year comparison reflects Bloomberg Valuation Service (BVAL) AAA Muni Curve and US On-/Off-the-Run Sovereign Curve. AA Muni reflects the Bloomberg AA Muni Bond Index. A Muni reflects the Bloomberg A Muni Bond Index. BBB Muni reflects the Bloomberg BBB Muni Bond Index. HY Muni reflects the Bloomberg High Yield Muni Bond Index. AA Corp reflects the Bloomberg AA Corporate Bond Index. A Corp reflects the Bloomberg A Corporate Bond Index. BBB Corp reflects the Bloomberg BBB Corporate Bond Index. After-tax yield considers top marginal tax rate of 40.8%. Indexes are unmanaged and one cannot directly invest in them. They do not include fees, expenses or sales charges. Past performance is not an indicator or a guarantee of future results. Select the image to expand the view.

© Western Asset Management Company, LLC 2025. The information contained in these materials ("the materials") is intended for the exclusive use of the designated recipient ("the recipient"). This information is proprietary and confidential and may contain commercially sensitive information, and may not be copied, reproduced or republished, in whole or in part, without the prior written consent of Western Asset Management Company ("Western Asset").
Past performance does not predict future returns. These materials should not be deemed to be a prediction or projection of future performance. These materials are intended for investment professionals including professional clients, eligible counterparties, and qualified investors only.
These materials have been produced for illustrative and informational purposes only. These materials contain Western Asset's opinions and beliefs as of the date designated on the materials; these views are subject to change and may not reflect real-time market developments and investment views.
Third party data may be used throughout the materials, and this data is believed to be accurate to the best of Western Asset's knowledge at the time of publication, but cannot be guaranteed. These materials may also contain strategy or product awards or rankings from independent third parties or industry publications which are based on unbiased quantitative and/or qualitative information determined independently by each third party or publication. In some cases, Western Asset may subscribe to these third party's standard industry services or publications. These standard subscriptions and services are available to all asset managers and do not influence rankings or awards in any way.
Investment strategies or products discussed herein may involve a high degree of risk, including the loss of some or all capital. Investments in any products or strategies described in these materials may be volatile, and investors should have the financial ability and willingness to accept such risks.
Unless otherwise noted, investment performance contained in these materials is reflective of a strategy composite. All other strategy data and information included in these materials reflects a representative portfolio which is an account in the composite that Western Asset believes most closely reflects the current portfolio management style of the strategy. Performance is not a consideration in the selection of the representative portfolio. The characteristics of the representative portfolio shown may differ from other accounts in the composite. Information regarding the representative portfolio and the other accounts in the composite are available upon request. Statements in these materials should not be considered investment advice. References, either general or specific, to securities and/or issuers in the materials are for illustrative purposes only and are not intended to be, and should not be interpreted as, recommendation to purchase or sell such securities. Employees and/or clients of Western Asset may have a position in the securities or issuers mentioned.
These materials are not intended to provide, and should not be relied on for, accounting, legal, tax, investment or other advice. The recipient should consult its own counsel, accountant, investment, tax, and any other advisers for this advice, including economic risks and merits, related to making an investment with Western Asset. The recipient is responsible for observing the applicable laws and regulations of their country of residence.
Founded in 1971, Western Asset Management Company is a global fixed-income investment manager with offices in Pasadena, New York, London, Singapore, Tokyo, Melbourne, São Paulo, Hong Kong, and Zürich. Western Asset is a wholly owned subsidiary of Franklin Resources, Inc. but operates autonomously. Western Asset is comprised of six legal entities across the globe, each with distinct regional registrations: Western Asset Management Company, LLC, a registered Investment Adviser with the Securities and Exchange Commission; Western Asset Management Company Ltda. is regulated by Comissão de Valores Mobiliários; Western Asset Management Company Pty Ltd ABN 41 117 767 923 is the holder of the Australian Financial Services License 303160; Western Asset Management Company Pte. Ltd. Co. Reg. No. 200007692R is a holder of a Capital Markets Services License for fund management and regulated by the Monetary Authority of Singapore; Western Asset Management Company Ltd, a registered Financial Instruments Business Operator and regulated by the Financial Services Agency of Japan; and Western Asset Management Company Limited is authorised and regulated by the Financial Conduct Authority ("FCA") (FRN 145930). This communication is intended for distribution to Professional Clients only if deemed to be a financial promotion in the UK as defined by the FCA. This communication may also be intended for certain EEA countries where Western Asset has been granted permission to do so. For the current list of the approved EEA countries please contact Western Asset at +44 (0)20 7422 3000.