Munis Posted Positive Returns Last Week
Municipals posted positive returns last week, with muni yields modestly outperforming Treasuries as the Treasury yield curve steepened amid mixed economic data, including higher-than-expected GDP revisions and lower-than-expected personal income and personal spending data. Meanwhile, high-grade muni yields moved 3 bps lower in intermediate maturities, and supply reached the highest levels of the year. The Bloomberg Municipal Index returned 0.07% during the week, the High Yield Muni Index returned 0.04% and the Taxable Muni Index returned -0.18%. Following the release of the Federal Reserve (Fed) data earlier this month, we provide an update on municipal demand trends.
Muni Inflows and Elevated Supply Persist
Fund Flows (up $ 592 million): During the week ending September 25, weekly reporting municipal mutual funds recorded $592 million of net inflows, according to Lipper. Long-term funds recorded $546 million of inflows, intermediate funds recorded $152 million of inflows and high-yield funds recorded $349 million of inflows. This week’s inflows mark the 13th consecutive week of inflows and lead estimated year-to-date (YTD) net inflows higher to $25 billion.
Supply (YTD supply of $375 billion, up 45% YoY): The muni market recorded $17 billion of new-issue volume last week, more than double the prior week’s level and the highest level of supply recorded during this year of elevated issuance. YTD issuance of $375 billion is 45% higher than last year’s level, with tax-exempt issuance 48% higher and taxable issuance 15% higher year-over-year (YoY). This week’s calendar is expected to remain elevated at $11 billion. Largest deals include $1 billion Northwell Health Obligated Group and $872 million New York Metropolitan Transportation Authority transactions.
This Week in Munis: Holders of Muni Debt
Earlier this month, the Fed released its updated Flow of Funds data, highlighting primary holders of municipal debt as of 2Q24. According to the data, municipal holdings continued to grow across retail individual holders, while holdings among major institutional holders (banks and insurance companies) continued a declining trend.

Municipal holdings across individual holders continued to grow, as total funds and household holdings increased by $53 billion (+2%) during 2Q24 and by $154 billion YoY (+6%) from 2Q23. Individual household municipal holdings recorded the largest growth over the quarter, up $43 billion (+2%) during the quarter and $117 billion (+7%) over the prior 12 months, reflecting the continued demand for customized municipal SMA strategies. Open-end funds and ETFs increased by $4 billion and $2 billion during the quarter, respectively.

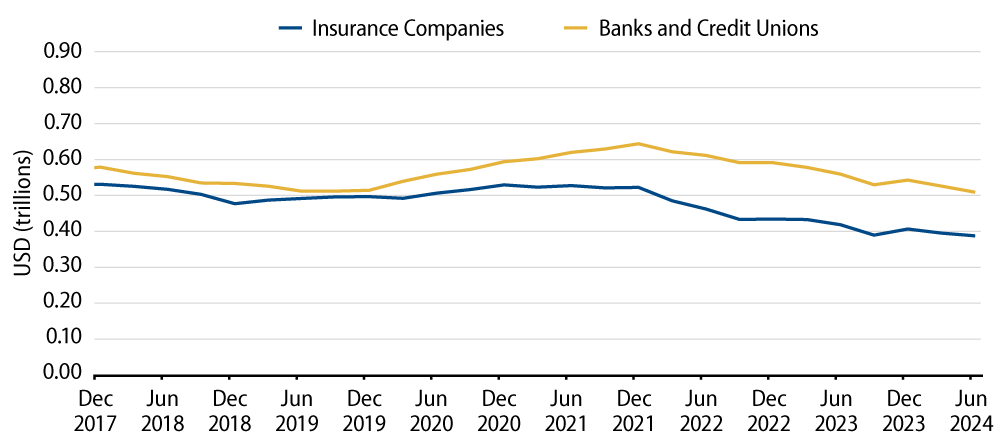
Institutional holdings of municipal debt continued to decline in the second quarter. Insurance company holdings of municipals declined by $8 billion (-2%) in 2Q24 and by $31 billion YoY (-9%) from 2Q23. Bank municipal holdings decreased by $17 billion (-3%) in the second quarter, leading YoY bank holdings lower by $50 billion (-9%) from 2Q23. The continued drag on institutional municipal holdings is attributable to lower corporate tax rates, increased tender/call activity of taxable municipal debt and bank balance sheet de-risking of longer-duration municipal assets.
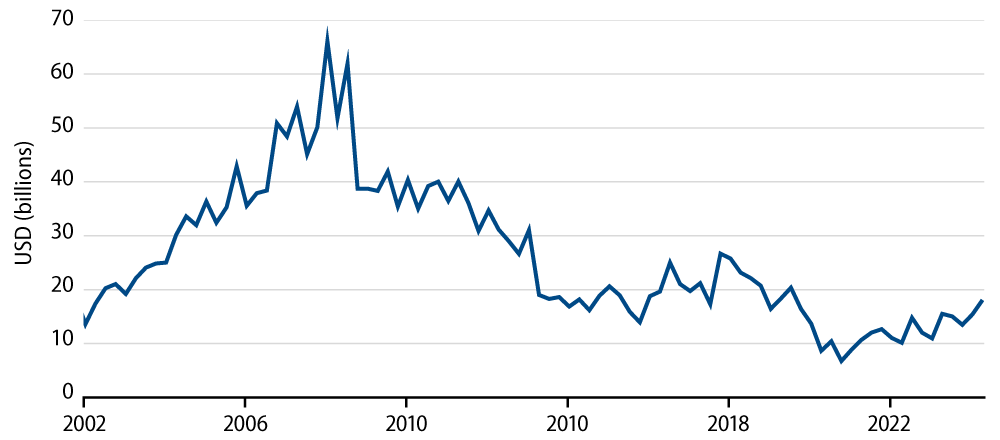
Broker/dealer inventories continued to show signs of growth in the second quarter. Broker/dealer municipal inventories have steadily declined since the GFC to lows of $7 billion reported in 2020. In the second quarter, broker/dealer inventories increased by 17% to $18 billion. While still historically low, the improvement in intermediary exposure represents potential improvement in municipal liquidity.
The Fed data highlights positive demand from individual buyers who benefit from the municipal tax exemption and have signaled a greater willingness to re-enter the market this year, considering the most recent rate-hiking cycle appears to have peaked. However, the greater buyer-base concentration to individuals from institutions can contribute to potential volatility amid shifts in market sentiment. Western Asset believes active managers that can navigate liquidity amid bouts of volatility stand to benefit from these changing market dynamics.
Municipal Credit Curves and Relative Value


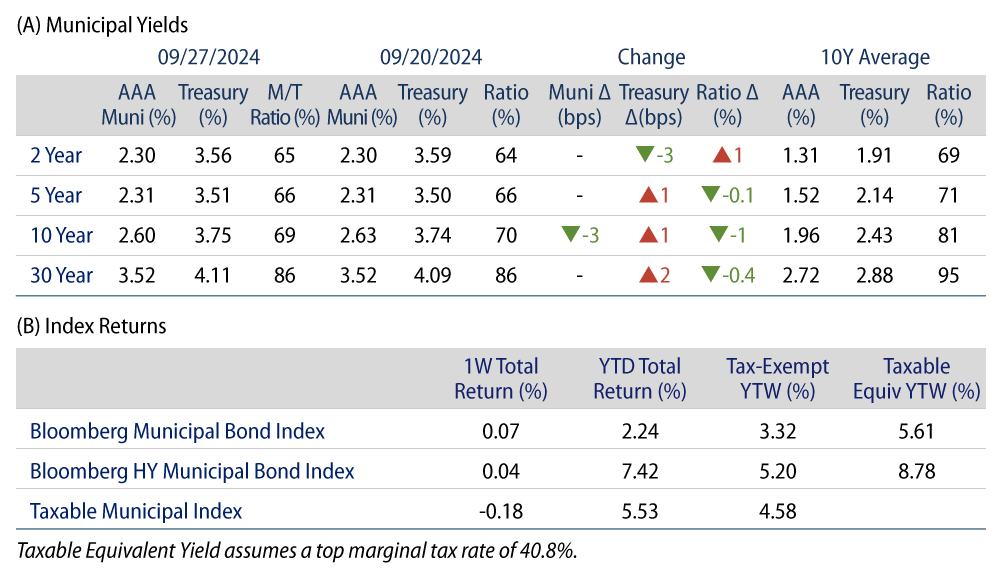
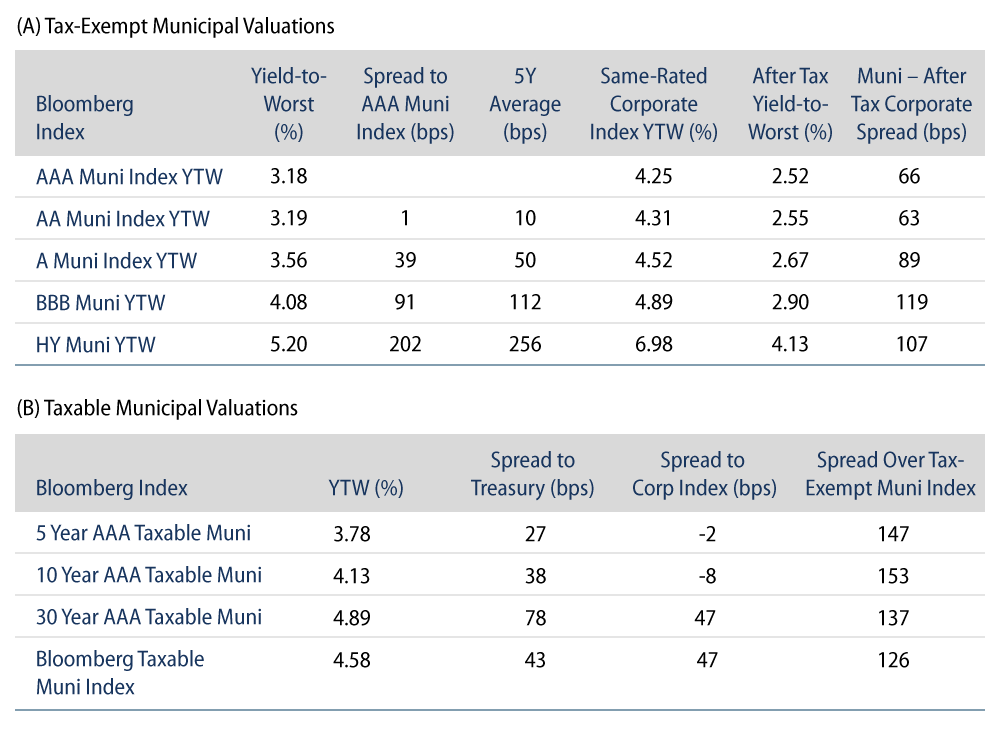
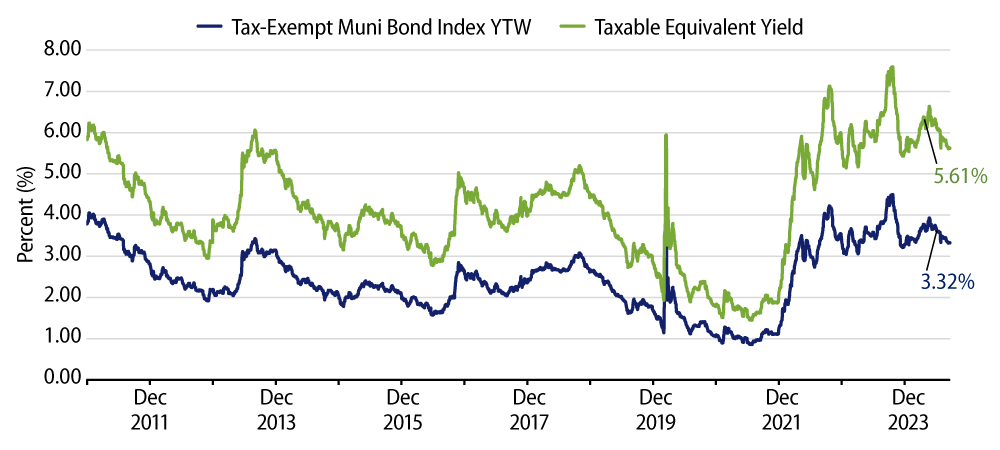
Theme #1: Municipal taxable-equivalent yields remain above decade averages.
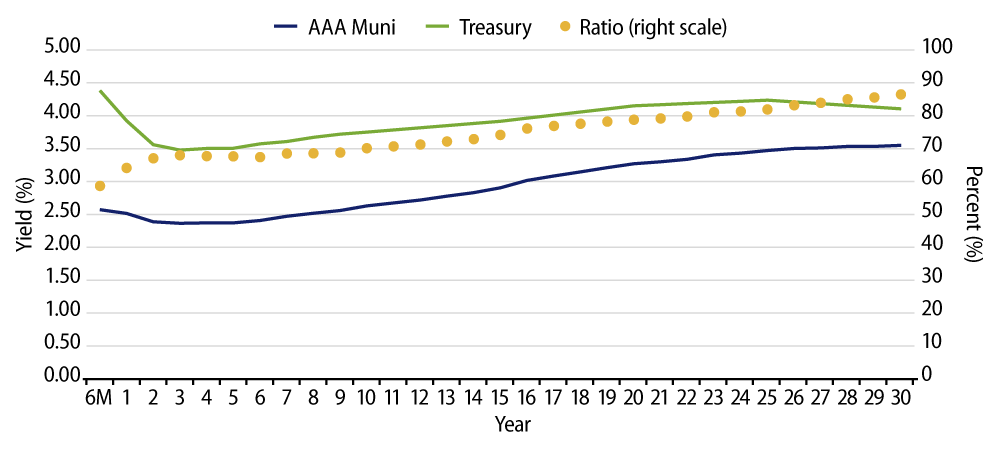
Theme #2: The muni yield curve has largely disinverted, offering better rolldown opportunity in intermediate maturities.
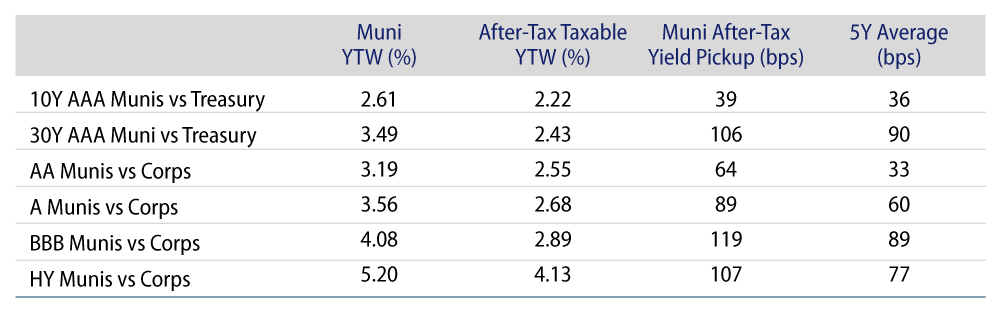
Theme #3: Munis offer attractive after-tax yield pickup versus longer-dated Treasuries and investment-grade corporate credit.