Macros, Markets and Munis
Munis sold off in sympathy with Treasuries last week as Treasury yields moved 11 basis points (bps) higher across the curve. Muni yields followed suit and modestly underperformed amid elevated supply conditions. Fixed-income markets were volatile last week given ongoing tariff rhetoric and generally weak economic data. ISM manufacturing data led the week with a weaker-than-expected reading, followed by February ADP employment data that came in below expectations. Finally, on Friday, nonfarm payrolls also came in lower than expected, leading the unemployment rate slightly higher to 4.1%. This week we highlight the potential impact of federal austerity measures on the muni market.
Supply and Demand Trends Remain Positive
Fund Flows (up $872 million): During the week ending March 5, weekly reporting municipal mutual funds recorded $872 million of net inflows, according to Lipper. Long-term funds recorded $601 million of inflows, intermediate funds recorded $113 million of inflows and high-yield funds recorded $682 million of inflows. Last week’s flows marked a seventh consecutive week of inflows and led year-to-date (YTD) inflows higher to $9 billion.
Supply (YTD supply of $92 billion; up 45% YoY): The muni market recorded $15 billion of new-issue supply last week, up 55% from the prior week and representing the highest weekly level of the year. YTD, the muni market has recorded $92 billion of new issuance, up 45% year-over-year (YoY). This week’s calendar is expected to remain elevated at $12 billion. The largest deals include $1.5 billion New York Transitional Finance Authority and $650 million University of Texas transactions.
This Week in Munis: Federal Spending Cuts
As a public sector, the municipal market spans many sectors that fund various purposes with diverging degrees of federal support. At this juncture, we do not anticipate widespread municipal market stress associated with federal funding reductions. However, the Trump administration’s rhetoric around significant funding reductions warrants scrutiny of certain issuers that have outsized exposure to federal funding.
General obligation and essential service revenue bonds (i.e., for water, electric utilities and transportation) typically have limited exposure to direct federal funding, which often range from 10% to 30%, depending on the issuer. Considering the limited federal funding and essential nature of services provided, we do not anticipate significant funding reductions or material credit implications associated with federal austerity for traditional tax-backed state and local entities and essential service revenue providers.
Other revenue-backed sectors have greater degrees of federal funding, particularly higher education, health care, and not-for-profit entities that have significant direct or indirect exposure to federal funding and warrant heightened scrutiny given the administration’s rhetoric around whether certain institutions should benefit from the federal government. As an example, the federal government announced it would not fund $400 million of previously committed grants to Columbia University. Perhaps the most at-risk entities include federal lease-backed securities, where revenues from the federal government can directly support a security. These securities can range from Grant Anticipation Revenue Vehicles (GARVEEs) to fund highway projects and other federal lease programs that can fund a variety of projects.
The diverging implications of funding cuts to municipal issuers and sectors underscore the value of diligent credit analysis within municipal portfolios. For sectors heavily reliant on federal funding, we are placing a greater focus on credits with strong financial reserves, diversified revenue sources and proactive management teams that can navigate operations around potentially changing funding conditions. For municipal securities backed by federal government lease payments, we are focusing heavy scrutiny around the essentiality of the security, stability and reliability of user fees and lease agreements. Ultimately, we expect credit volatility to depend on whether federal funding reductions reach state, local or issue levels, which as of now appear limited.
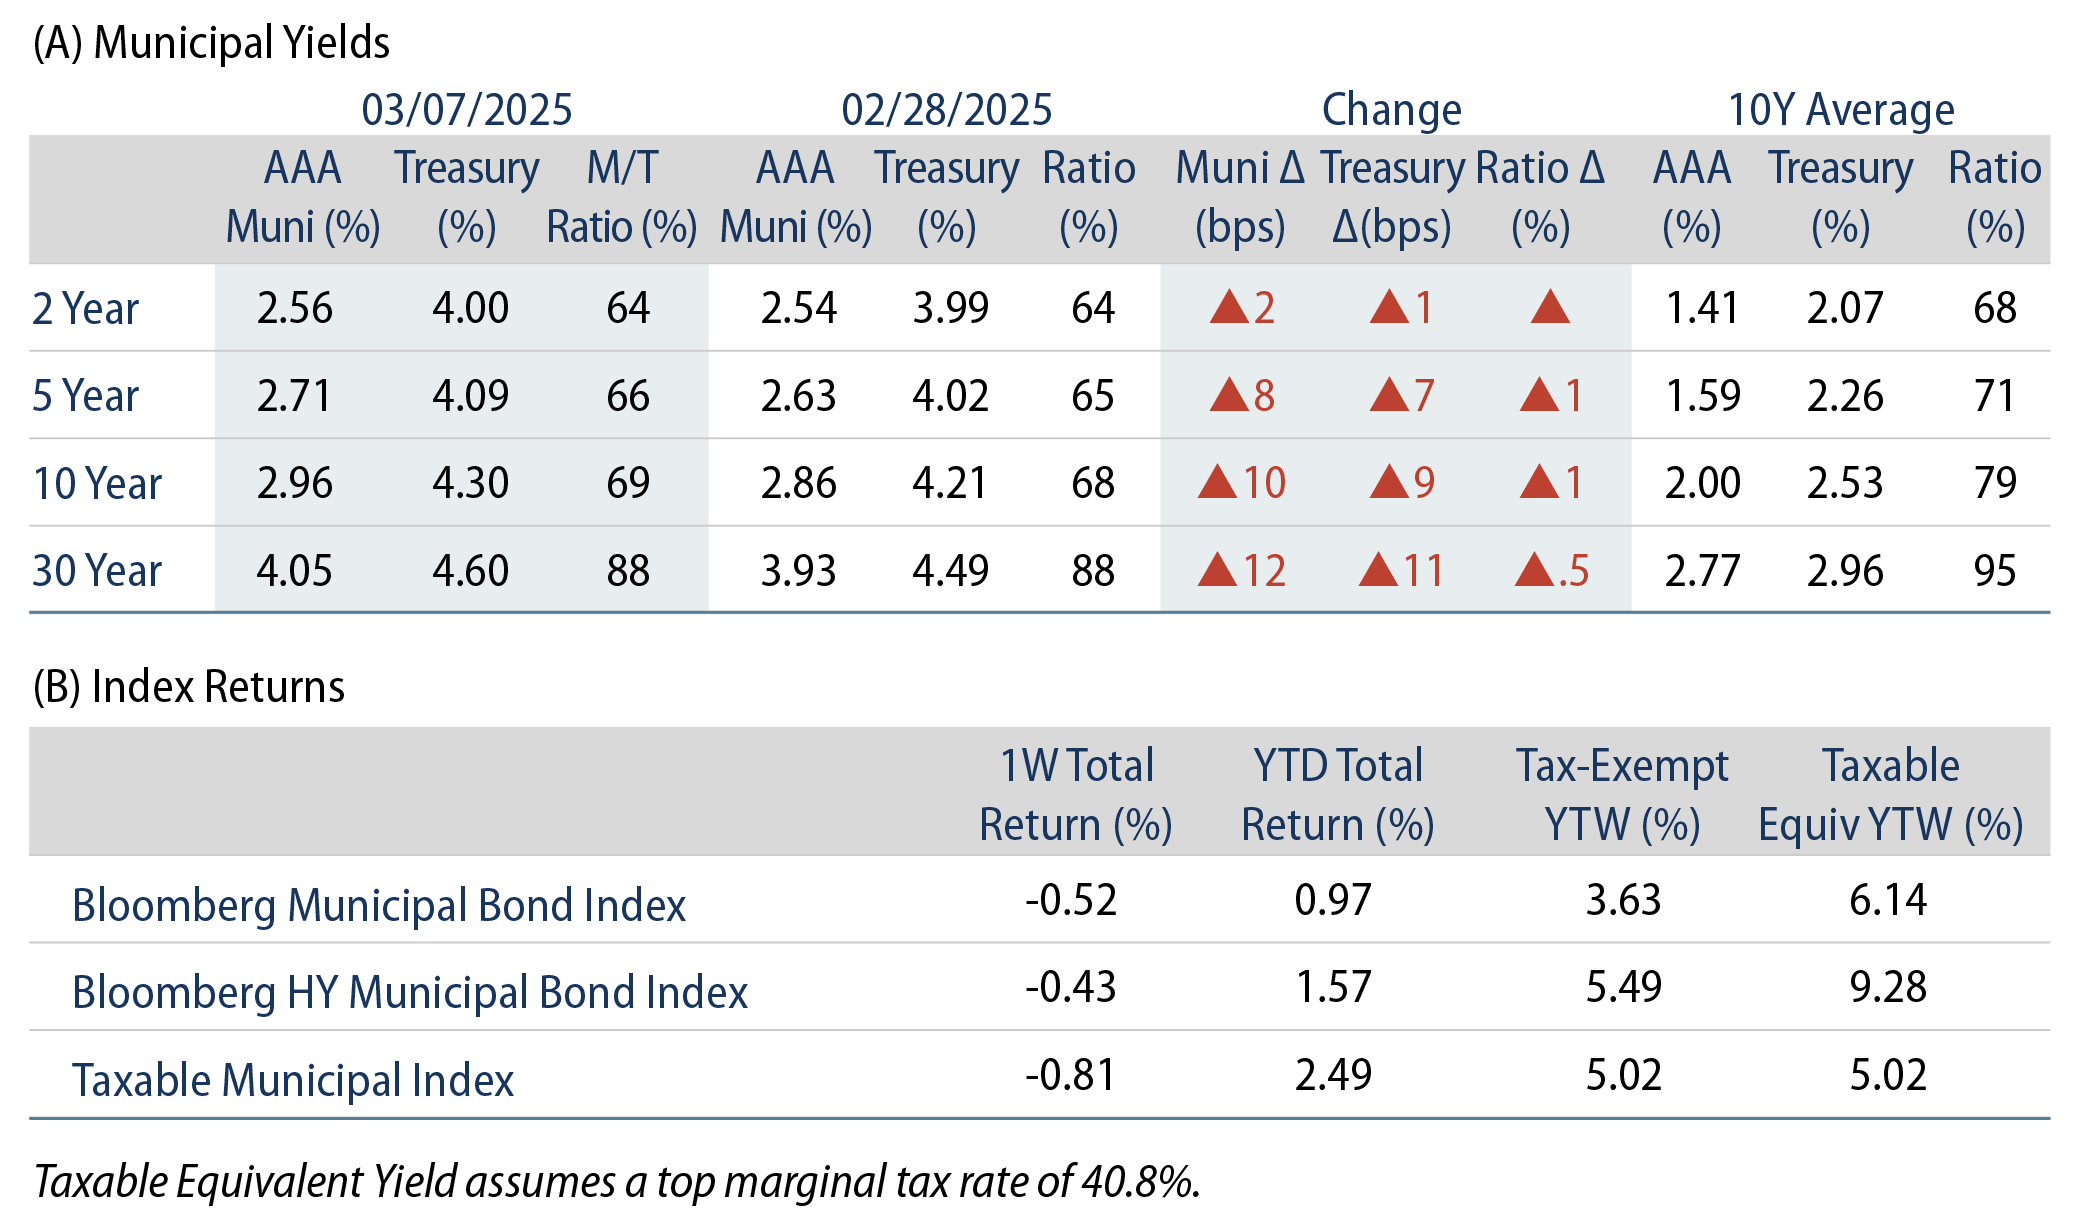
Municipal Credit Curves and Relative Value
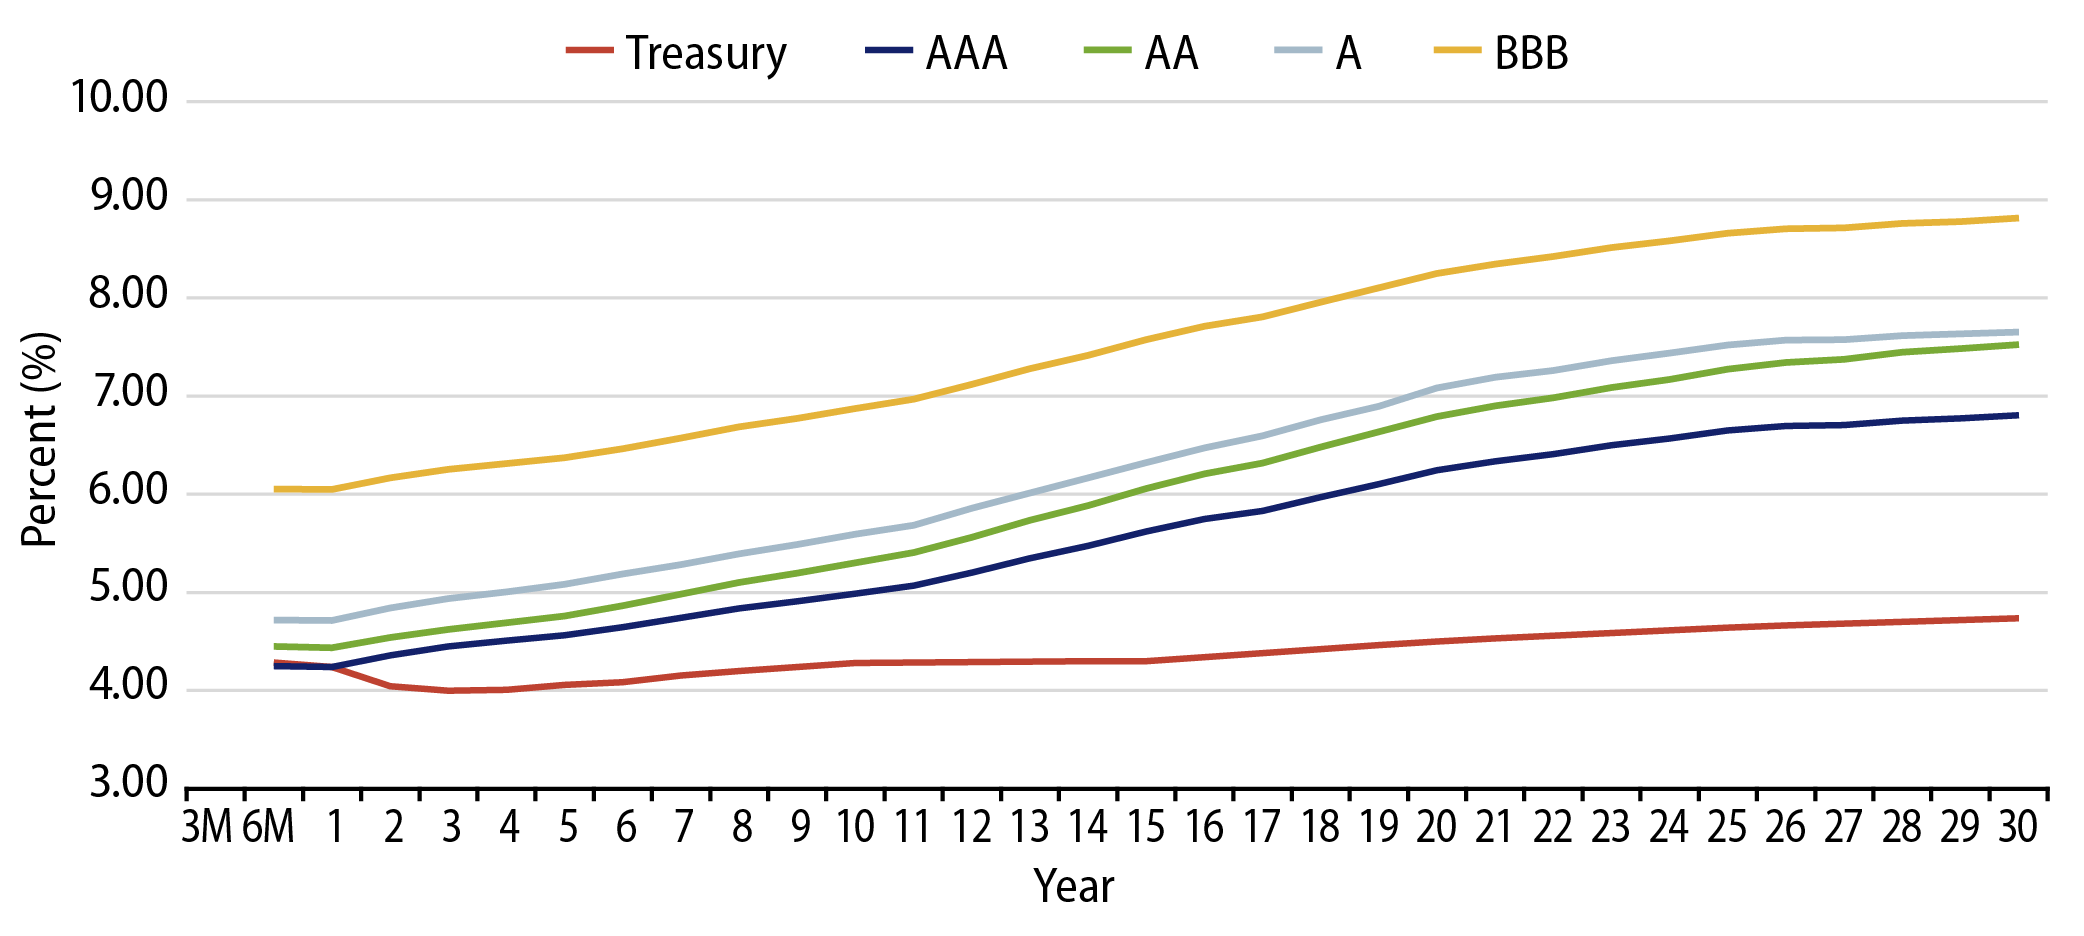

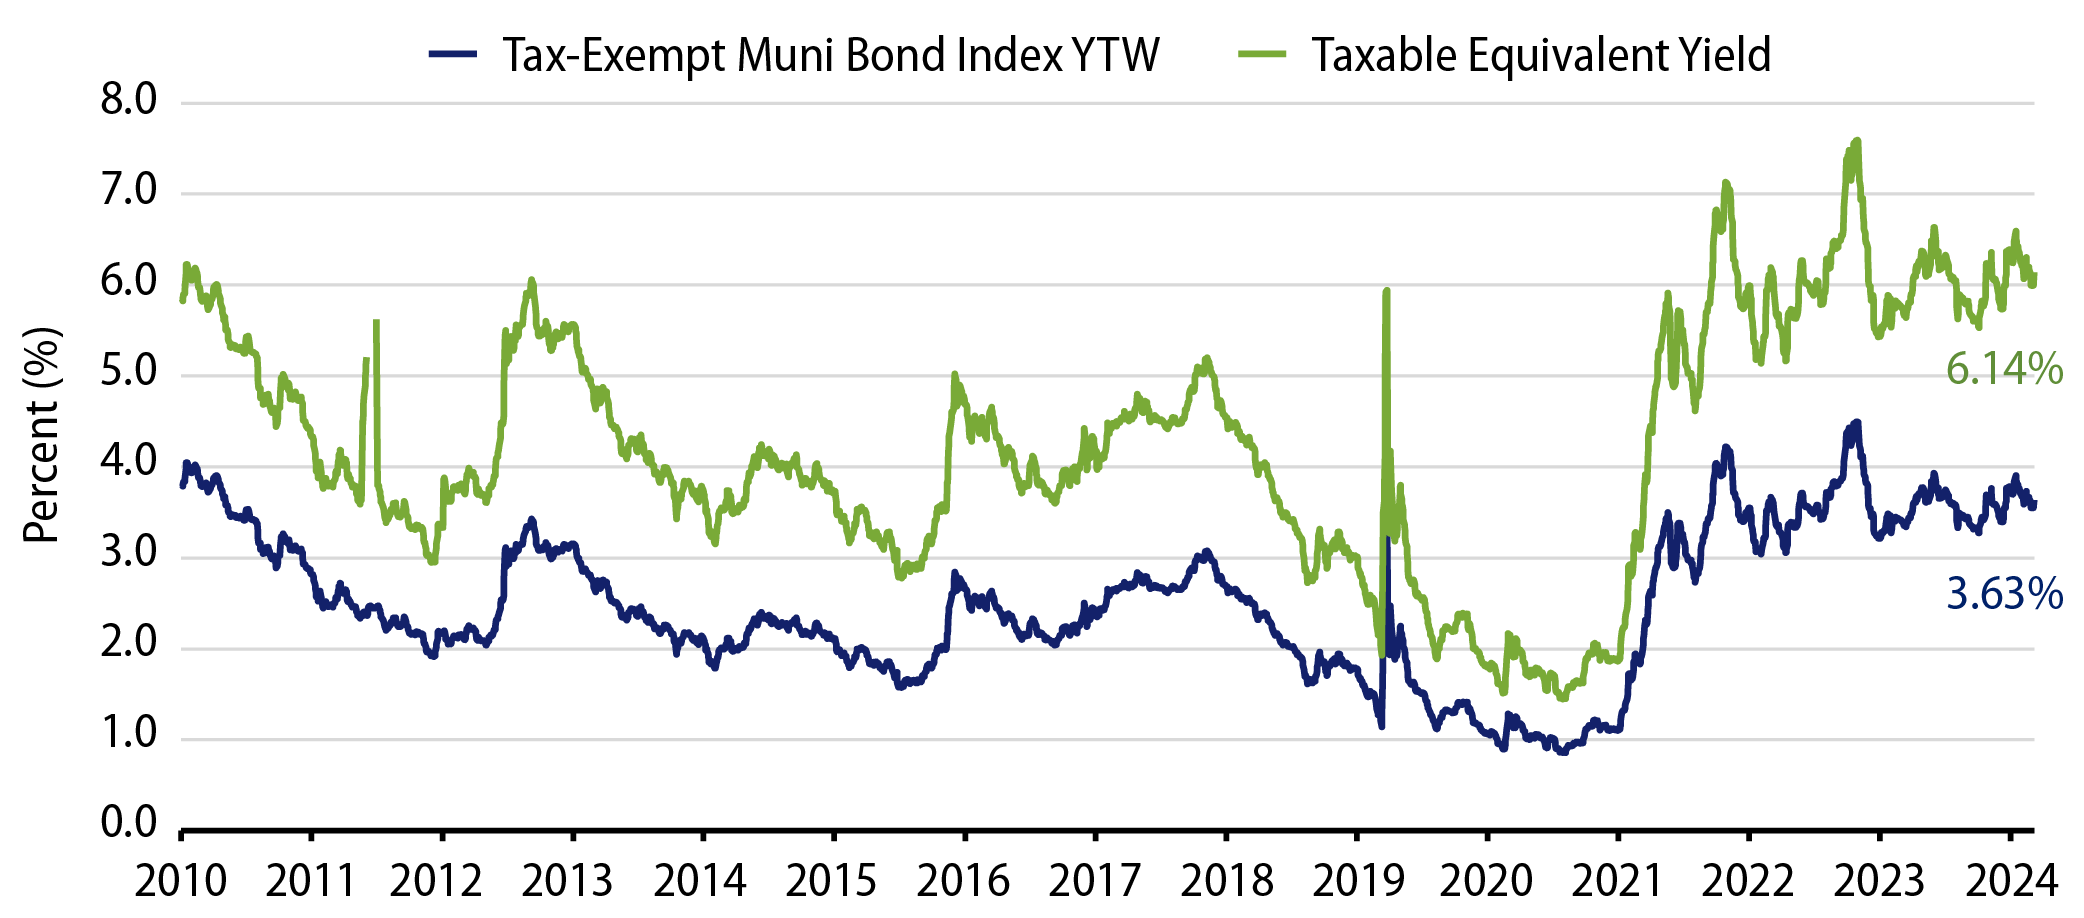
Theme #1: Municipal taxable-equivalent yields and income opportunities remain above decade averages.
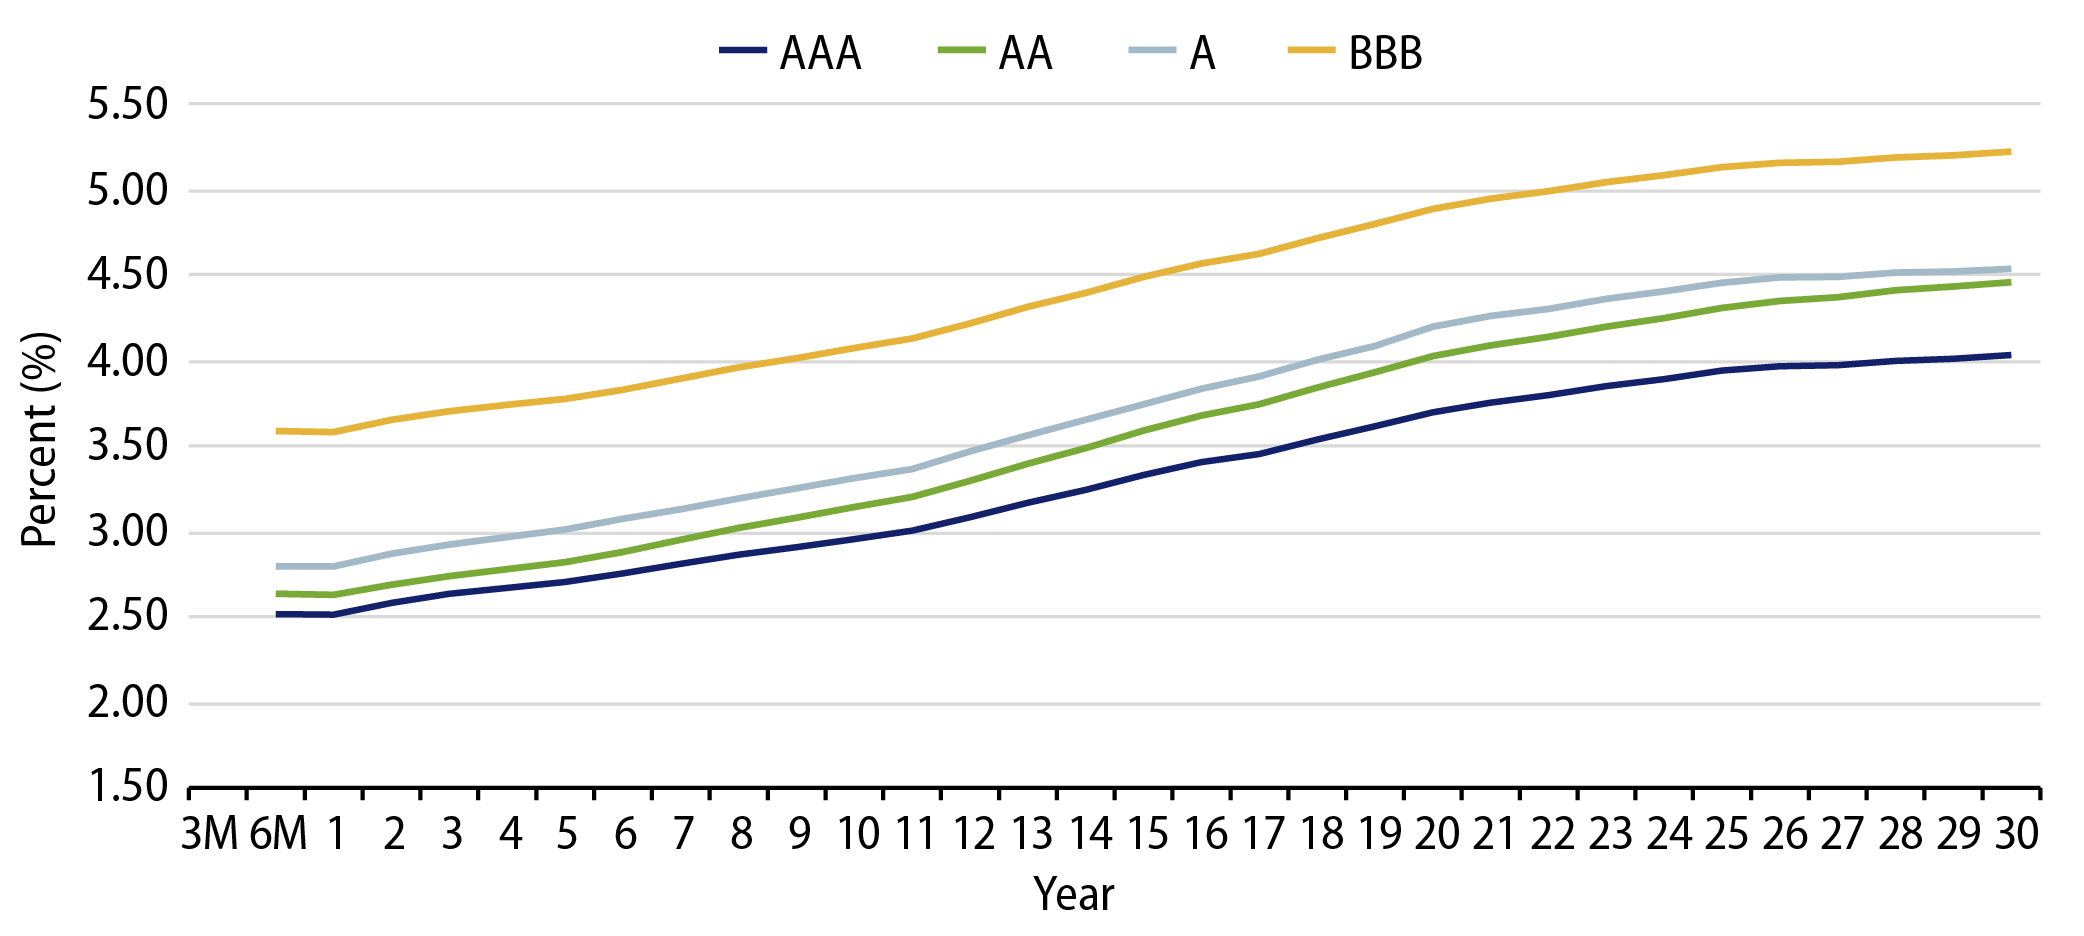
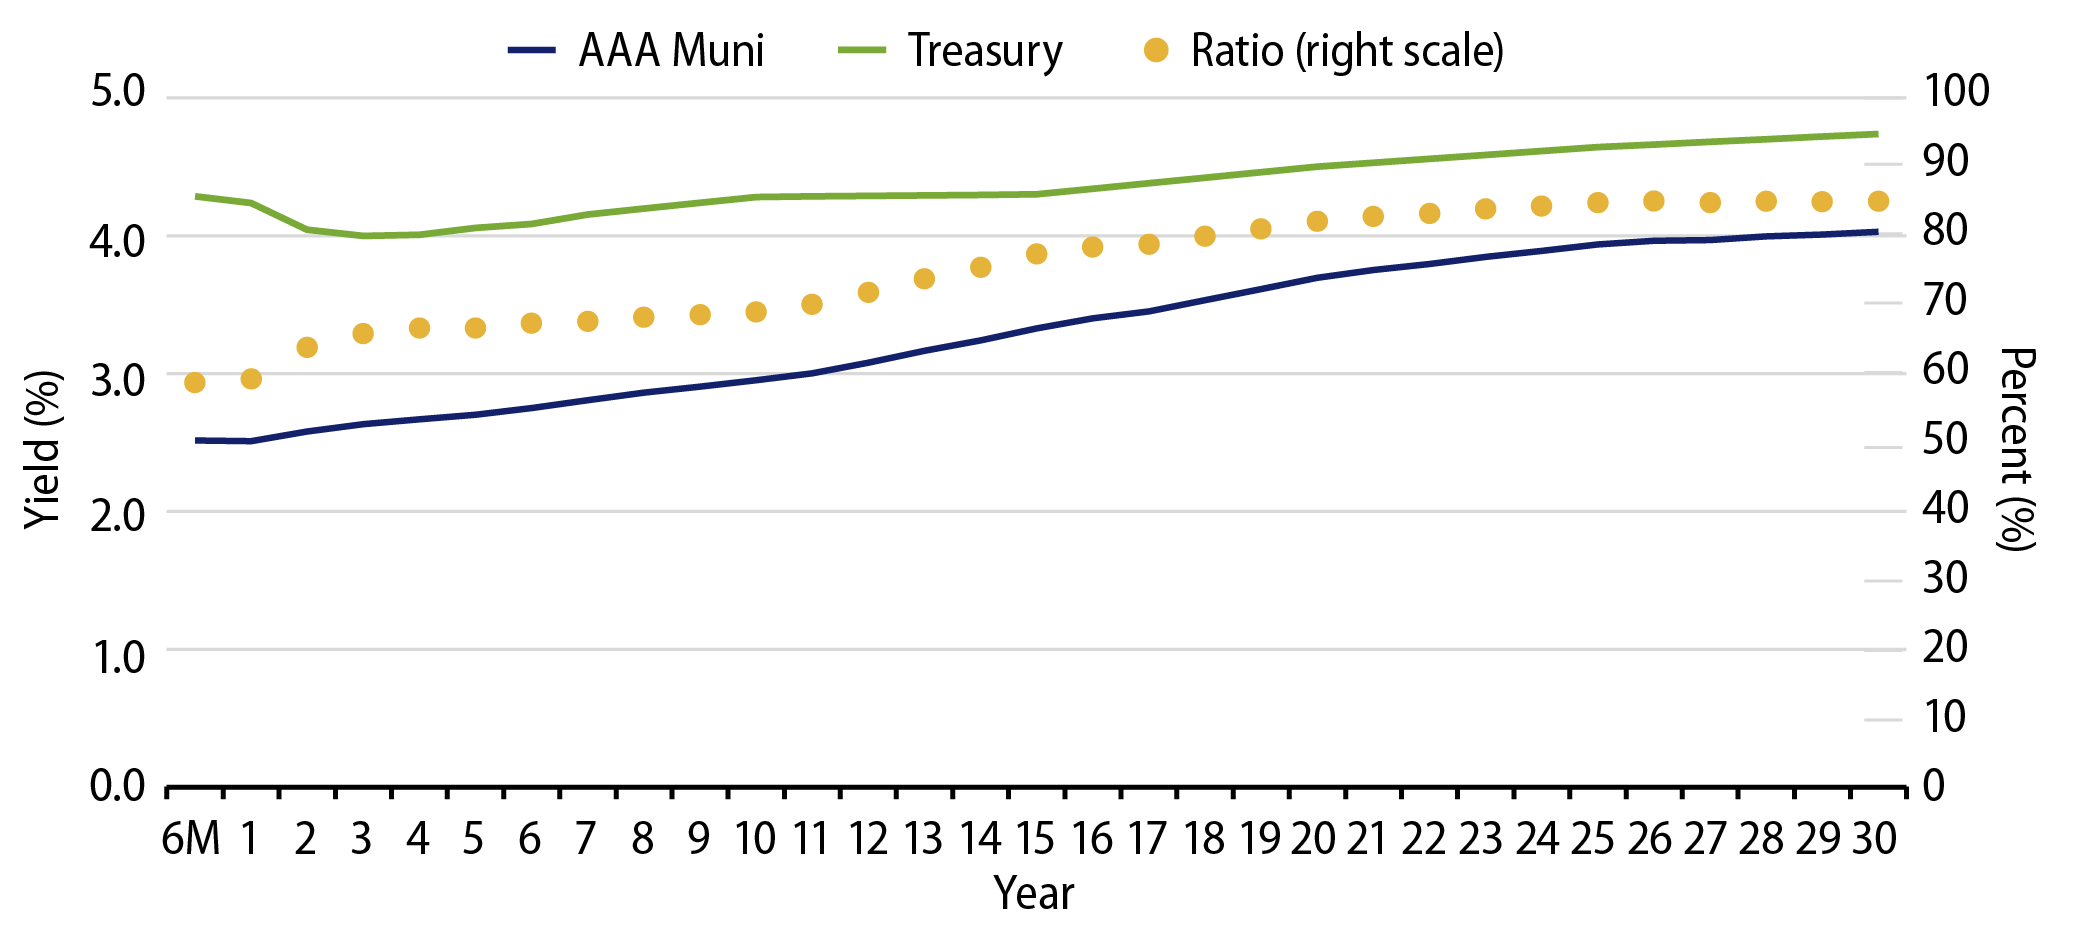
Theme #2: The muni curve has steepened, offering better value in intermediate and longer maturities.
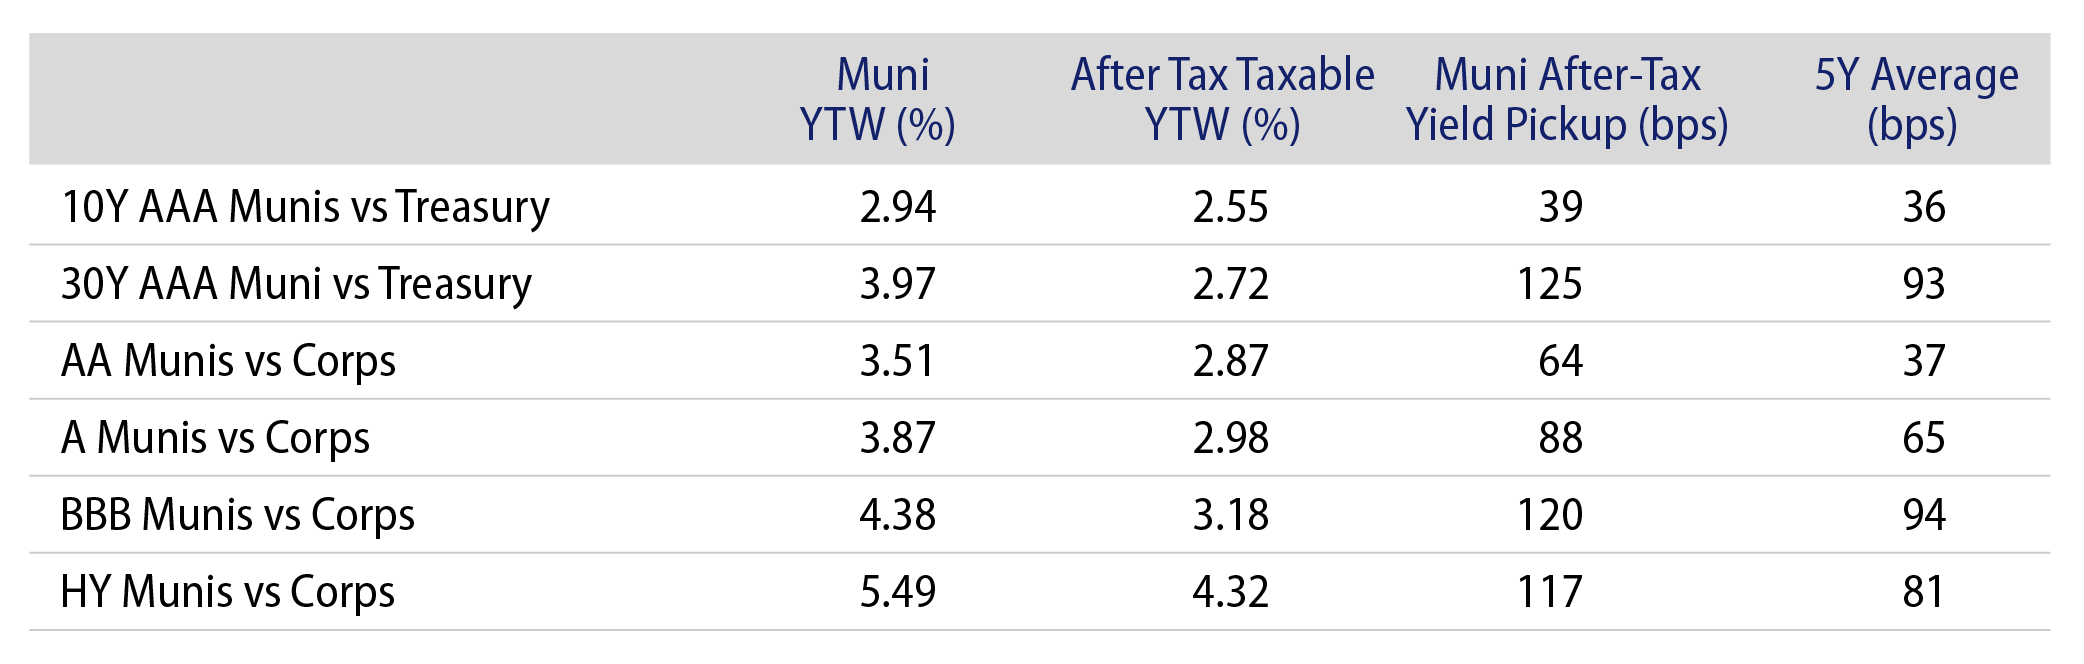
Theme #3: Munis offer attractive after-tax yield pickup versus longer-dated Treasuries and investment-grade corporate credit.