Macros, Markets and Munis
Municipals posted positive returns last week as Treasury yields moved 2-4 basis points (bps) lower across the curve, while high-grade munis generally followed rates lower. Amid global geopolitical tensions, retail sales data trended lower and came in below expectations ahead of the Federal Reserve’s (Fed) June meeting. Fed officials left the fed funds rate target range unchanged at 4.25% to 4.50%, but continued to highlight 50 bps of cuts expected this year. Meanwhile, muni supply remained elevated despite the holiday-shortened week. This week we highlight newly updated Flow of Funds data from the Fed.
Muni Issuance Remained Elevated Despite the Holiday
Fund Flows (up $111 million): During the week ending June 18, weekly reporting municipal mutual funds recorded $111 million of net inflows, according to Lipper. Short and short-intermediate categories recorded the majority inflows at $211 million, collectively. Long-term funds recorded $93 million of outflows, intermediate funds recorded $8 million of outflows and high-yield funds recorded $58 million of inflows. Last week’s inflows marked an eighth consecutive week of inflows and led year-to-date (YTD) inflows higher to $9 billion.
Supply (YTD supply of $271 billion; up 25% YoY): The muni market recorded $9.5 billion of new-issue supply last week, remaining near elevated levels despite a holiday-shortened week. YTD new-issue supply of $271 billion is 25% higher than the prior record year’s pace, with tax-exempt issuance up 9% and taxable issuance up 26%, respectively. This week’s calendar is expected to increase to $15 billion. The largest deals include $1.5 billion Los Angeles Revenue Anticipation Notes and $885 million North Texas Municipal Water District transactions.
This Week in Munis: Federal Reserve Muni Holder Data
Earlier this month the Fed released updated Flow of Funds data highlighting the primary holders of municipal debt through the first quarter of 2025. According to the data, the size of the municipal market declined by 0.5% in 1Q25, which is relatively consistent with the Bloomberg Municipal Bond Index return of -0.2% for the same period.
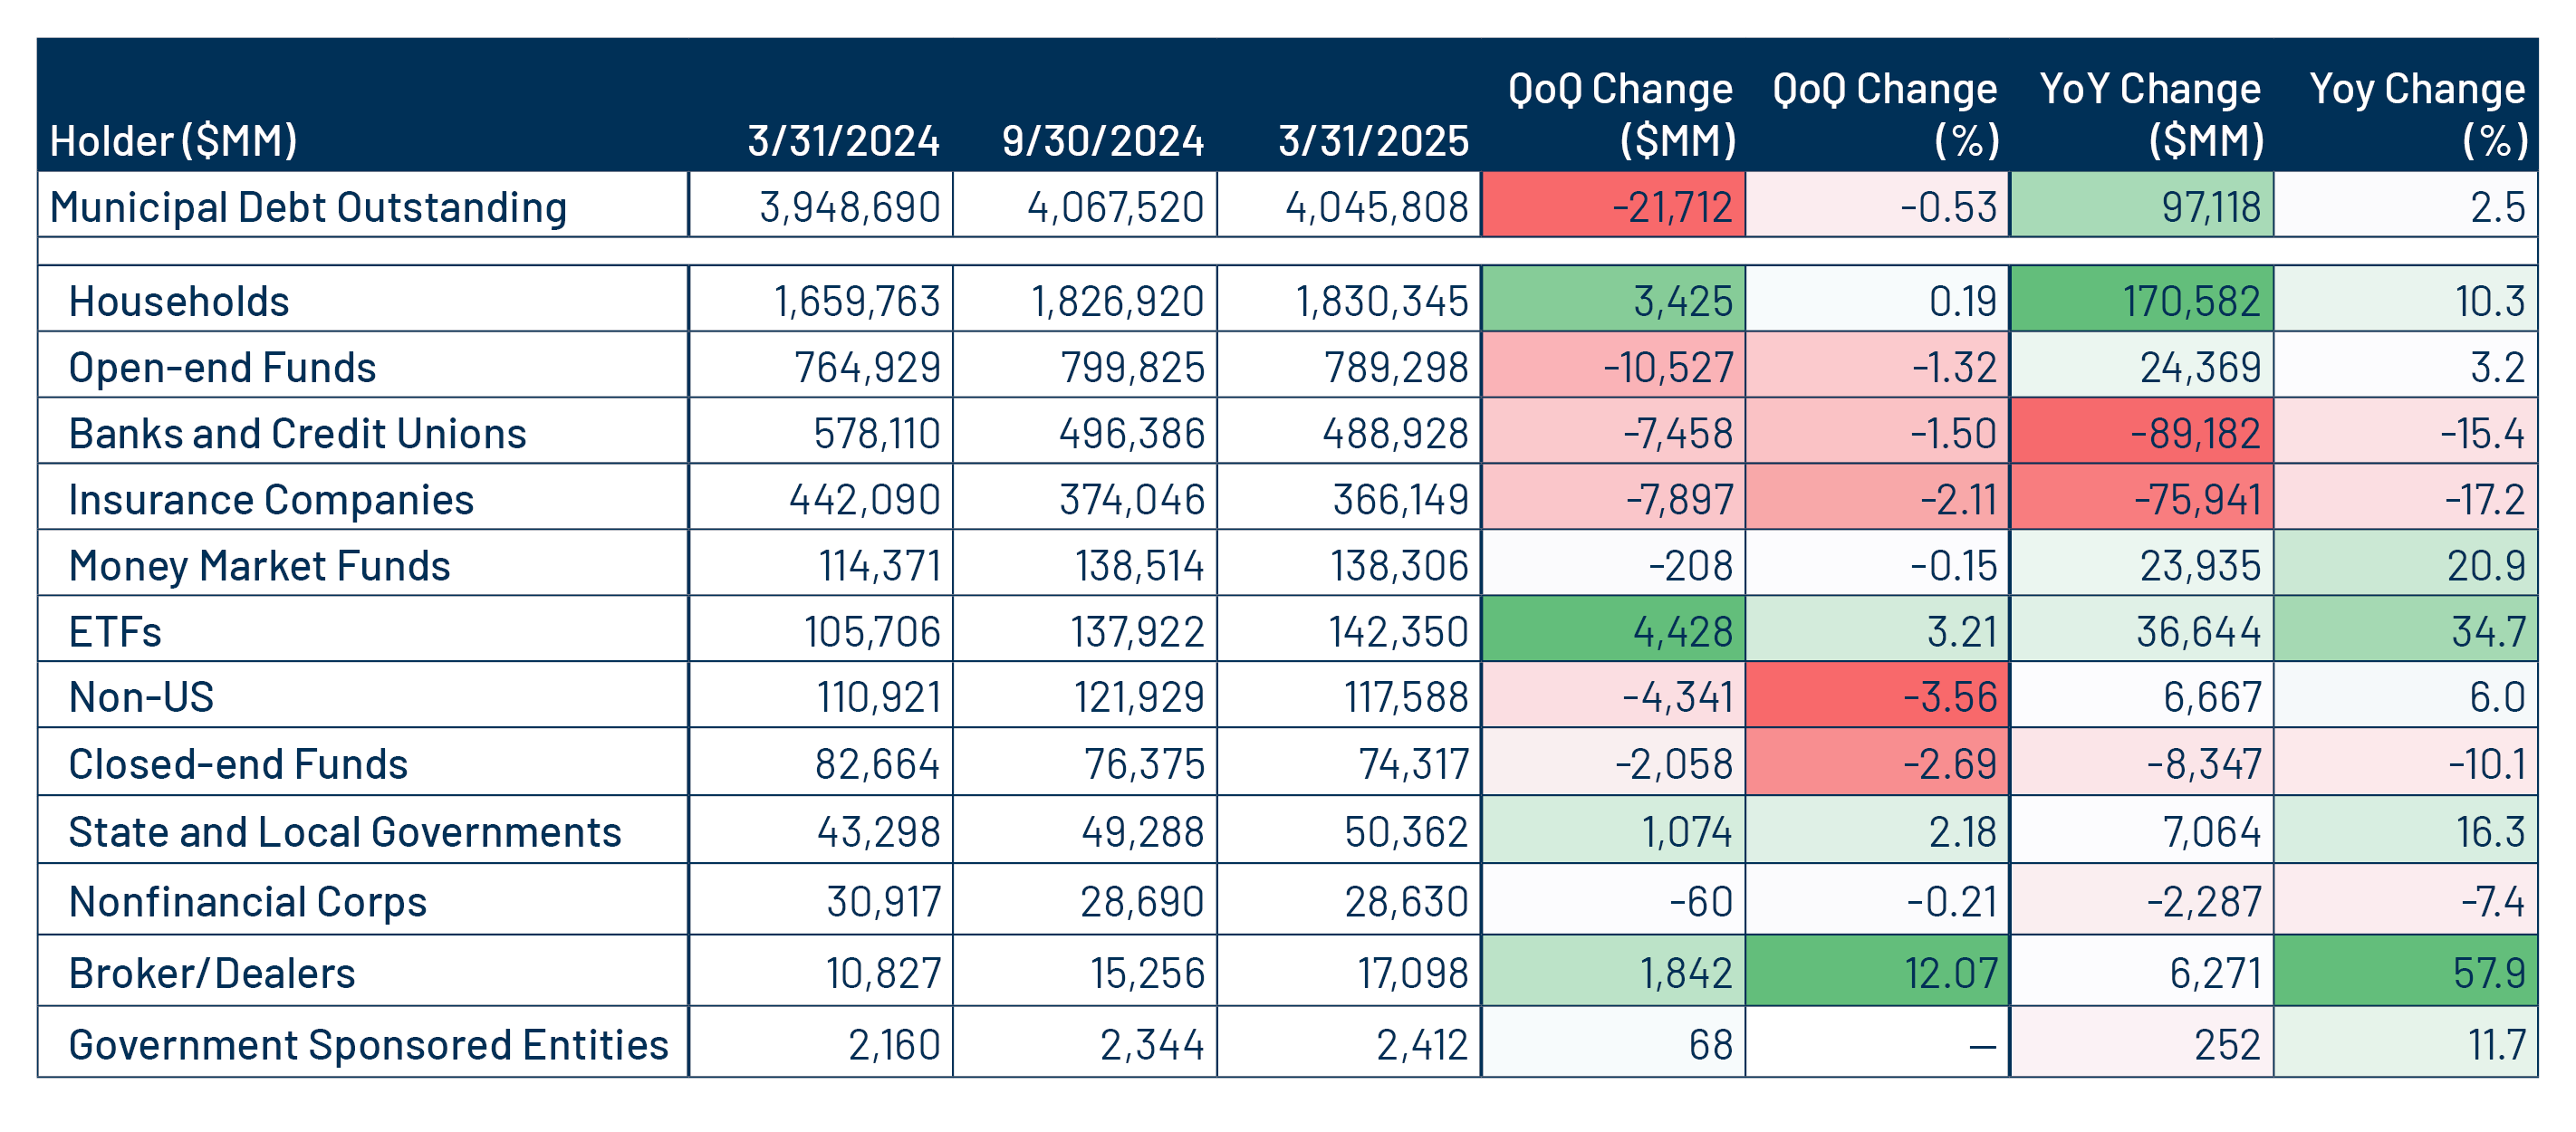
The holders data indicated a continued shift away from institutional investors toward an individual buyer base, extending a trend that began in 2018 when corporate tax rates were lowered to 21%. In the first quarter, insurance companies, bank municipal holders, and non-US municipal holders saw declines of $7.9 billion (-2.1%), $7.5 billion (-1.5%) and $4.3 billion (-3.6%), respectively. Meanwhile, the largest growth segments were among ETF and individual households, which increased by $4.4 billion (+3.2%) and $3.4 billion (+0.2%), respectively.

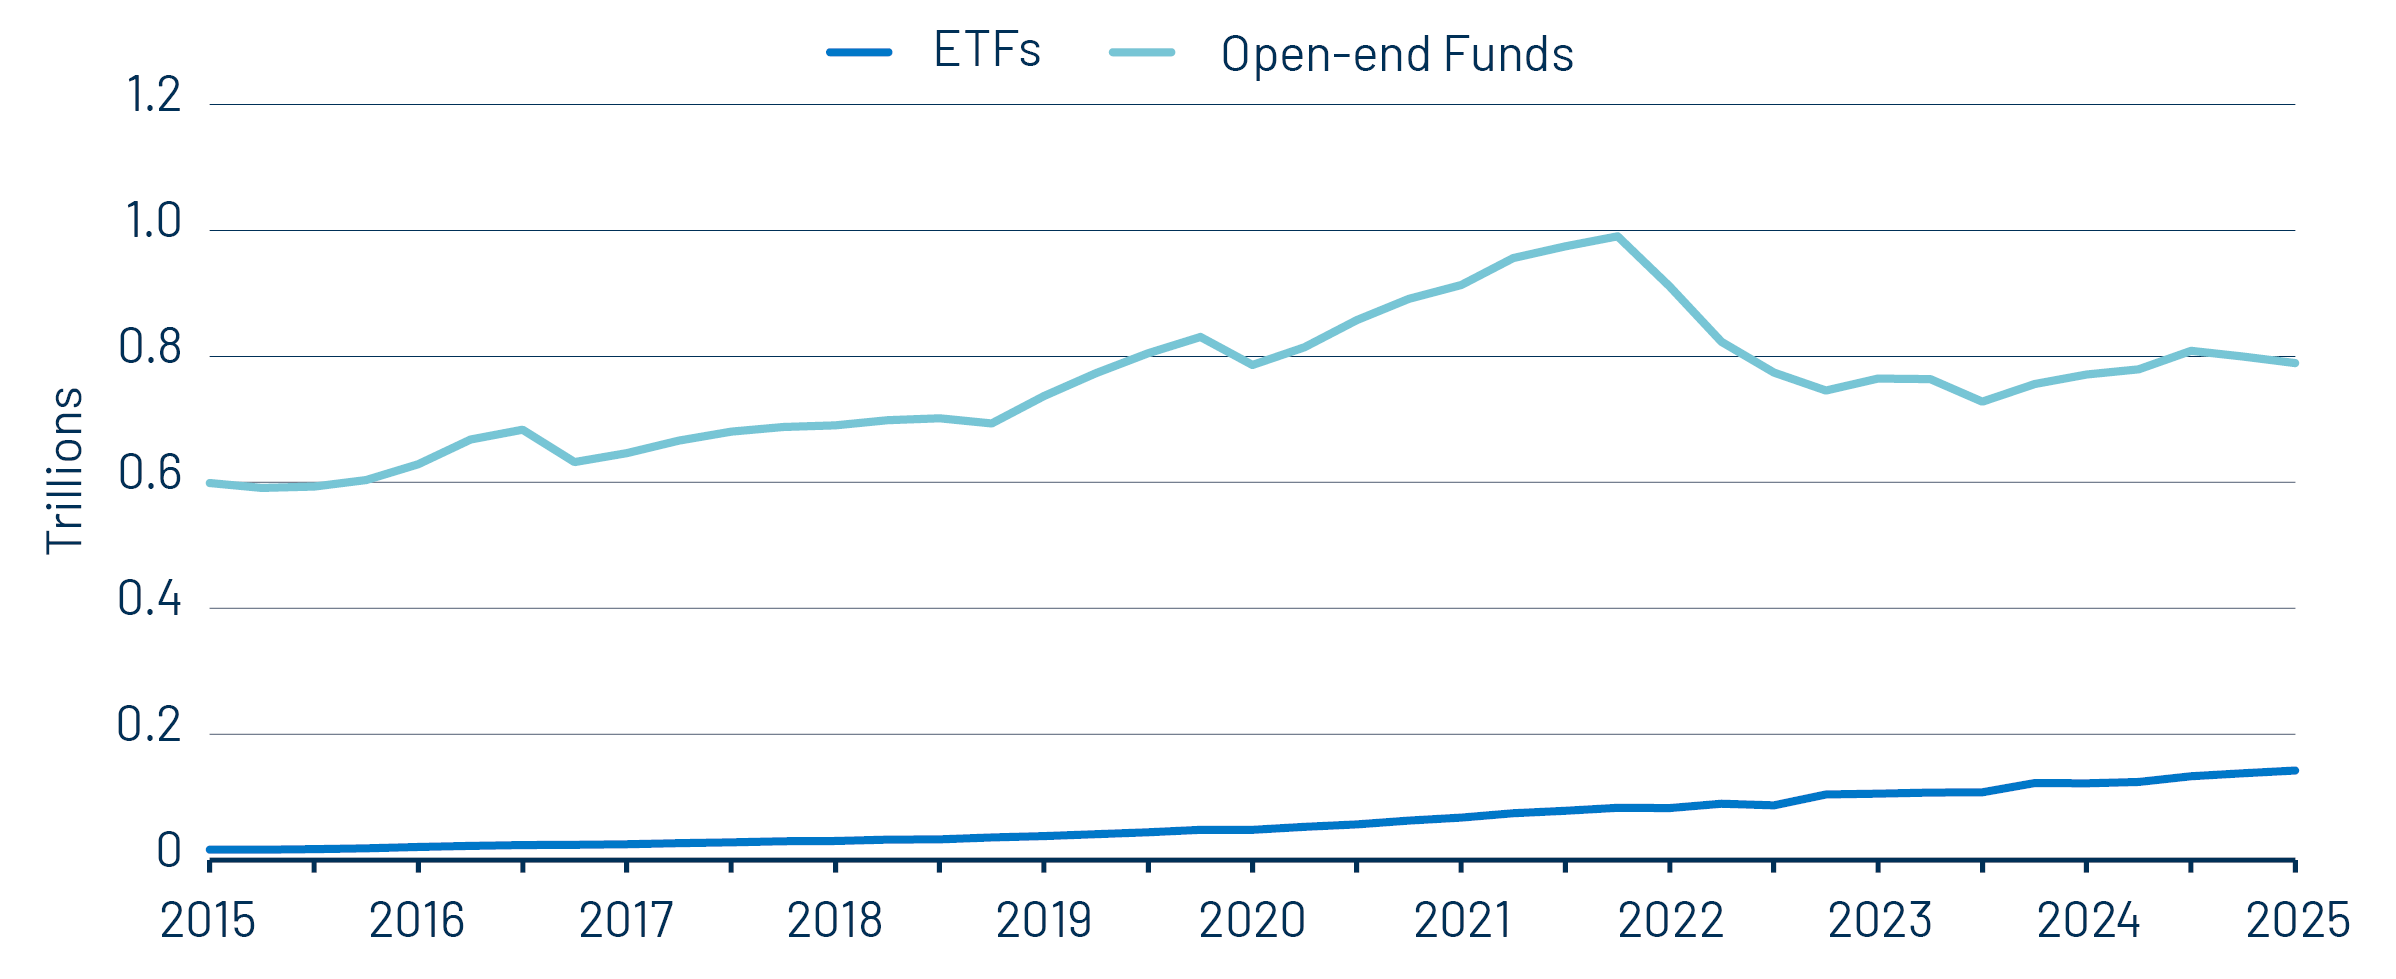
While ETFs garnered $4 billion of assets in 1Q25, open-end fund assets declined by $10 billion. The first quarter ETF growth extended a strong $36 billion, 35% year-over-year (YoY) growth trend that outpaced the $24 billion, 2.4% YoY growth rate of legacy open-end funds.
As institutional investors continue to step away from traditional municipal assets, the market is becoming increasingly concentrated among individual retail buyers and ETF allocations, which are often incorporated into model portfolios. Given the relative liquidity challenges associated with the municipal market, we anticipate that this concentration could lead to near-term bouts of volatility. However, such volatility can present long-term income and total return opportunities for active managers who are able to navigate these evolving liquidity dynamics.
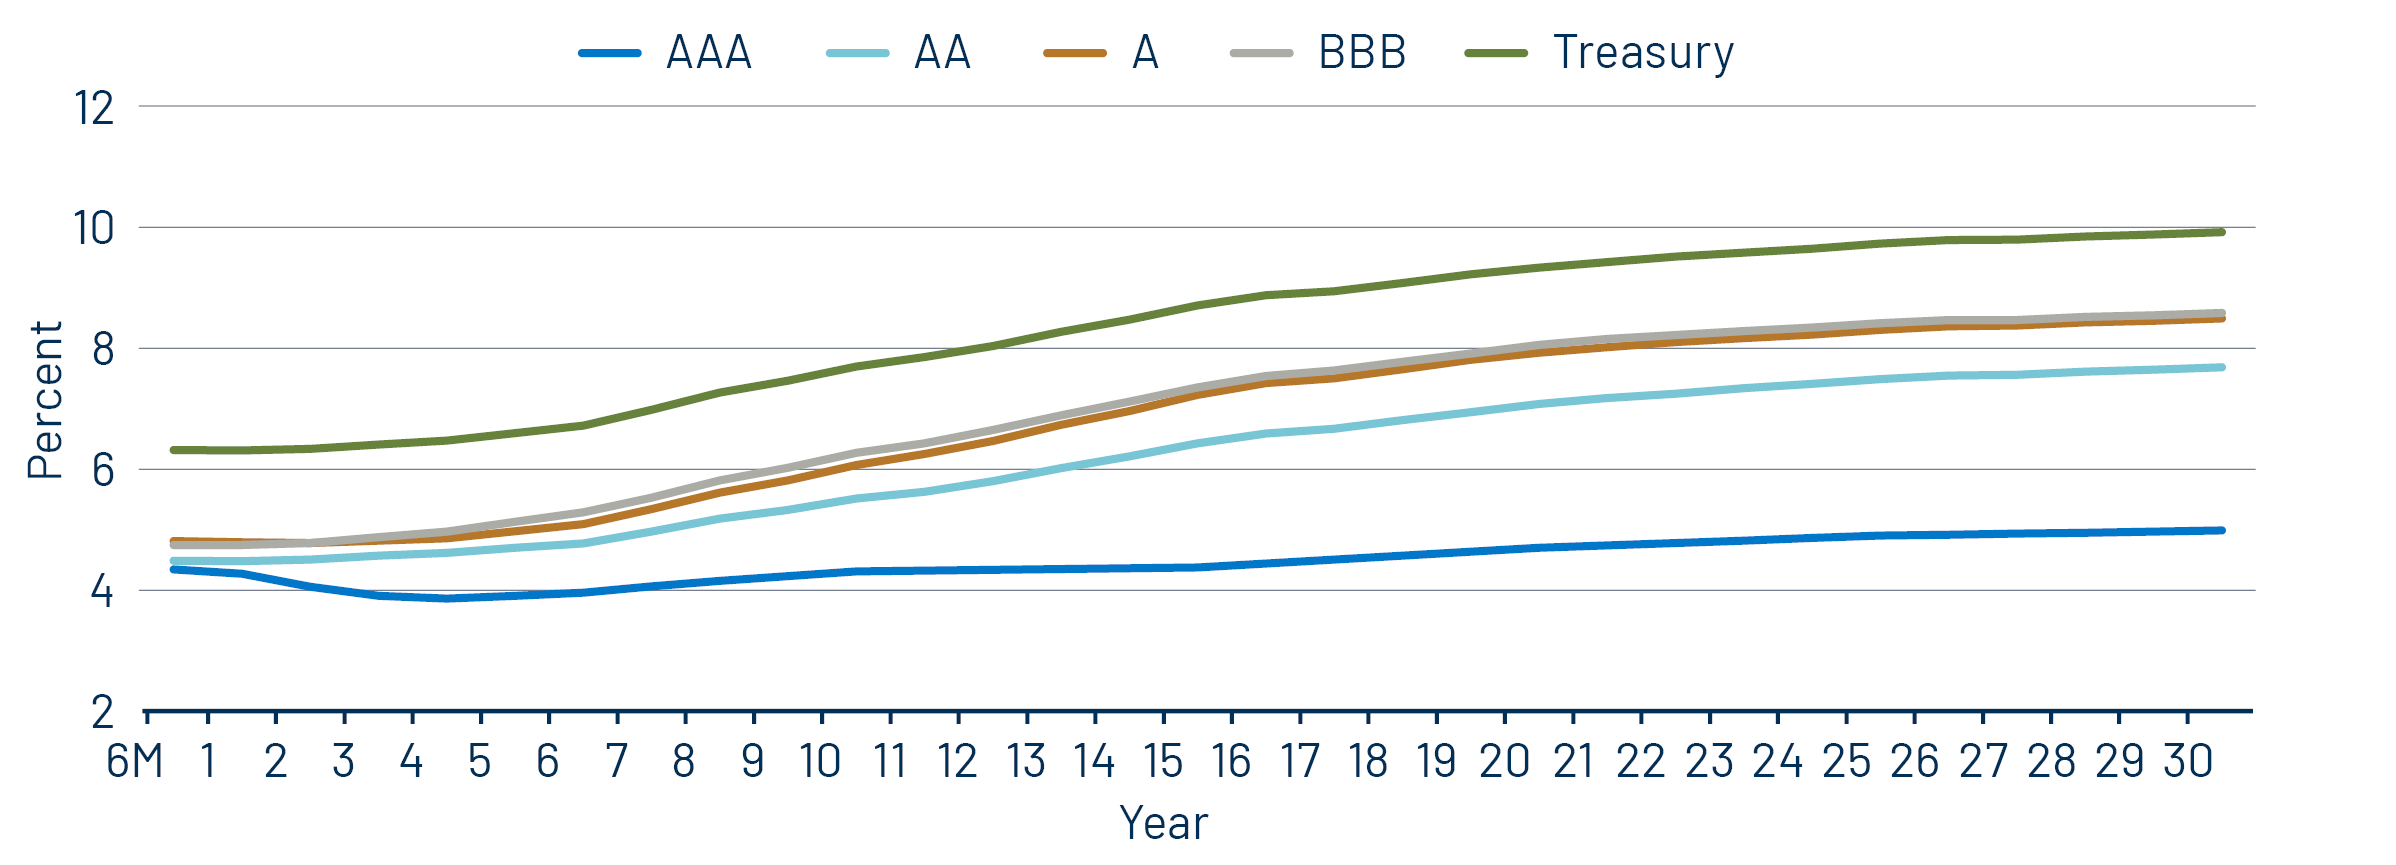
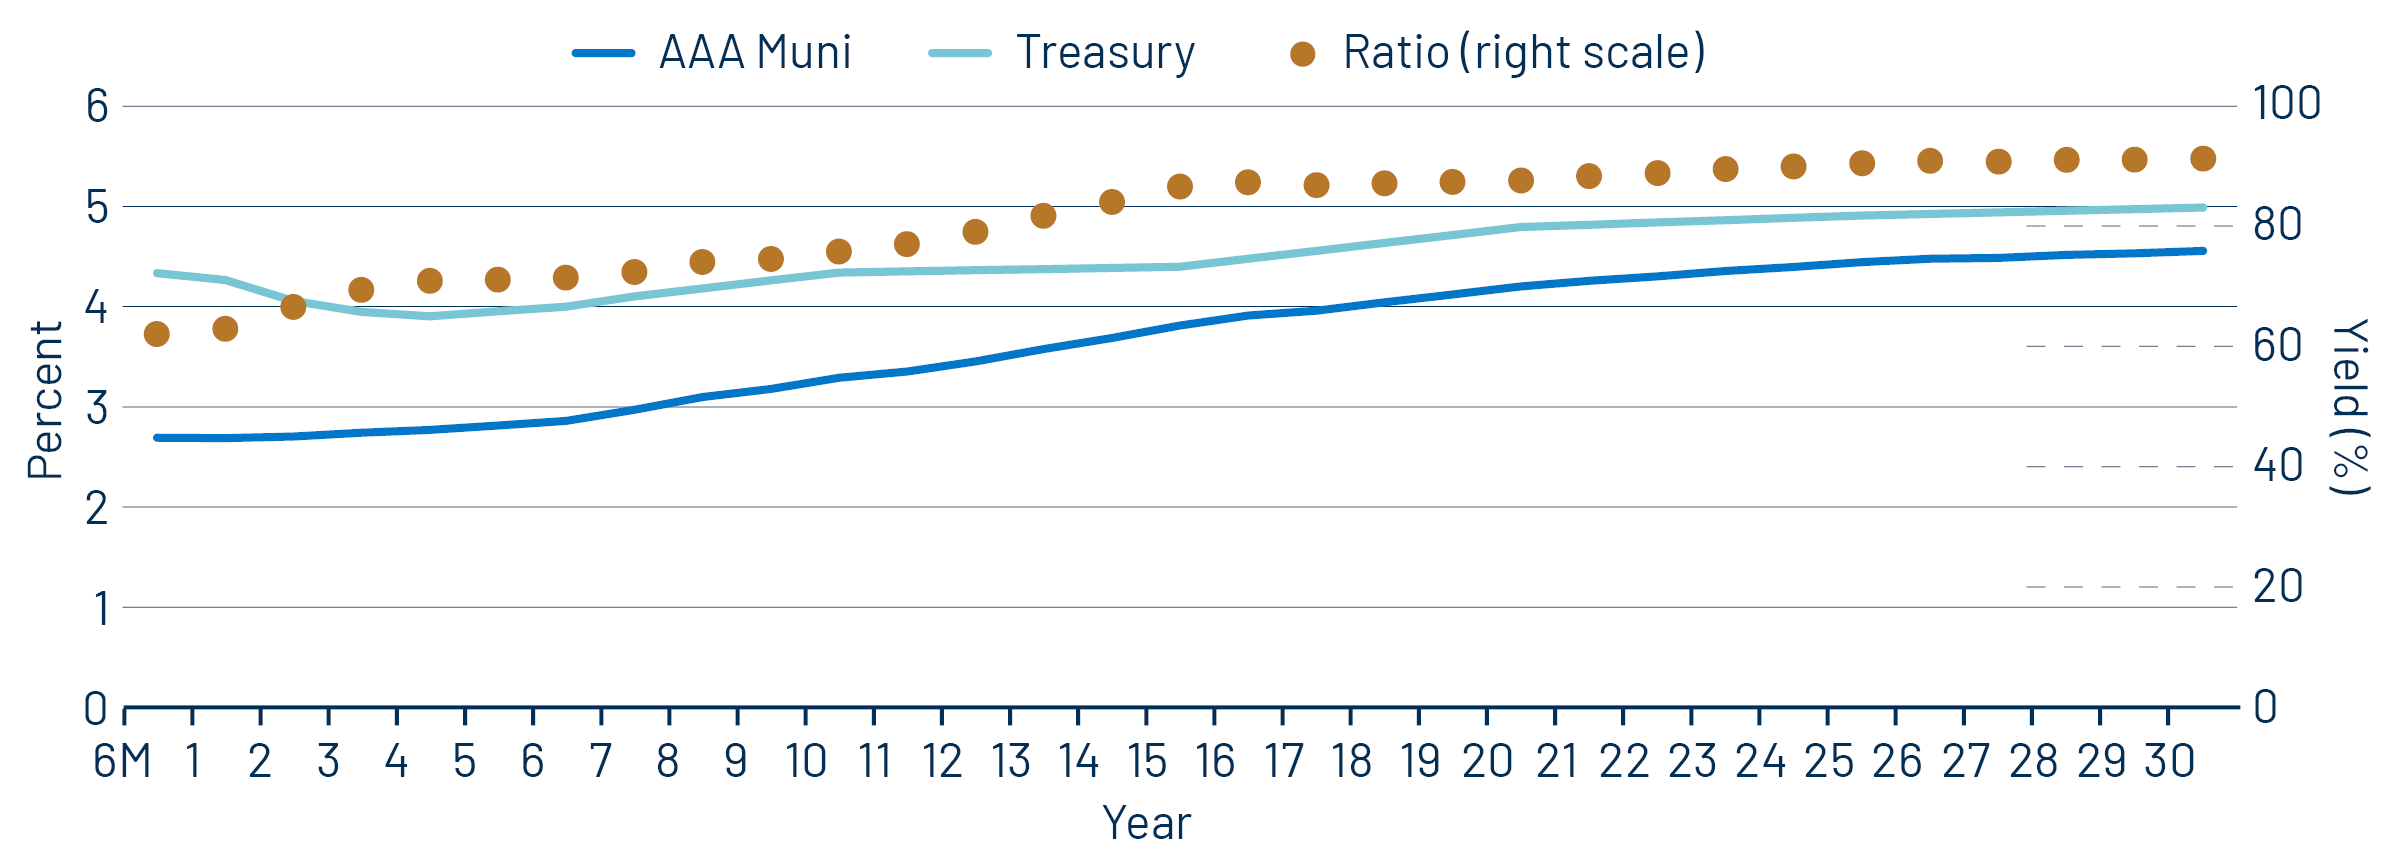
Municipal Credit Curves and Relative Value
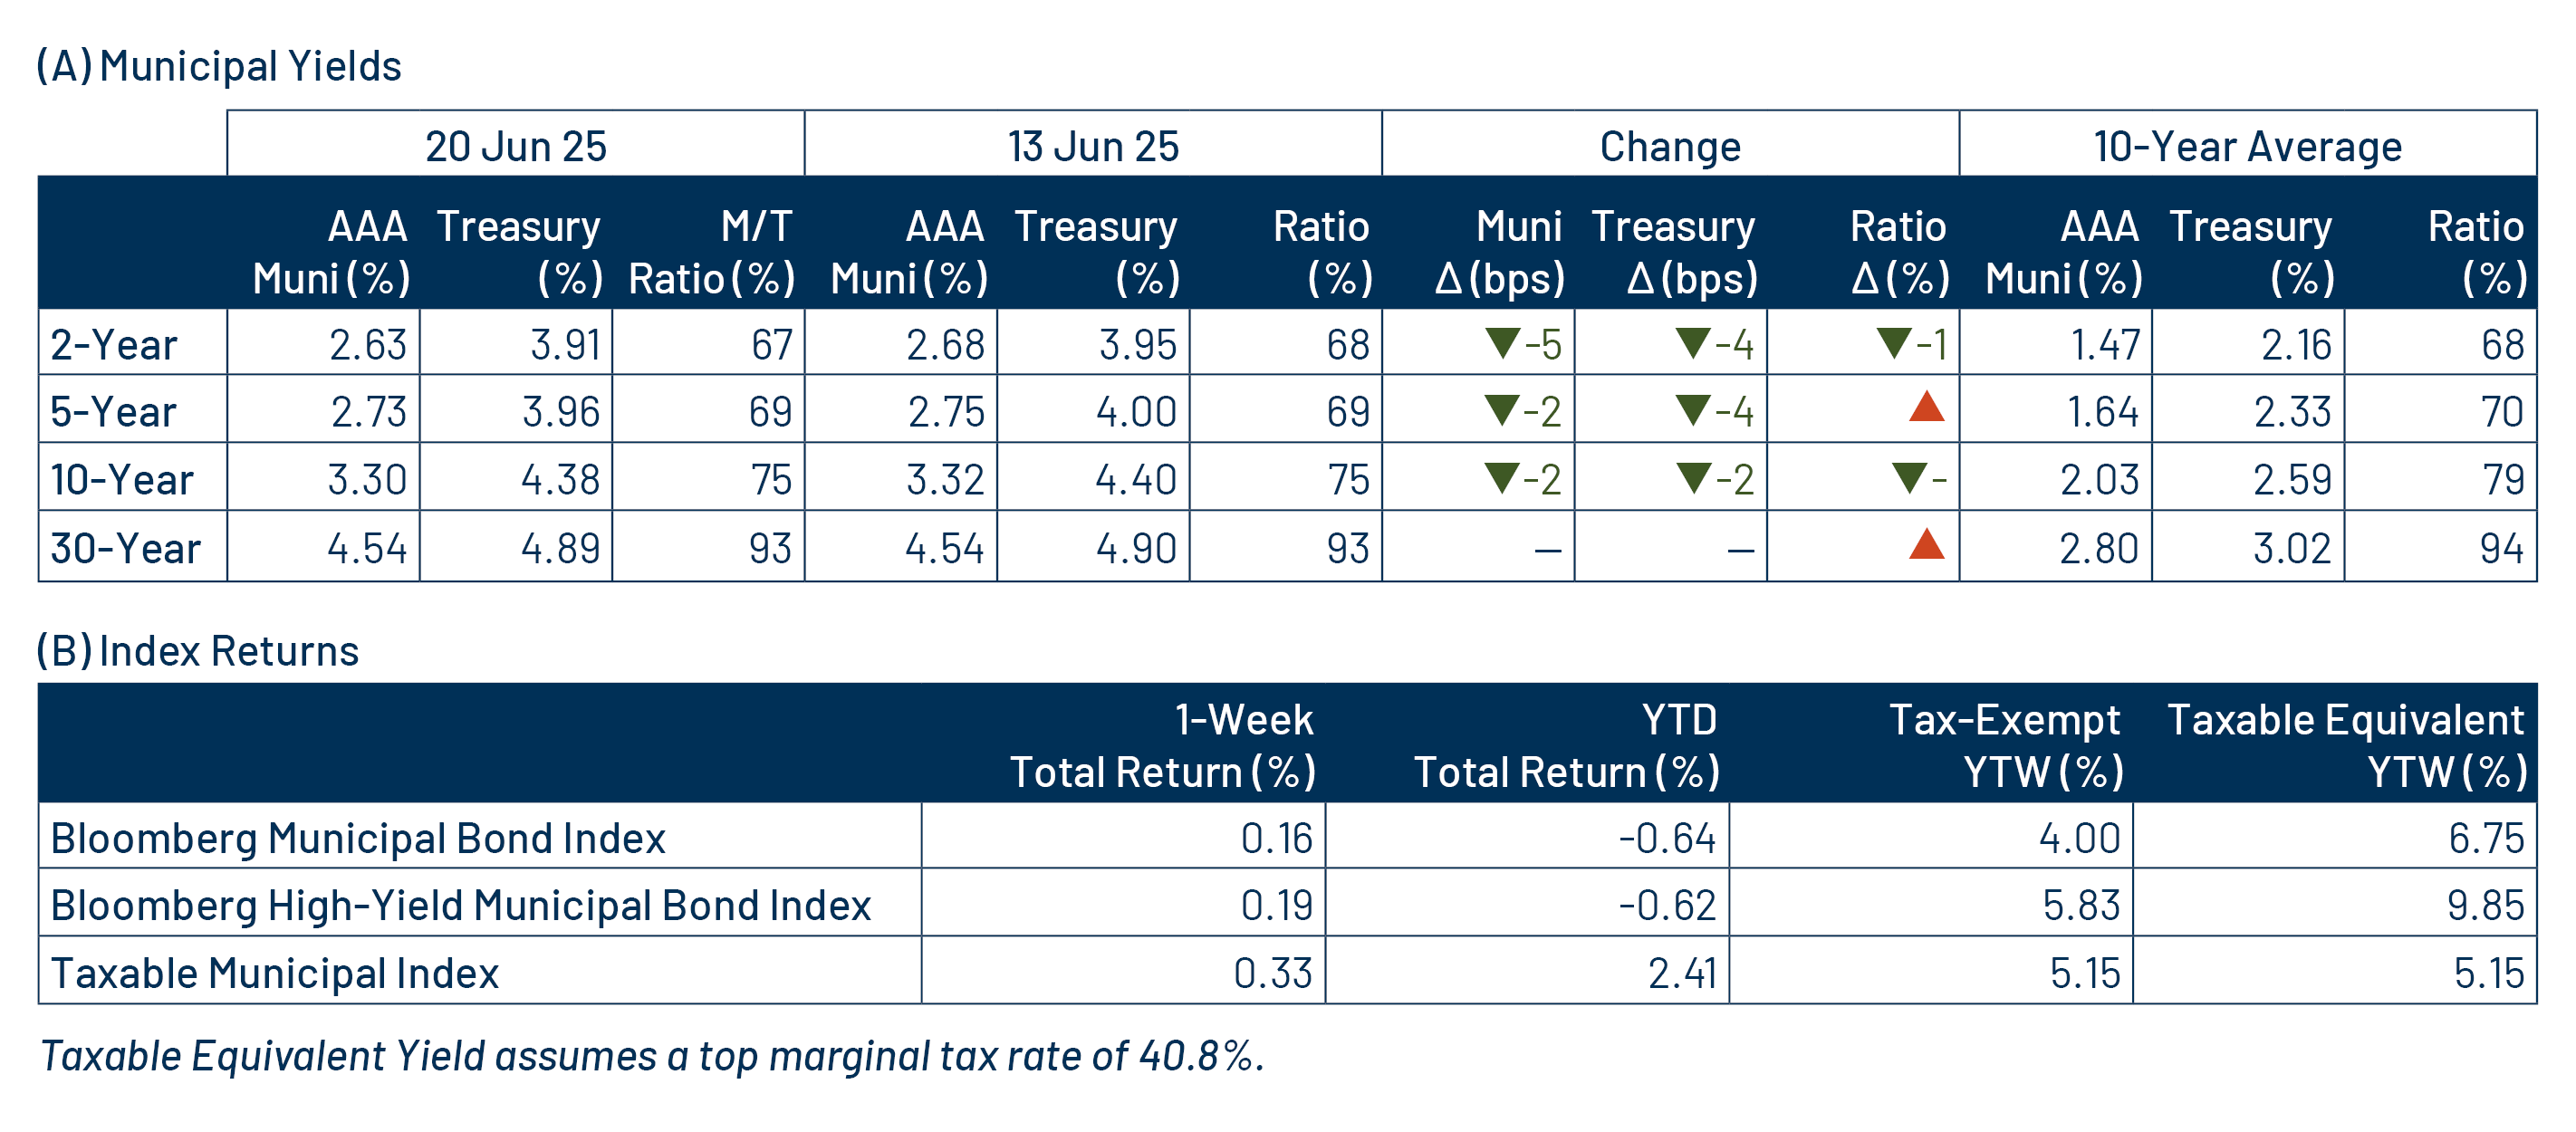
Theme #1: Municipal taxable-equivalent yields and income opportunities remain near decade-high levels.

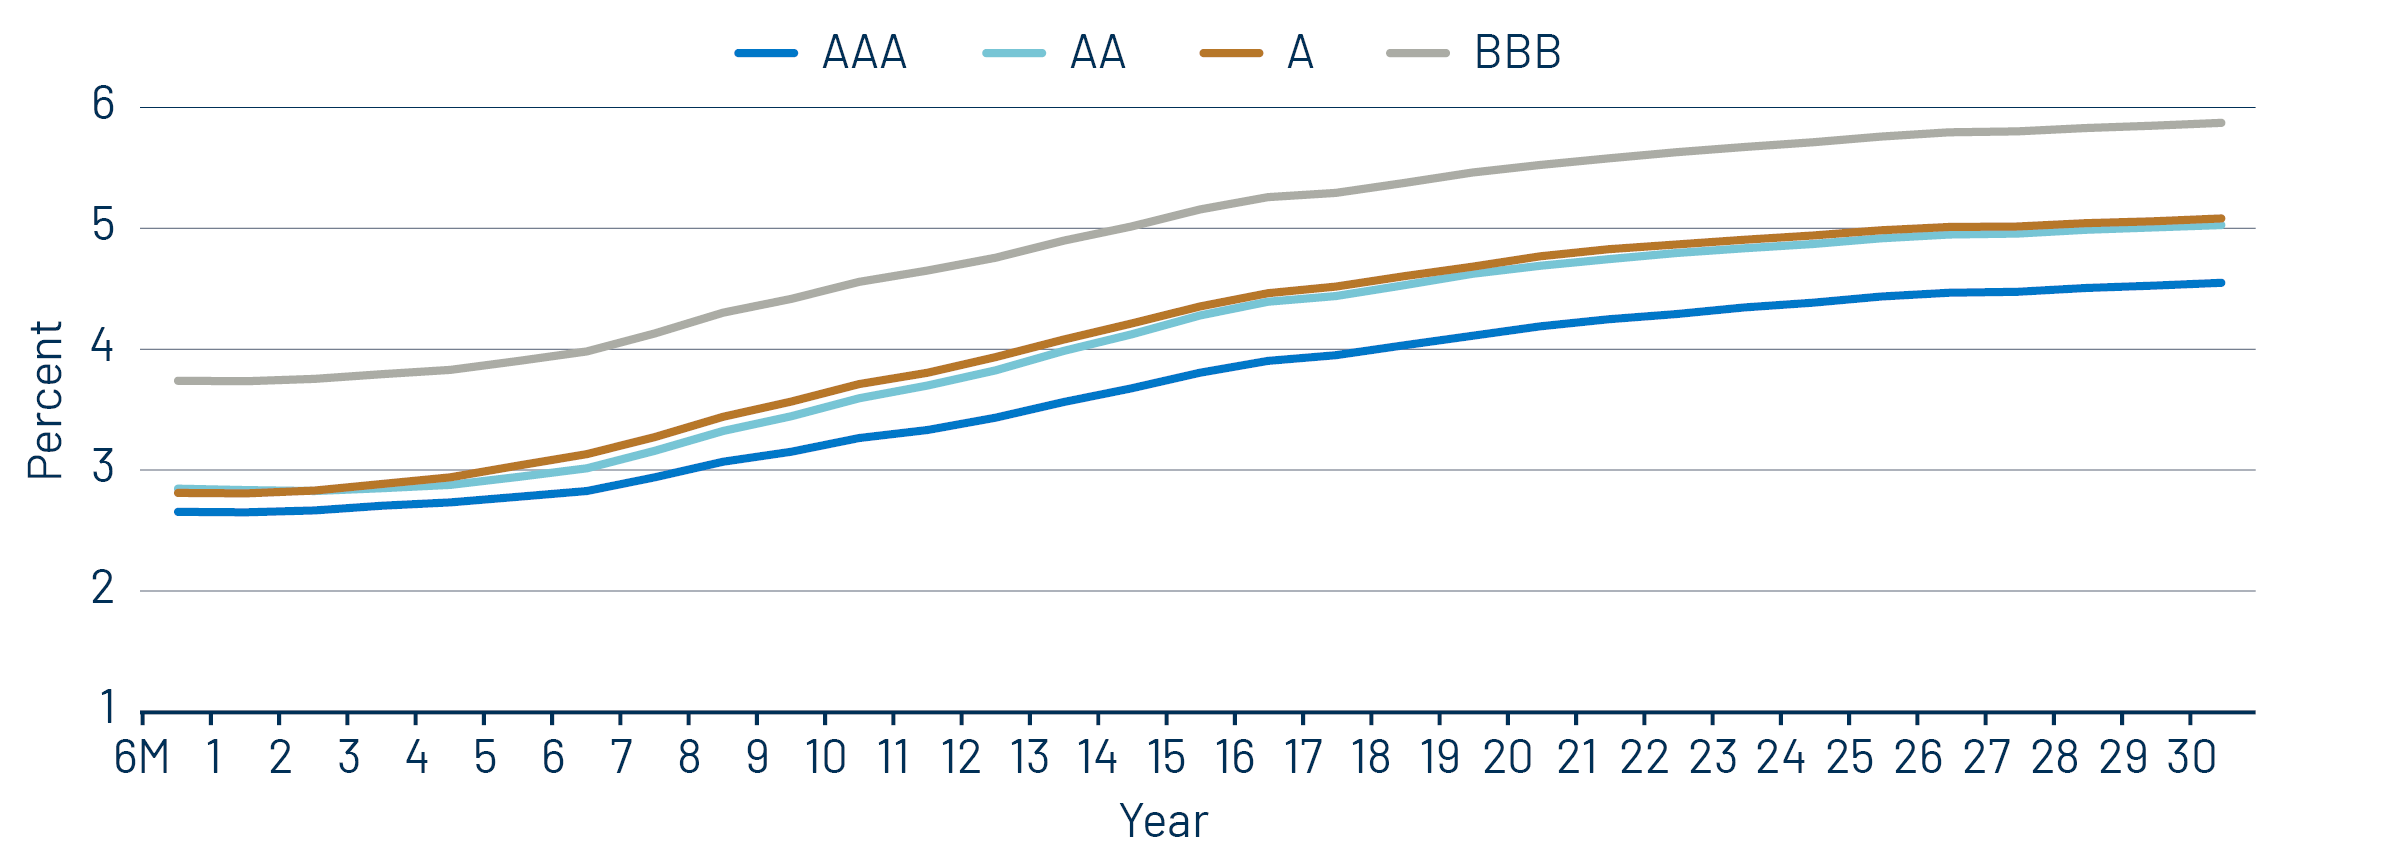
Theme #2: The AAA muni curve has steepened, offering better value in intermediate and longer maturities.
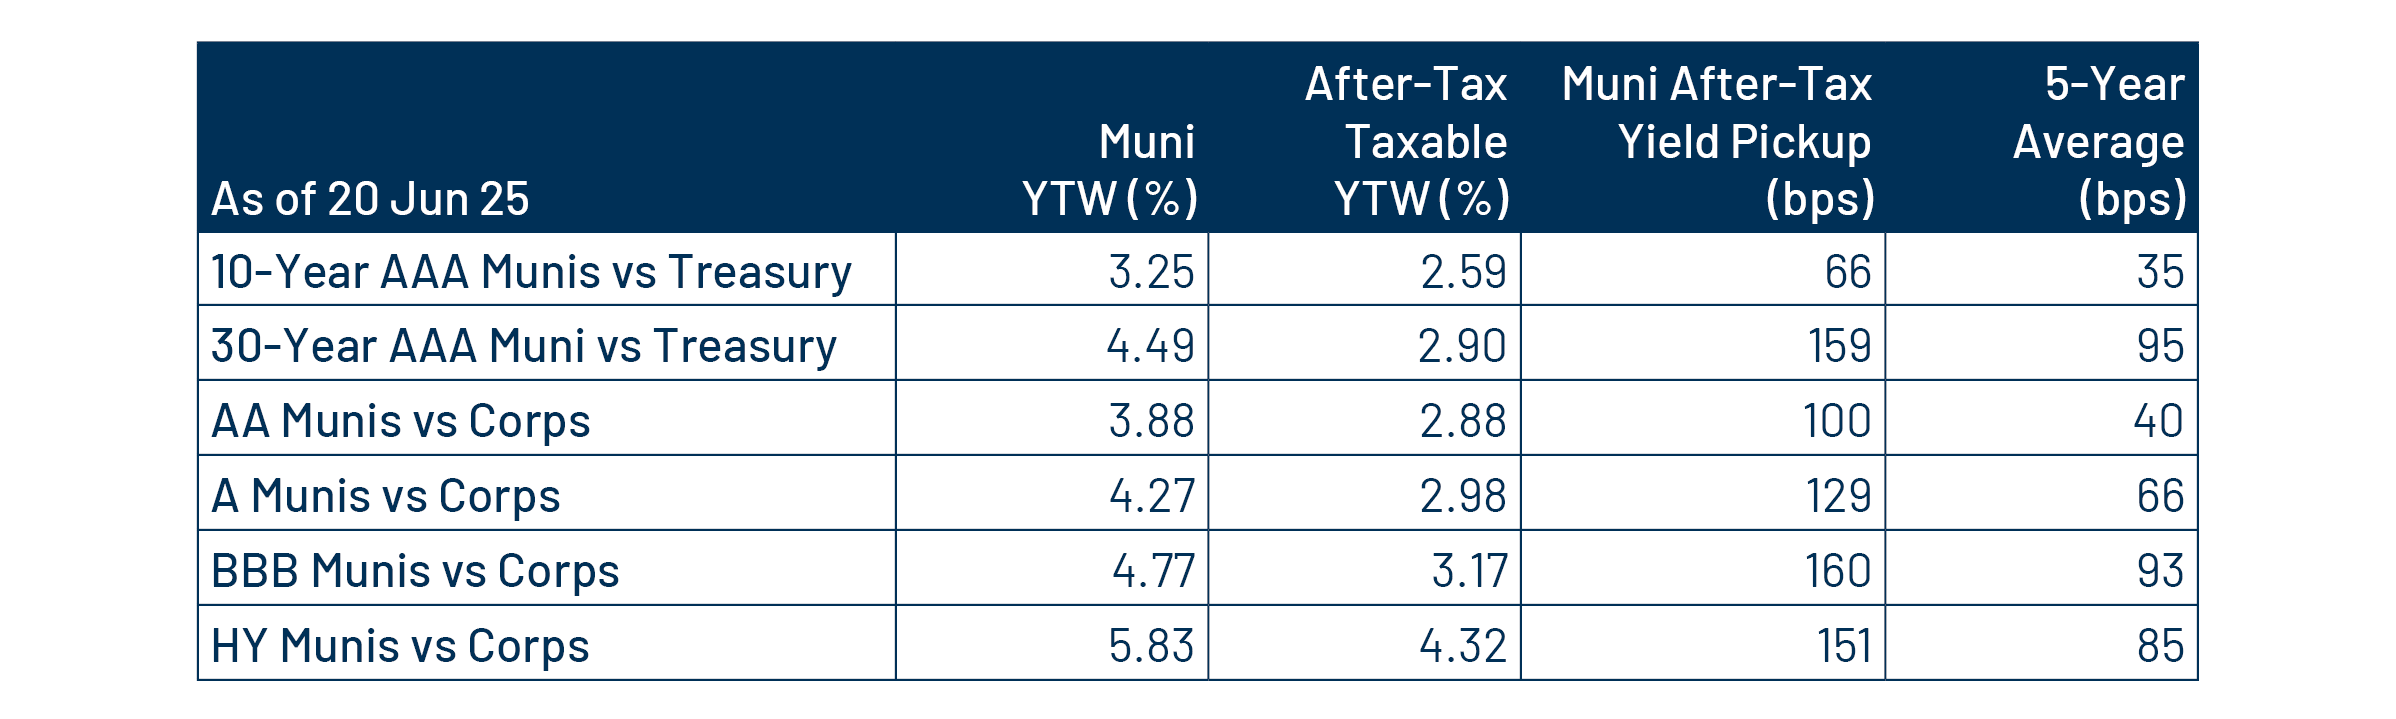
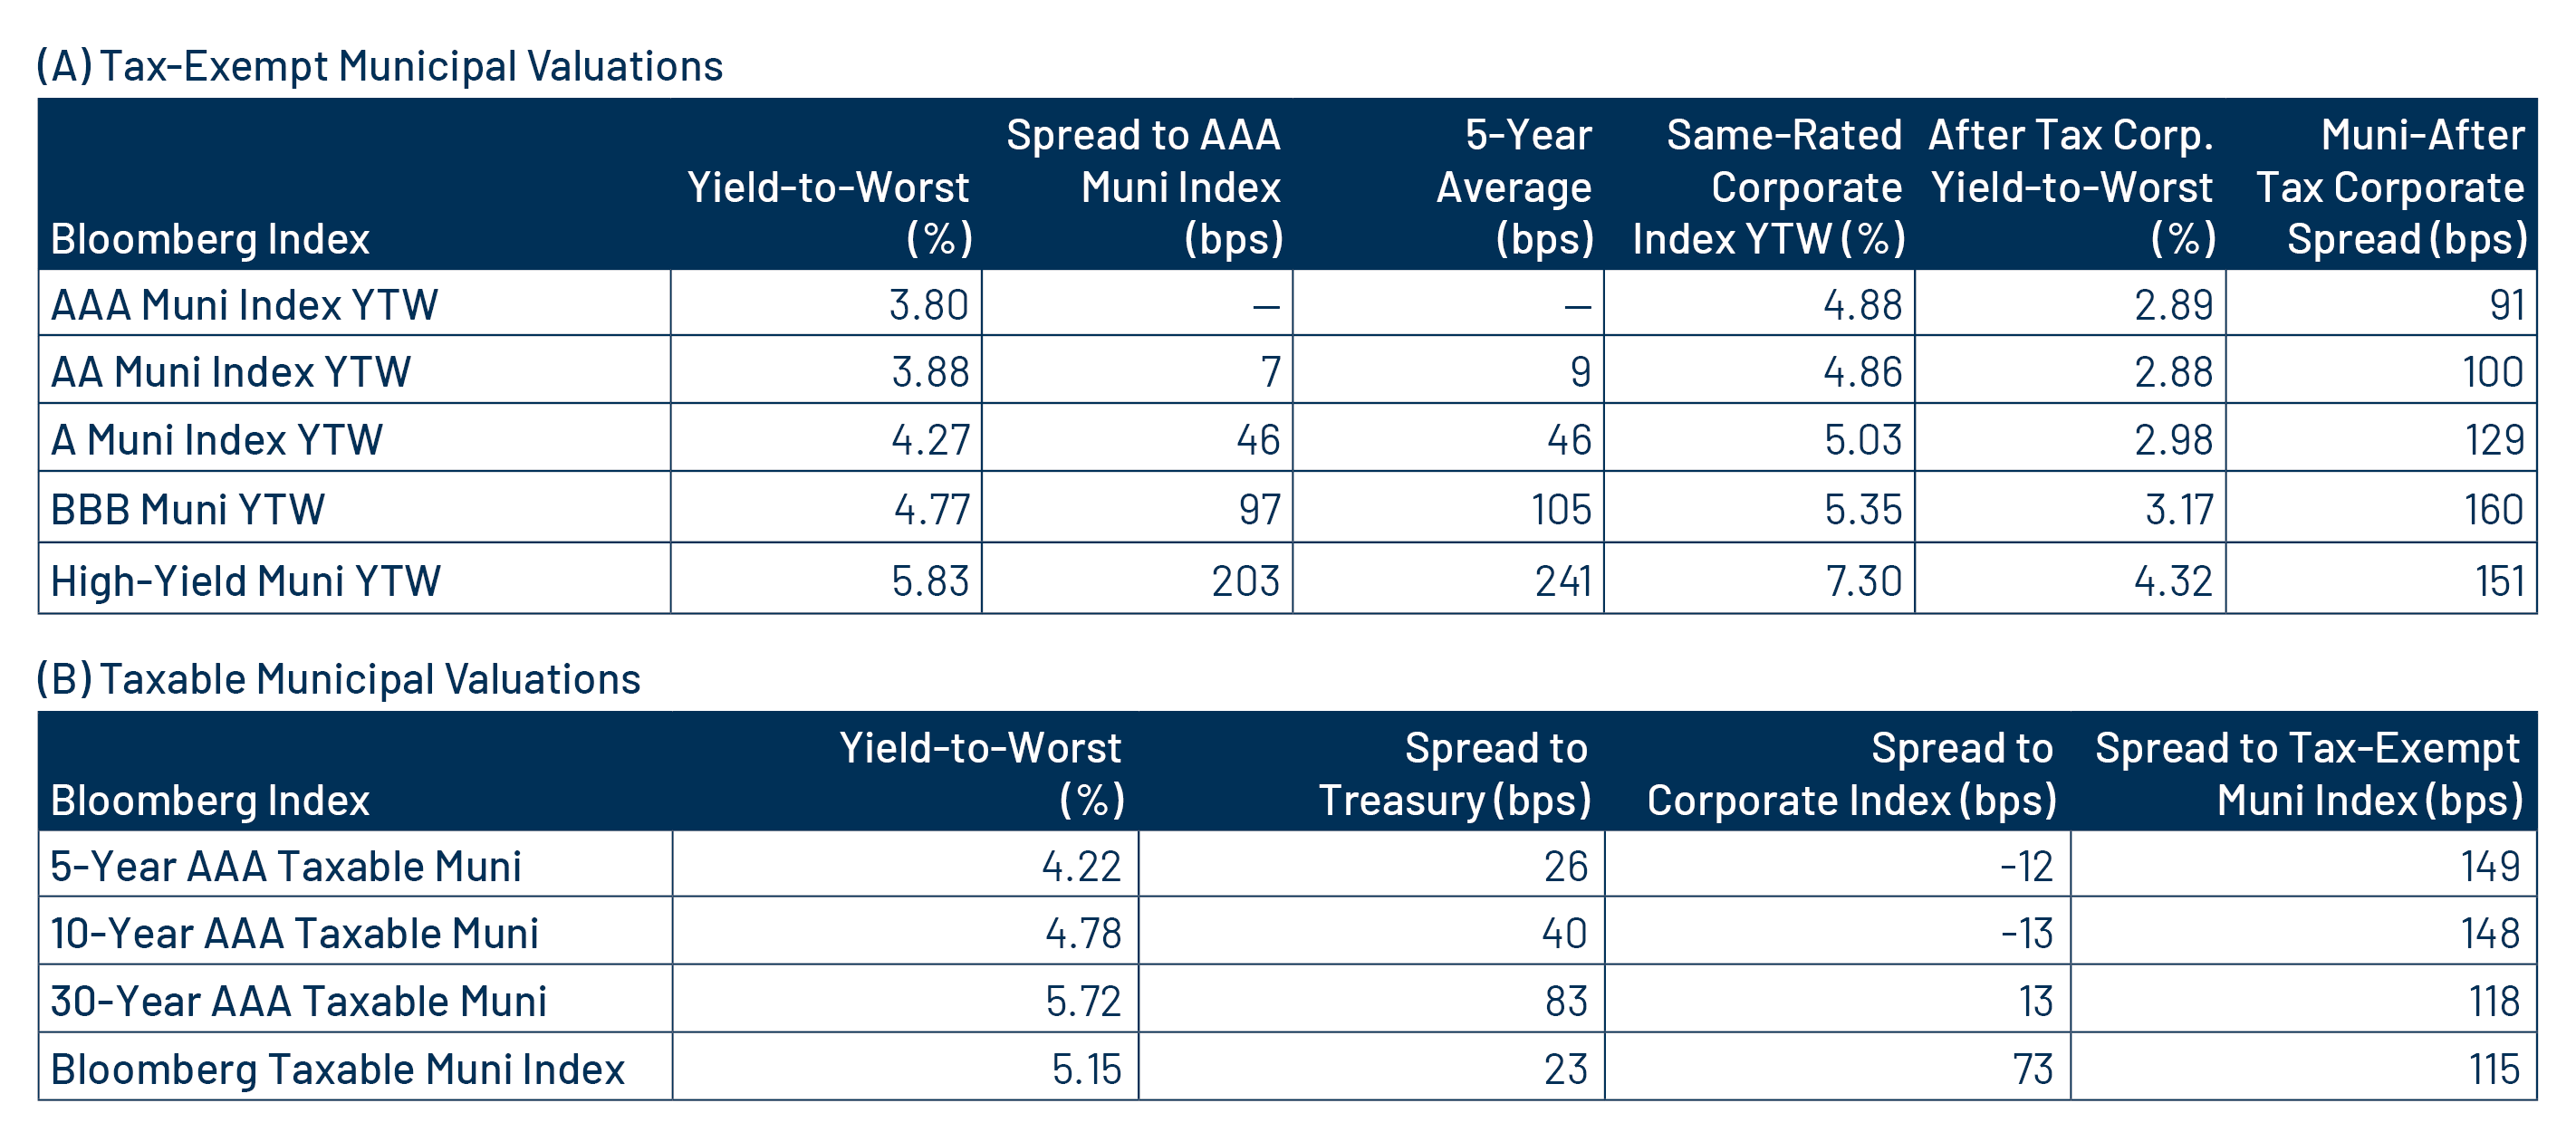
Theme #3: Munis offer attractive after-tax yield compared to taxable alternatives.