skip navigation
Blog

Stay up to date on timely topics and market events. Subscribe to our Blog now.

MARKETS
September 23, 2025

Weekly Municipal Monitor—Federal Reserve Cuts

By Sam Weitzman

Stay up to date on timely topics and market events. Subscribe to our Blog now.

Macros, Markets and Munis

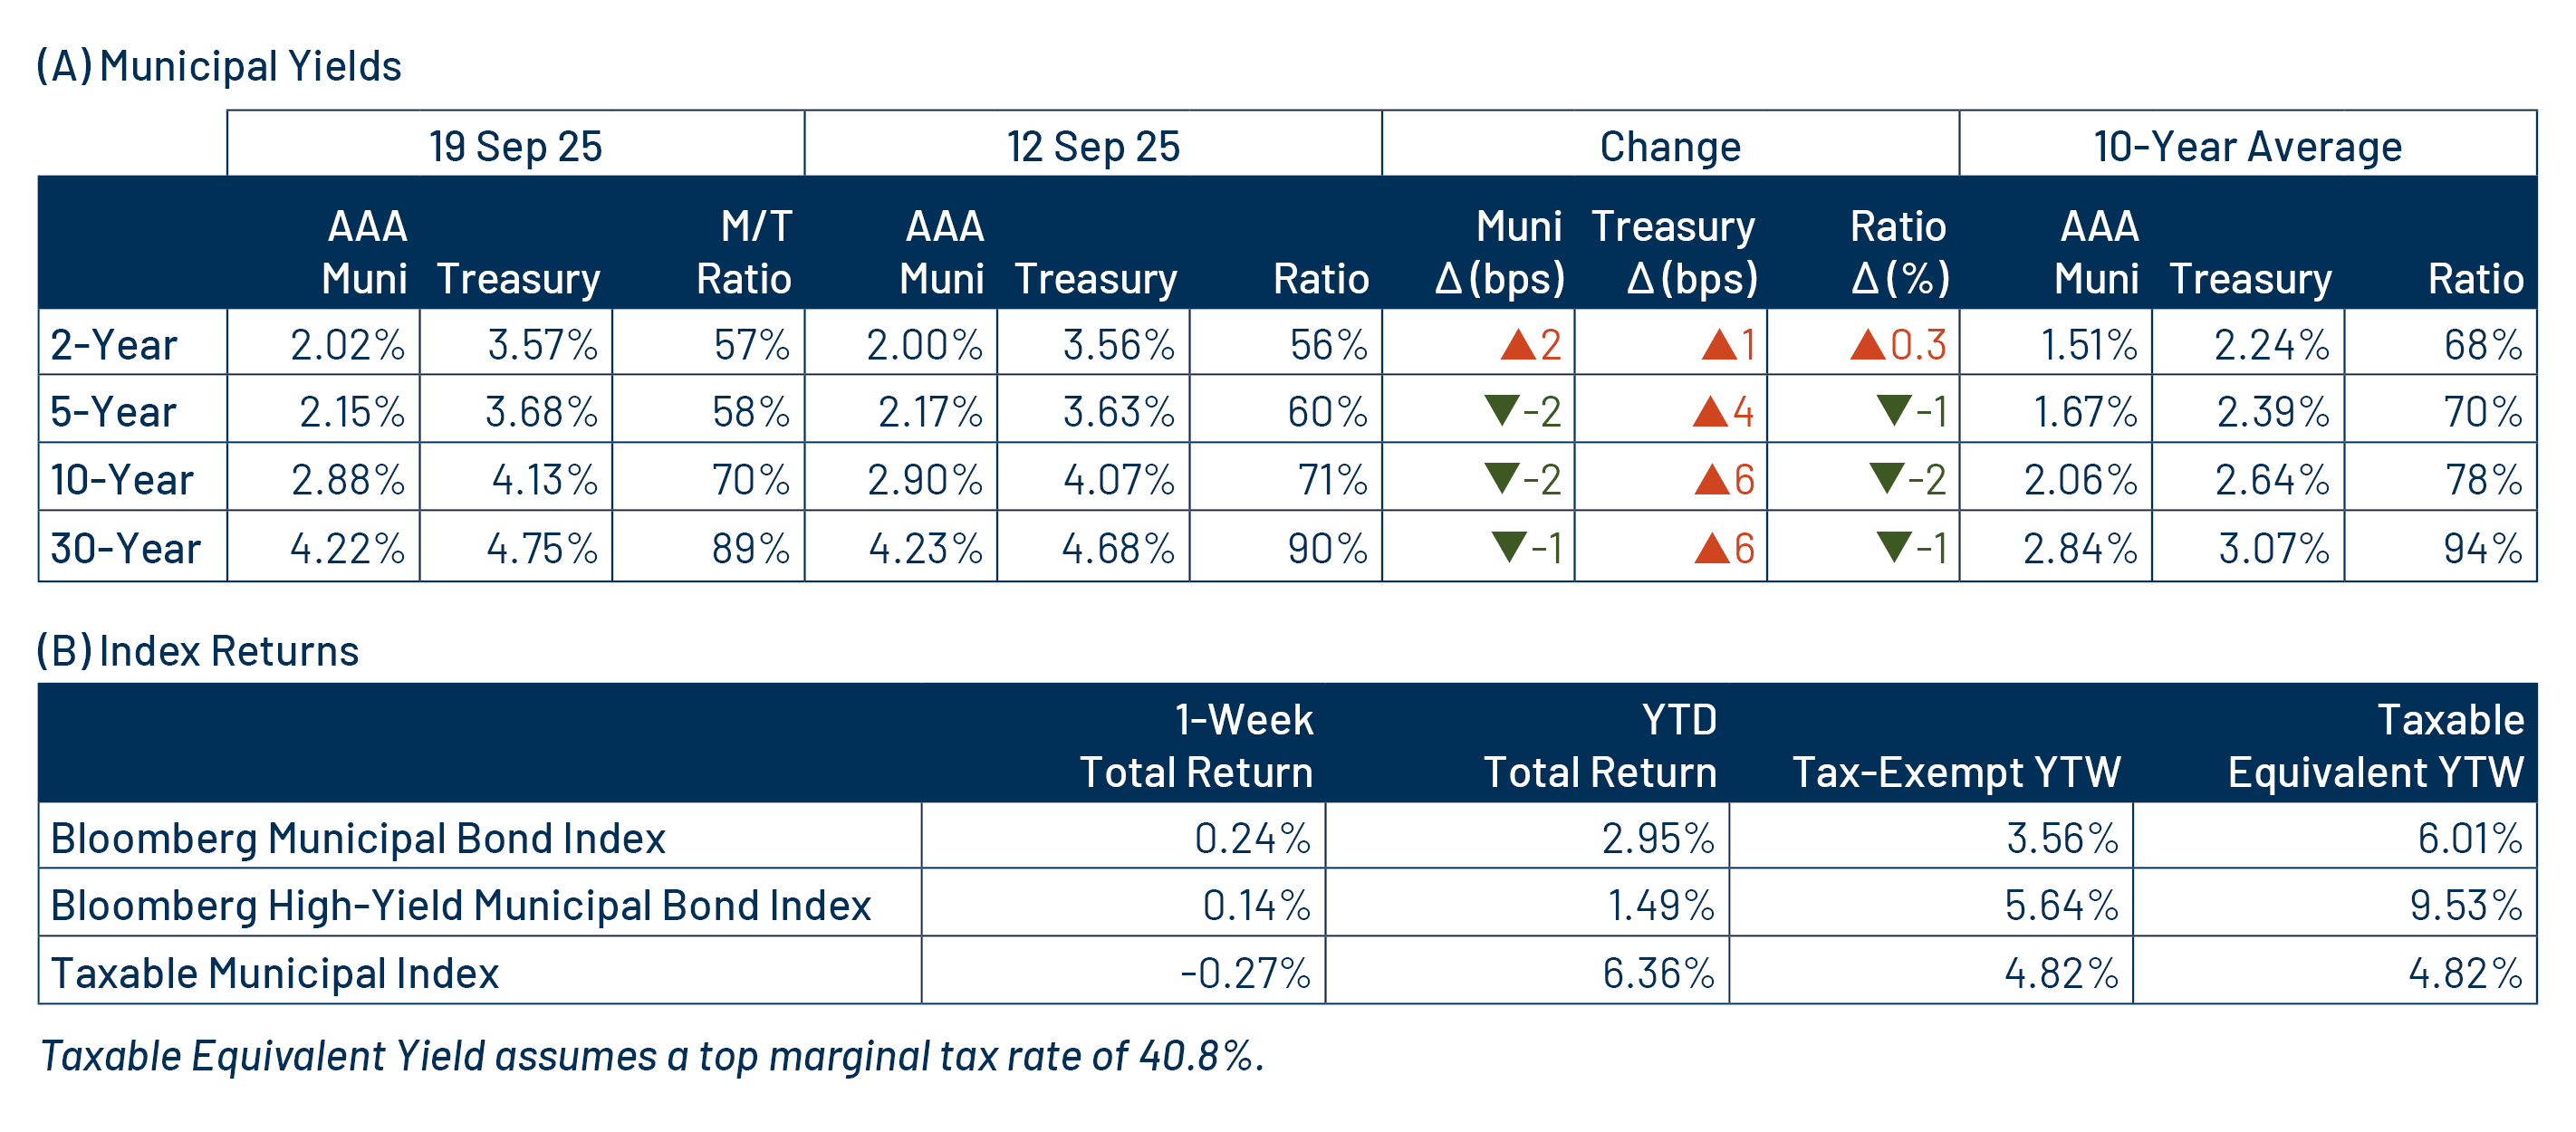
Munis rallied and outperformed taxable fixed-income last week. Technicals improved as supply slowed amid persistent demand. Fixed-income markets focused on the Federal Open Market Committee (FOMC) meeting last week. The Federal Reserve (Fed) reduced the federal funds rate by 25 basis points (bps) to a target of 4.25%, with the Committee citing increasing downside risks to the labor market and telegraphing the potential for two additional cuts by year end. From an economic data perspective, initial jobless claims fell below expectations and retail sales data moved higher from prior-month levels, exceeding expectations. The Treasury curve moved higher across the curve during the week. The high-grade muni curve outperformed and generally moved lower across most maturities as technicals strengthened. Following last week’s Fed cut, this week we touch on municipal performance during rate cut cycles.

Muni Mutual Funds Record Inflows Amid Softer New-Issue Supply

Fund Flows ($1 billion of net inflows): During the week ending September 17, weekly reporting municipal mutual funds recorded $2.2 billion of net inflows, according to Lipper. Long-term, intermediate and short-term categories recorded $875 million, $176 million and $56 million of inflows, respectively. Last week’s inflows led year-to-date (YTD) inflows higher to $29 billion.

Supply (YTD supply of $414 billion; up 18% YoY): The muni market recorded $8 billion of new-issue supply last week, down 34% from the prior week. YTD new-issue supply of $414 billion is 18% higher than the prior year, with tax-exempt issuance up 19% year-over-year (YoY), with taxable issuance unchanged from prior year levels. This week’s calendar picks back up to $16 billion. The largest deals include $1.9 billion Texas Water Development Board and $1.6 billion California State GO transactions.

This Week in Munis: Federal Reserve Cuts

Last week, the Fed reduced the federal funds target by 25 basis points (bps), from 4.50% to 4.25%. This marked the first interest rate cut since December 2024 and continued the current rate-cutting cycle that began in September 2024. The FOMC highlighted softening labor market conditions as the primary rationale for the cut and indicated the potential for additional cuts through the end of 2025.

Rate-cutting cycles have historically contributed to fixed-income and municipal performance, as the impact of lower rates has tended to have a positive impact on duration-bearing fixed-income instruments. During the prior eleven rate cut cycles observed since 1981, the Bloomberg Municipal Bond Index posted total returns of 9.9% between the first and last interest rate cuts, or 11.1% when considering returns on an annualized basis.

Exhibit 1: Municipal Bond Index Performance During Fed Cut Cycles
Municipal Bond Index Performance During Fed Cut Cycles
Source: Bloomberg, Western Asset. As of 20 Sep 25. Cut cycles defined by the first federal funds rate decline after a federal funds rate increase to the last cut before an increase: 1981-1982: 1/16/81-12/15/1982; 1984: 10/1/84-12/24/84; 1985: 3/28/1985-8/21/85; 1985-1986: 12/16/1985-8/19/1986: 1987-88: 10/18/1987-2/10/1988; 1989-1992: 6/5/1989-9/4/1992; 1995-1996: 7/6/1995-1/31/1996; 1998: 9/29/1998-11/17/1998; 2001-2003: 1/3/2001-6/5/2003; 2007-2008: 9/18/2007-12/16/2008, 2019-2020: 7/31/2019-3/16/2020; 2024-2025: 9/18/2024-9/17/2025.

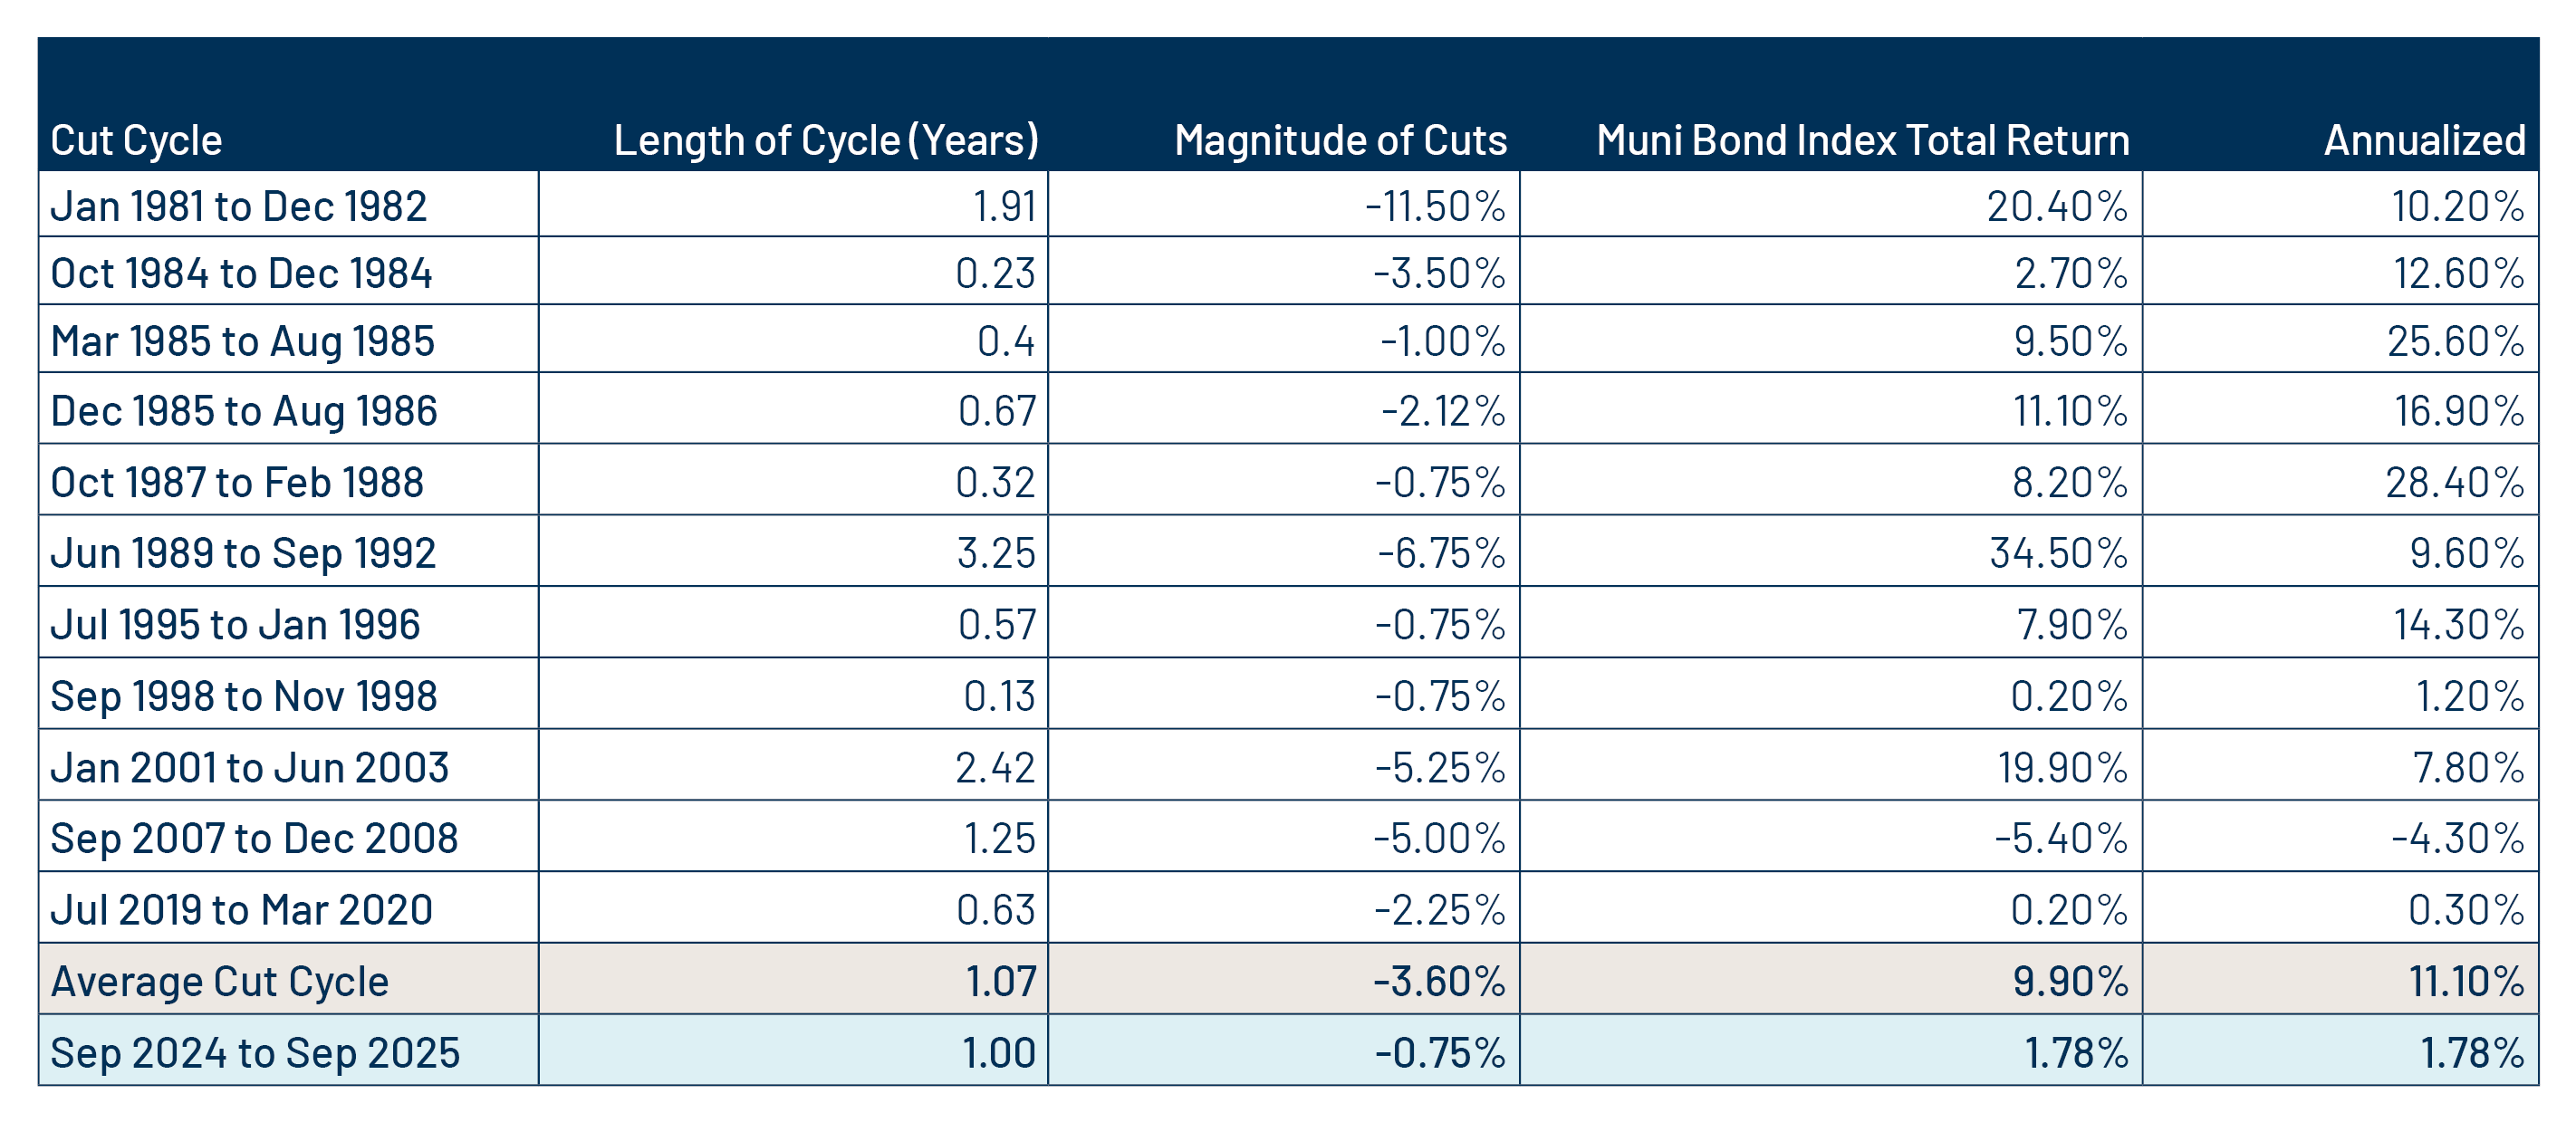
While this cut cycle has reached the average tenor of the prior eleven rate cut cycles, returns have not yet reflected the average magnitude of positive outcomes traditionally seen when the Fed cuts rates. Since the Fed began reducing rates in 2024, the Bloomberg Municipal Bond Index has returned 1.78% through September 19, significantly below the 11.1% average annualized return of the prior eleven rate cut cycles. Western Asset attributes the relative underperformance to the elevated supply and curve steepening observed in the municipal market over the past year. However, with additional rate cuts anticipated through the end of 2025 and into 2026, the current cycle’s performance continues to evolve. If historical patterns hold, Western Asset believes that the potential for further rate reductions, combined with attractive income opportunities available today, could drive favorable total returns to be more consistent with prior rate cut cycles.

Municipal Credit Curves and Relative Value

Exhibit 2: Muni Credit Curves
Muni Credit Curves
Source: Bloomberg, Western Asset. As of 19 Sep 25. Bloomberg Valuation Service (BVAL) Municipal Credit Indices (AAA, AA, A, BBB, respectively) and US Sovereign Curves. Taxable-Equivalent Muni Credit Curves consider the top marginal effective tax rate of 40.8%. AA Muni is represented by the US General Obligation AA Muni BVAL Yield Curve. The BVAL curve is populated with pricing from uninsured AA General Obligation bonds. A Muni is represented by the US General Obligation A Muni BVAL Yield Curve. The BVAL curve is populated with pricing from uninsured A General Obligation bonds. BBB Muni is represented by the US General Obligation BBB Muni BVAL Yield Curve. The BVAL curve is populated with pricing from uninsured BBB General Obligation bonds. Indices are unmanaged and one cannot directly invest in them. They do not include fees, expenses or sales charges. Past performance is not an indicator or a guarantee of future results. Select the image to expand the view.
Exhibit 3: Taxable-Equivalent Muni Credit Curves
Taxable-Equivalent Muni Credit Curves
Source: Bloomberg, Western Asset. As of 19 Sep 25. Bloomberg Valuation Service (BVAL) Municipal Credit Indices (AAA, AA, A, BBB, respectively) and US Sovereign Curves. Taxable-Equivalent Muni Credit Curves consider the top marginal effective tax rate of 40.8%. AA Muni is represented by the US General Obligation AA Muni BVAL Yield Curve. The BVAL curve is populated with pricing from uninsured AA General Obligation bonds. A Muni is represented by the US General Obligation A Muni BVAL Yield Curve. The BVAL curve is populated with pricing from uninsured A General Obligation bonds. BBB Muni is represented by the US General Obligation BBB Muni BVAL Yield Curve. The BVAL curve is populated with pricing from uninsured BBB General Obligation bonds. Indices are unmanaged and one cannot directly invest in them. They do not include fees, expenses or sales charges. Past performance is not an indicator or a guarantee of future results. Select the image to expand the view.
Exhibit 4: AAA Munis vs. Treasuries
AAA Munis vs. Treasuries
Source: Muni Yields: Thomson Reuters MMD, Treasury Yields: Bloomberg. As of 19 Sep 25. Past performance is not a guarantee of future results. It is not possible to invest directly in an index. Select the image to expand the view.
Exhibit 5: Tax-Exempt and Taxable Muni Valuations
Tax-Exempt and Taxable Muni Valuations
Source: Bloomberg, Western Asset. As of 19 Sep 25. Yield-to-worst (YTW) is the lowest potential yield that can be received on a bond without the issuer actually defaulting. AAA, AA, A, BBB Corporate Indices; After-Tax Yield assumes a top effective tax rate of 40.8%. Taxable Muni Index Corporate comparable used is the Global Corporate Aggregate (ex. BBB) to better align credit quality and duration. Select the image to expand the view.

Western Asset Key Themes for Muni Investors

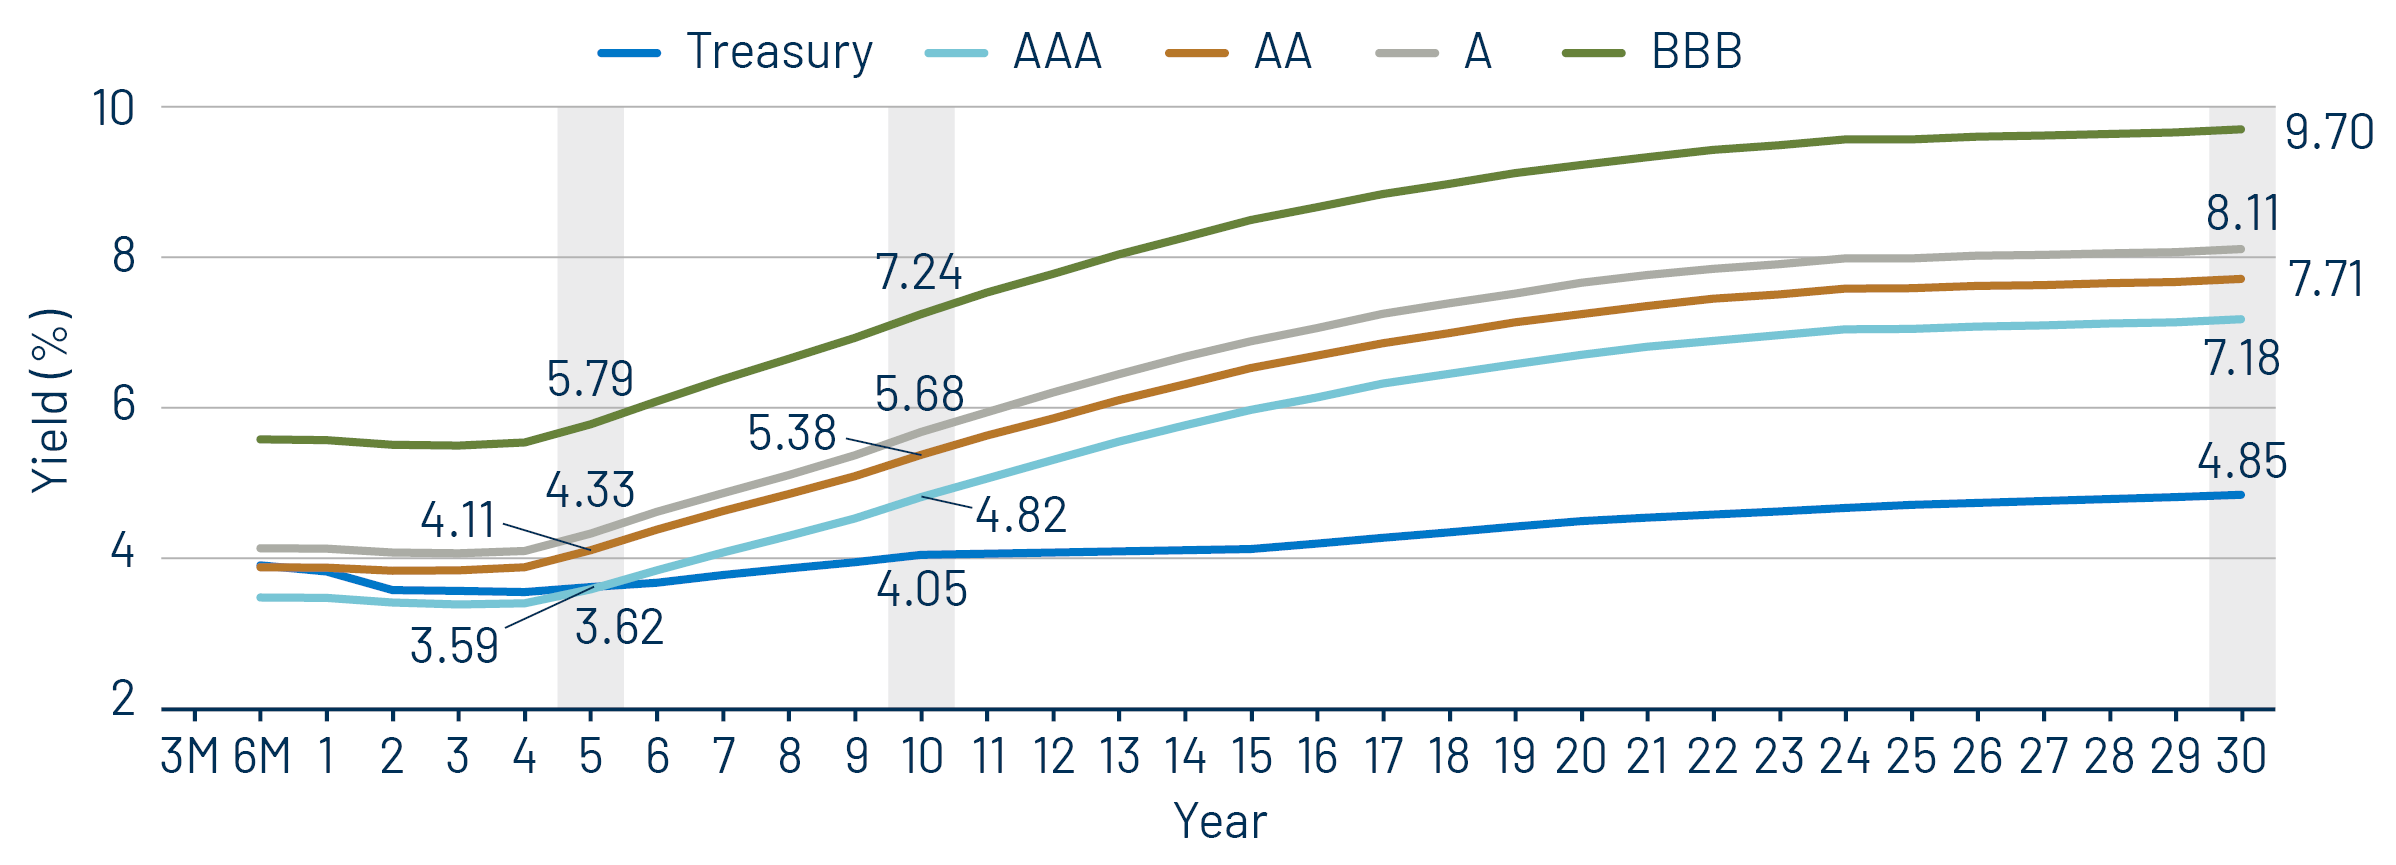
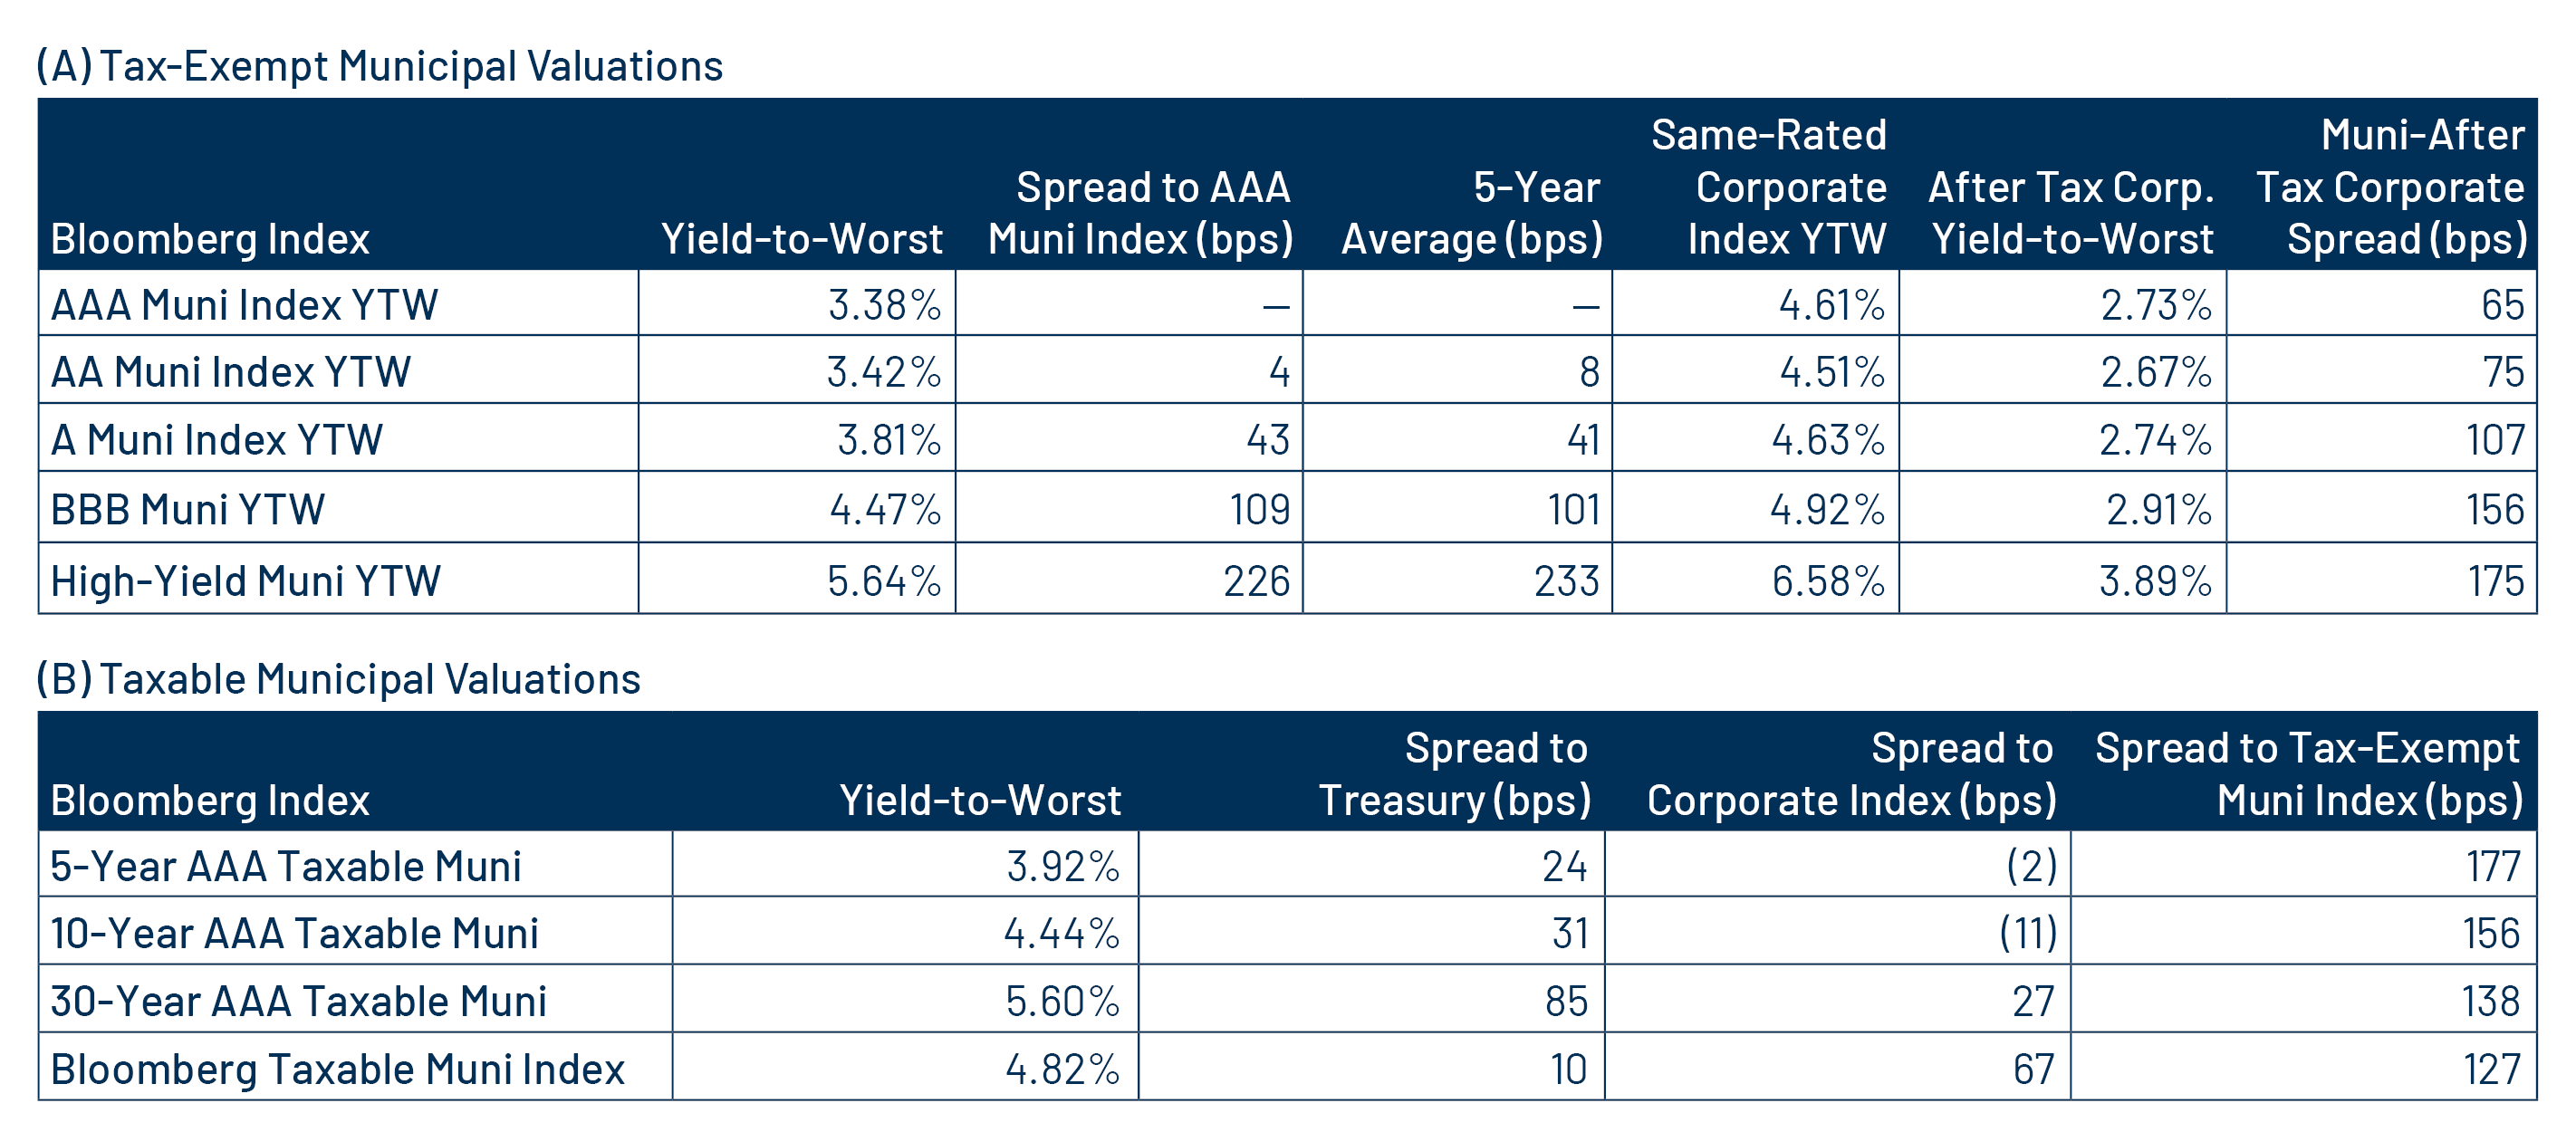
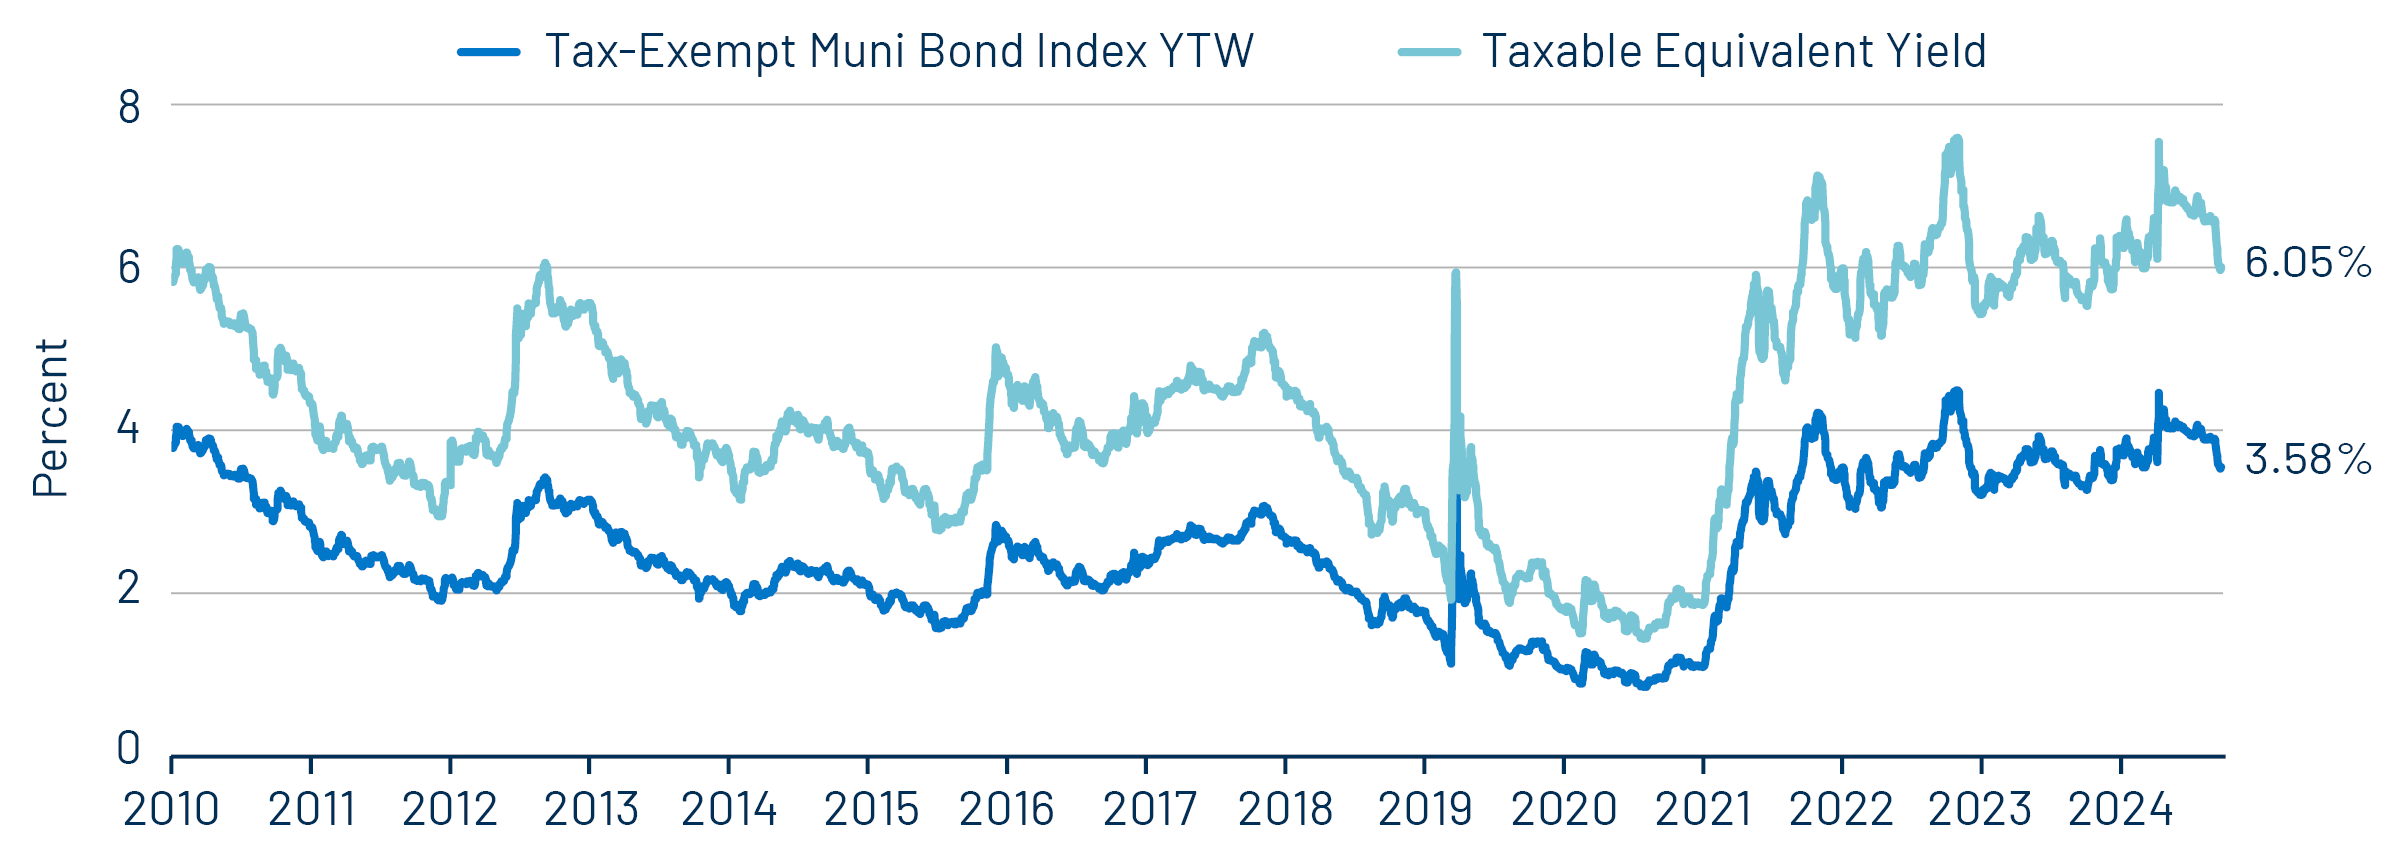
Theme #1: Municipal taxable-equivalent yields and income opportunities remain near decade-high levels.

Exhibit 6: Muni and Taxable-Equivalent Muni Yield-to-Worst
Muni and Taxable-Equivalent Muni Yield-to-Worst
Source: Bloomberg, Western Asset. As of 19 Sep 25. Bloomberg Municipal Bond Index yield considering highest marginal tax rate of 40.8%. Indexes are unmanaged and one cannot directly invest in them. They do not include fees, expenses or sales charges. Past performance is not an indicator or a guarantee of future results. Select the image to expand the view.

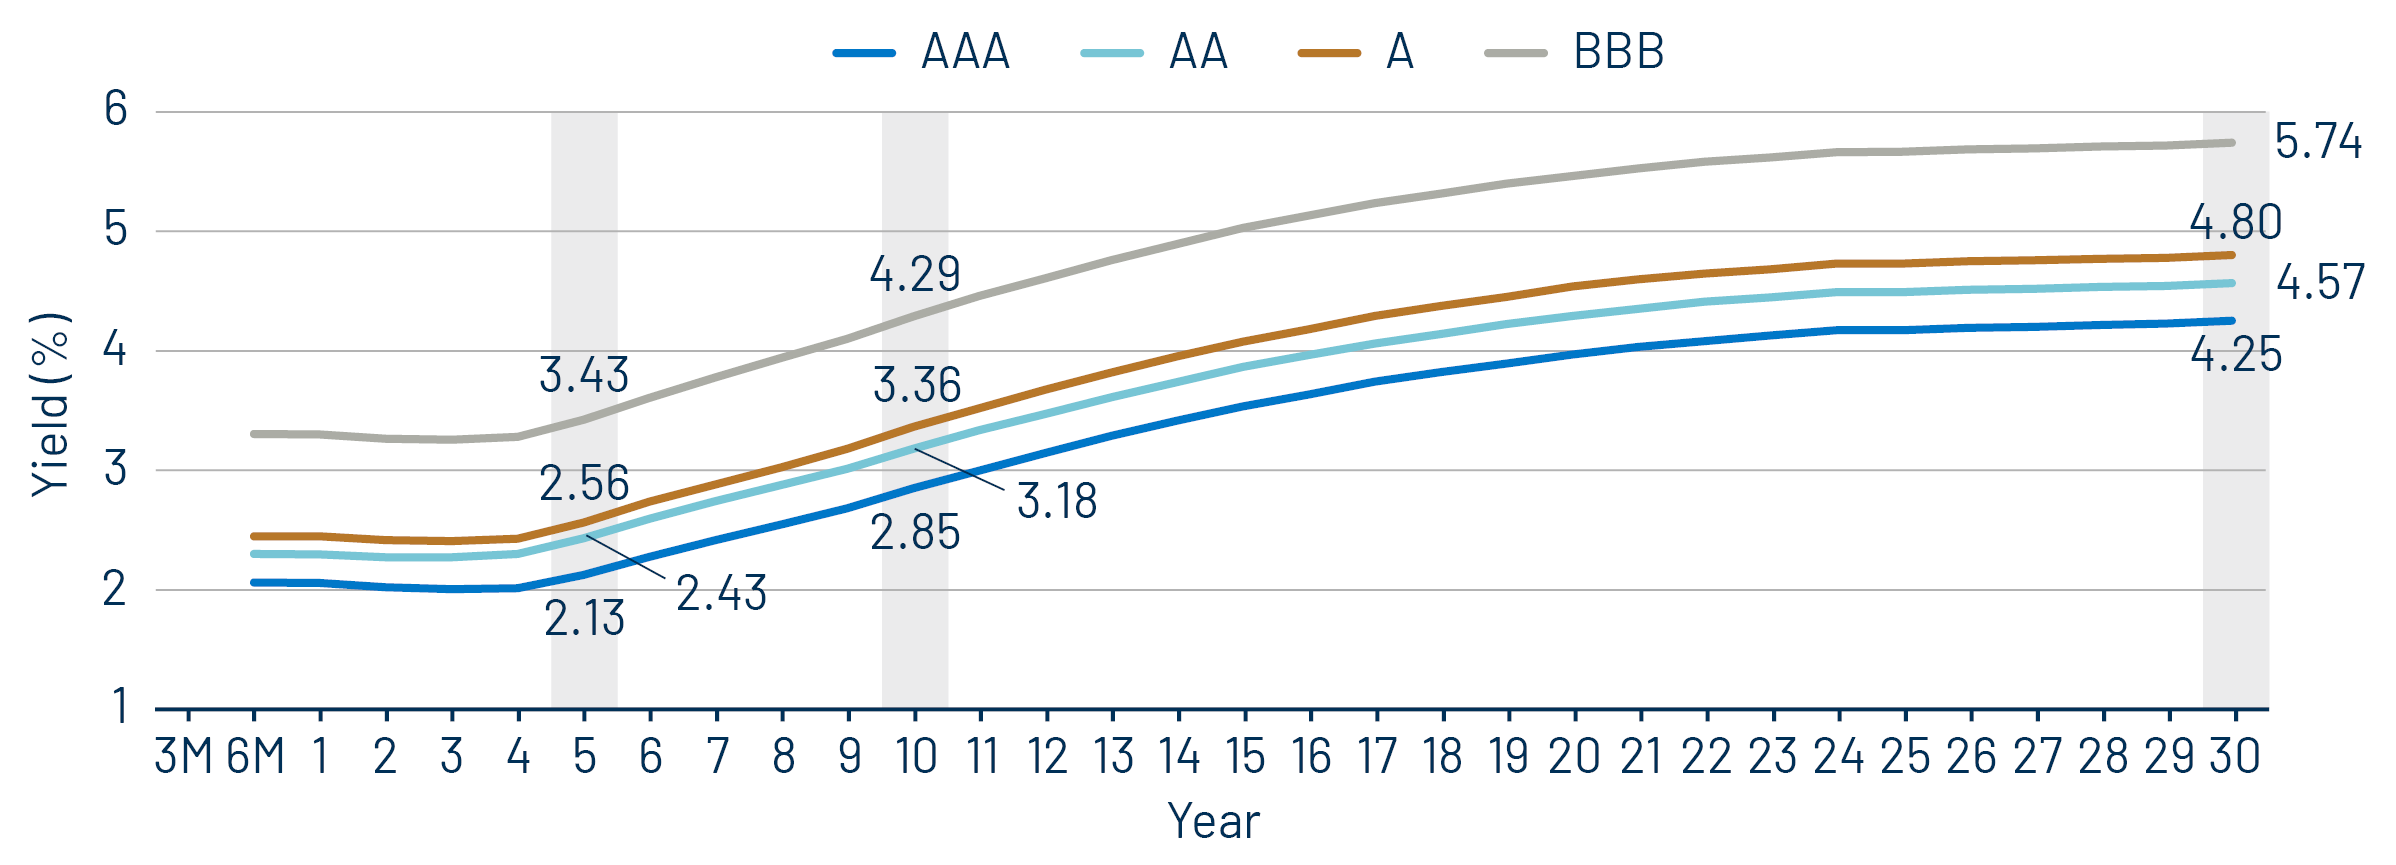
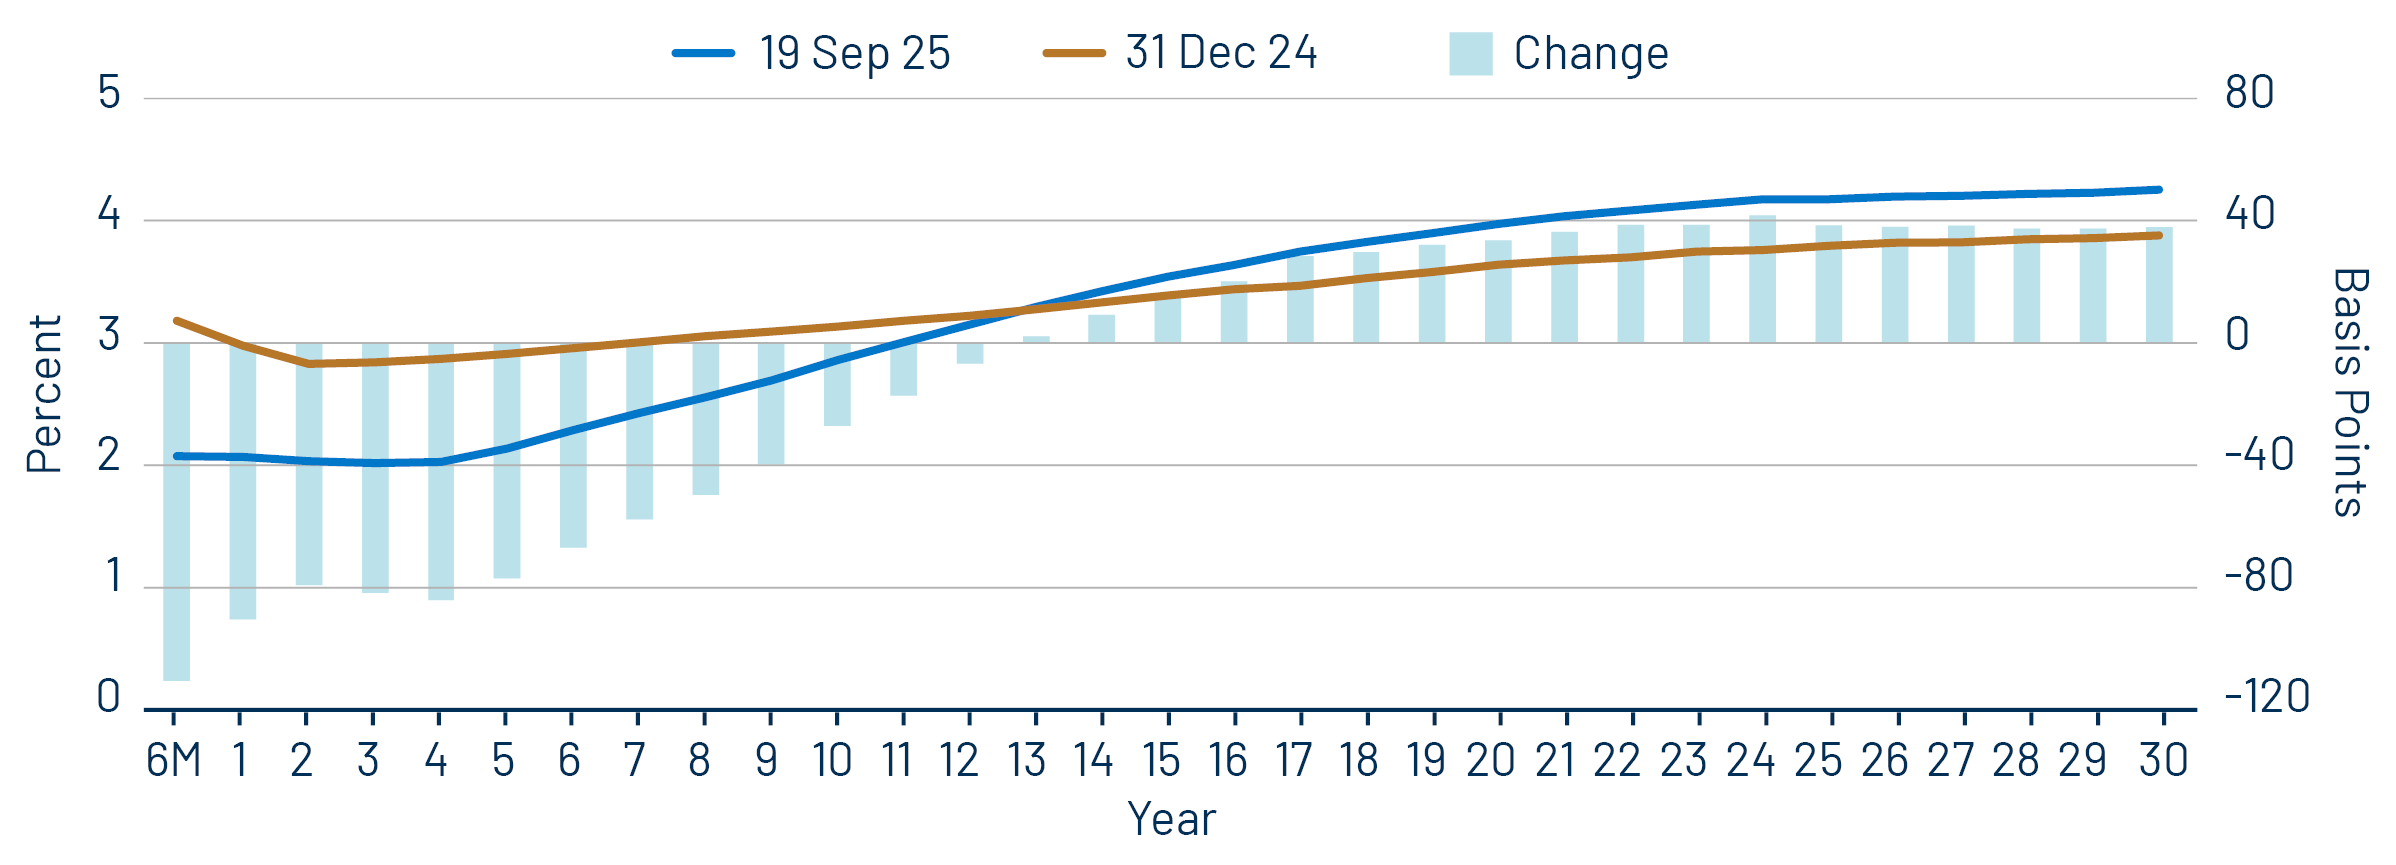
Theme #2: The AAA muni curve has steepened, offering better value in intermediate and longer maturities.

Exhibit 7: AAA Municipal vs. Treasury Yield Curves
AAA Municipal vs. Treasury Yield Curves
Source: Bloomberg, Western Asset. As of 19 Sep 25. Bloomberg Valuation Service (BVAL) AAA Muni Curve and US On-/Off-the-Run Sovereign Curve. Indexes are unmanaged and one cannot directly invest in them. They do not include fees, expenses or sales charges. Past performance is not an indicator or a guarantee of future results. Select the image to expand the view.

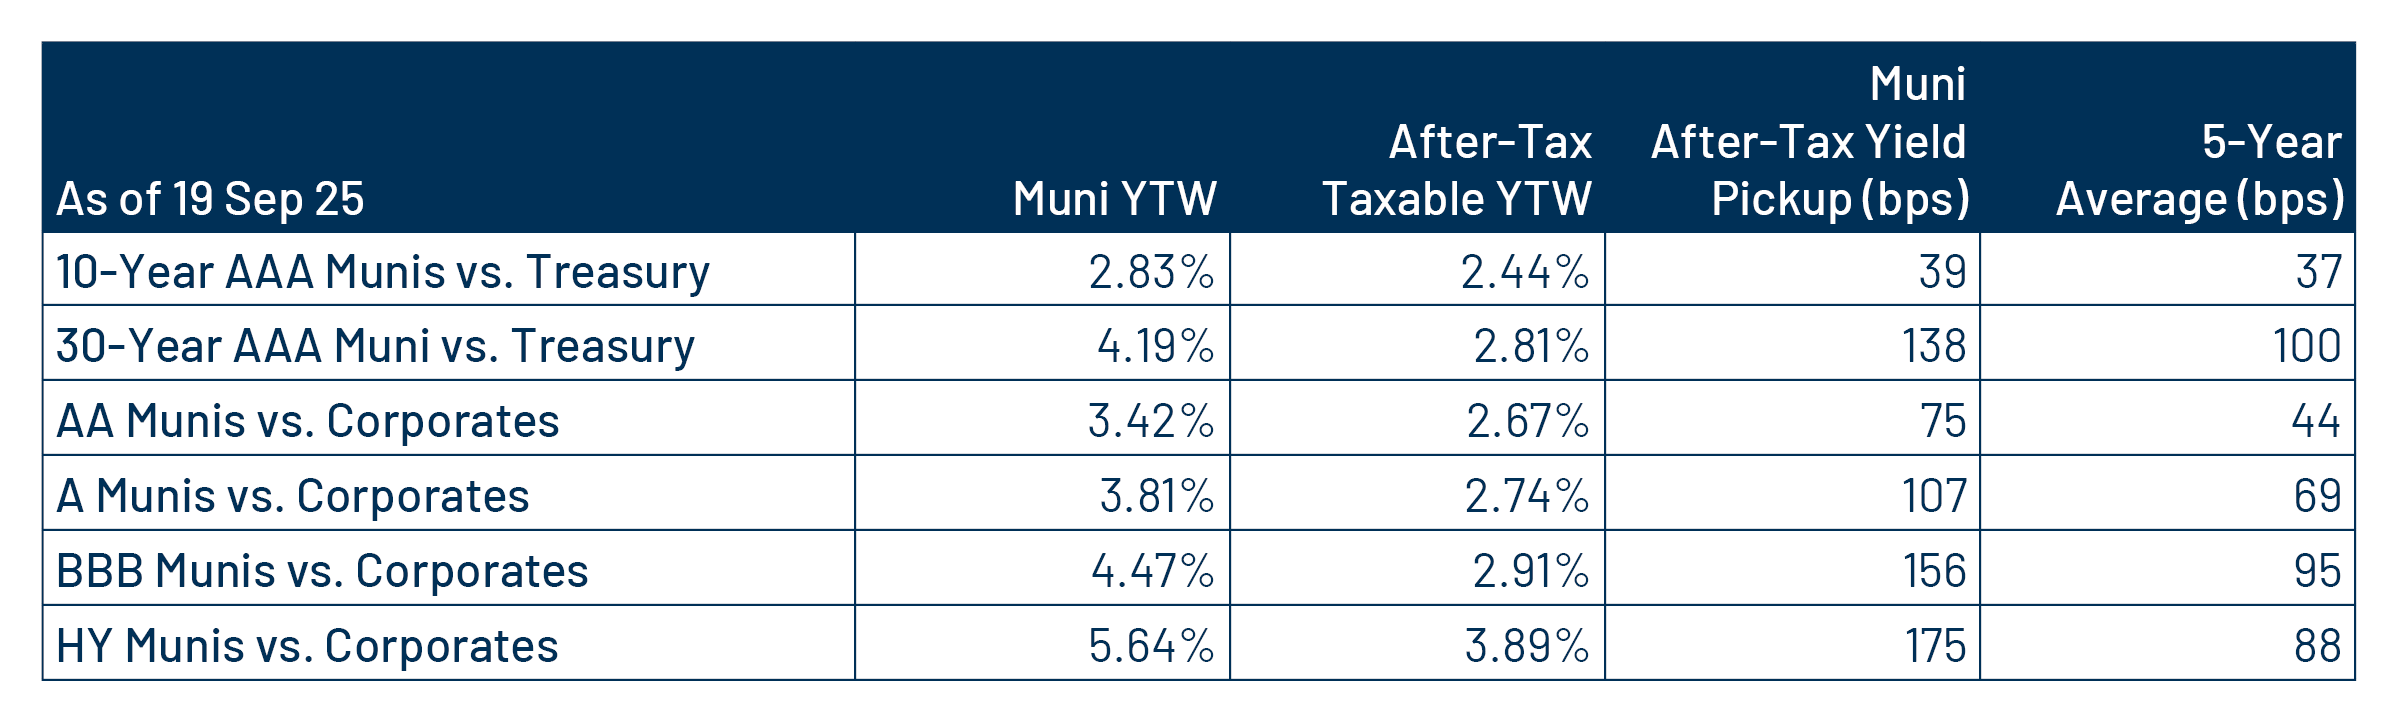
Theme #3: Munis offer attractive after-tax yield compared to taxable alternatives.

Exhibit 8: Municipal vs. Taxable Fixed-Income Yields by Quality
Municipal vs. Taxable Fixed-Income Yields by Quality
Source: Western Asset, Bloomberg. As of 19 Sep 25. 10- and 30-Year comparison reflects Bloomberg Valuation Service (BVAL) AAA Muni Curve and US On-/Off-the-Run Sovereign Curve. AA Muni reflects the Bloomberg AA Muni Bond Index. A Muni reflects the Bloomberg A Muni Bond Index. BBB Muni reflects the Bloomberg BBB Muni Bond Index. HY Muni reflects the Bloomberg High Yield Muni Bond Index. AA Corp reflects the Bloomberg AA Corporate Bond Index. A Corp reflects the Bloomberg A Corporate Bond Index. BBB Corp reflects the Bloomberg BBB Corporate Bond Index. After-tax yield considers the top marginal tax rate of 40.8%. Indexes are unmanaged and one cannot directly invest in them. They do not include fees, expenses or sales charges. Past performance is not an indicator or a guarantee of future results. Select the image to expand the view.

© Western Asset Management Company, LLC 2025. The information contained in these materials ("the materials") is intended for the exclusive use of the designated recipient ("the recipient"). This information is proprietary and confidential and may contain commercially sensitive information, and may not be copied, reproduced or republished, in whole or in part, without the prior written consent of Western Asset Management Company ("Western Asset").
Past performance does not predict future returns. These materials should not be deemed to be a prediction or projection of future performance. These materials are intended for investment professionals including professional clients, eligible counterparties, and qualified investors only.
These materials have been produced for illustrative and informational purposes only. These materials contain Western Asset's opinions and beliefs as of the date designated on the materials; these views are subject to change and may not reflect real-time market developments and investment views.
Third party data may be used throughout the materials, and this data is believed to be accurate to the best of Western Asset's knowledge at the time of publication, but cannot be guaranteed. These materials may also contain strategy or product awards or rankings from independent third parties or industry publications which are based on unbiased quantitative and/or qualitative information determined independently by each third party or publication. In some cases, Western Asset may subscribe to these third party's standard industry services or publications. These standard subscriptions and services are available to all asset managers and do not influence rankings or awards in any way.
Investment strategies or products discussed herein may involve a high degree of risk, including the loss of some or all capital. Investments in any products or strategies described in these materials may be volatile, and investors should have the financial ability and willingness to accept such risks.
Unless otherwise noted, investment performance contained in these materials is reflective of a strategy composite. All other strategy data and information included in these materials reflects a representative portfolio which is an account in the composite that Western Asset believes most closely reflects the current portfolio management style of the strategy. Performance is not a consideration in the selection of the representative portfolio. The characteristics of the representative portfolio shown may differ from other accounts in the composite. Information regarding the representative portfolio and the other accounts in the composite are available upon request. Statements in these materials should not be considered investment advice. References, either general or specific, to securities and/or issuers in the materials are for illustrative purposes only and are not intended to be, and should not be interpreted as, recommendation to purchase or sell such securities. Employees and/or clients of Western Asset may have a position in the securities or issuers mentioned.
These materials are not intended to provide, and should not be relied on for, accounting, legal, tax, investment or other advice. The recipient should consult its own counsel, accountant, investment, tax, and any other advisers for this advice, including economic risks and merits, related to making an investment with Western Asset. The recipient is responsible for observing the applicable laws and regulations of their country of residence.
Founded in 1971, Western Asset Management Company is a global fixed-income investment manager with offices in Pasadena, New York, London, Singapore, Tokyo, Melbourne, São Paulo, Hong Kong, and Zürich. Western Asset is a wholly owned subsidiary of Franklin Resources, Inc. but operates autonomously. Western Asset is comprised of six legal entities across the globe, each with distinct regional registrations: Western Asset Management Company, LLC, a registered Investment Adviser with the Securities and Exchange Commission; Western Asset Management Company Ltda. is regulated by Comissão de Valores Mobiliários; Western Asset Management Company Pty Ltd ABN 41 117 767 923 is the holder of the Australian Financial Services License 303160; Western Asset Management Company Pte. Ltd. Co. Reg. No. 200007692R is a holder of a Capital Markets Services License for fund management and regulated by the Monetary Authority of Singapore; Western Asset Management Company Ltd, a registered Financial Instruments Business Operator and regulated by the Financial Services Agency of Japan; and Western Asset Management Company Limited is authorised and regulated by the Financial Conduct Authority ("FCA") (FRN 145930). This communication is intended for distribution to Professional Clients only if deemed to be a financial promotion in the UK as defined by the FCA. This communication may also be intended for certain EEA countries where Western Asset has been granted permission to do so. For the current list of the approved EEA countries please contact Western Asset at +44 (0)20 7422 3000.