skip navigation
Western Asset Management Company
Blog

Stay up to date on timely topics and market events. Subscribe to our Blog now.

MARKETS
March 03, 2026

Weekly Municipal Monitor—February Update

By Sam Weitzman

Stay up to date on timely topics and market events. Subscribe to our Blog now.

Macros, Markets and Munis

Munis posted positive returns but underperformed taxable fixed-income last week. Economic data was relatively limited last week, as market volatility remained elevated on concerns surrounding rapid AI development. While Producer Price Index (PPI) readings and consumer sentiment came in above expectations, a flight-to-quality sentiment took hold and high-grade fixed-income rallied. Treasuries moved 10-15 basis points (bps) lower across the yield curve, while municipals outperformed with high-grade munis yields moving 2-6 bps lower across the curve. Meanwhile, municipal demand remained robust, underscored by a 14th consecutive week of inflows. Following a strong month of performance, we provide a muni market update for the month of February.

Muni Fund Flow Streak Continues Amid Elevated Supply Conditions

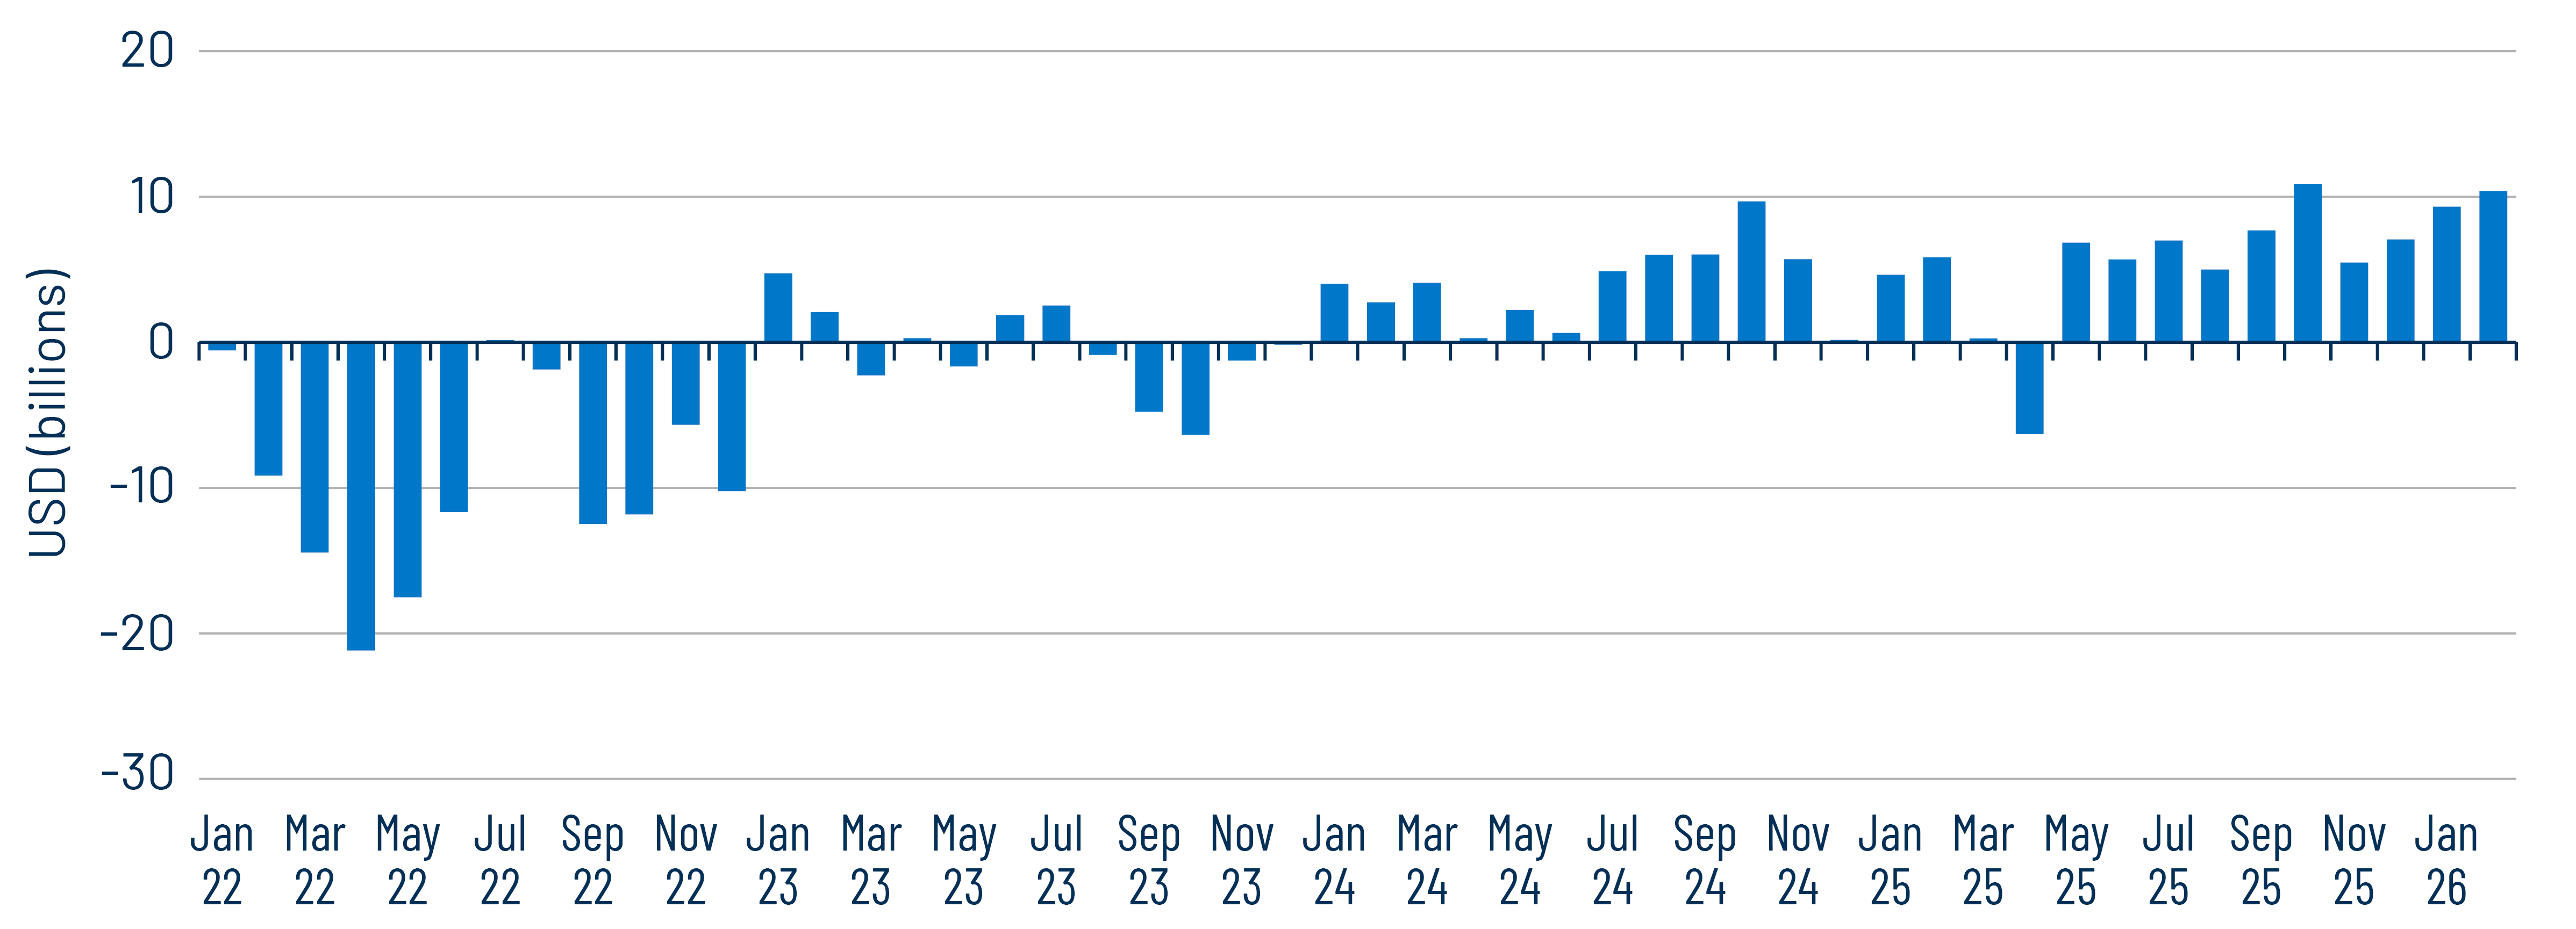
Fund Flows ($1.0 billion of net inflows): During the week ending February 25, weekly reporting municipal mutual funds recorded $1.0 billion of net inflows, according to Lipper. Long-term and intermediate categories recorded $530 million and $488 million of inflows, respectively. Short-duration funds recorded $68 million of outflows. Last week’s inflows marked the 14th consecutive week of net inflows and led year-to-date (YTD) inflows higher to $18 billion.

Supply (YTD supply of $79 billion; up 17% YoY): The muni market recorded $11 billion of new-issue supply last week, up 31% from the prior week. YTD new-issue supply of $79 billion is 79% higher from the prior year, with tax-exempt issuance up 19% year-over-year (YoY) and taxable issuance down 17% YoY, respectively. This week’s calendar is expected to increase to $13 billion. The largest deals include $1.3 billion city of Houston, TX and $786 million Arizona Highway Transportation Board transactions.

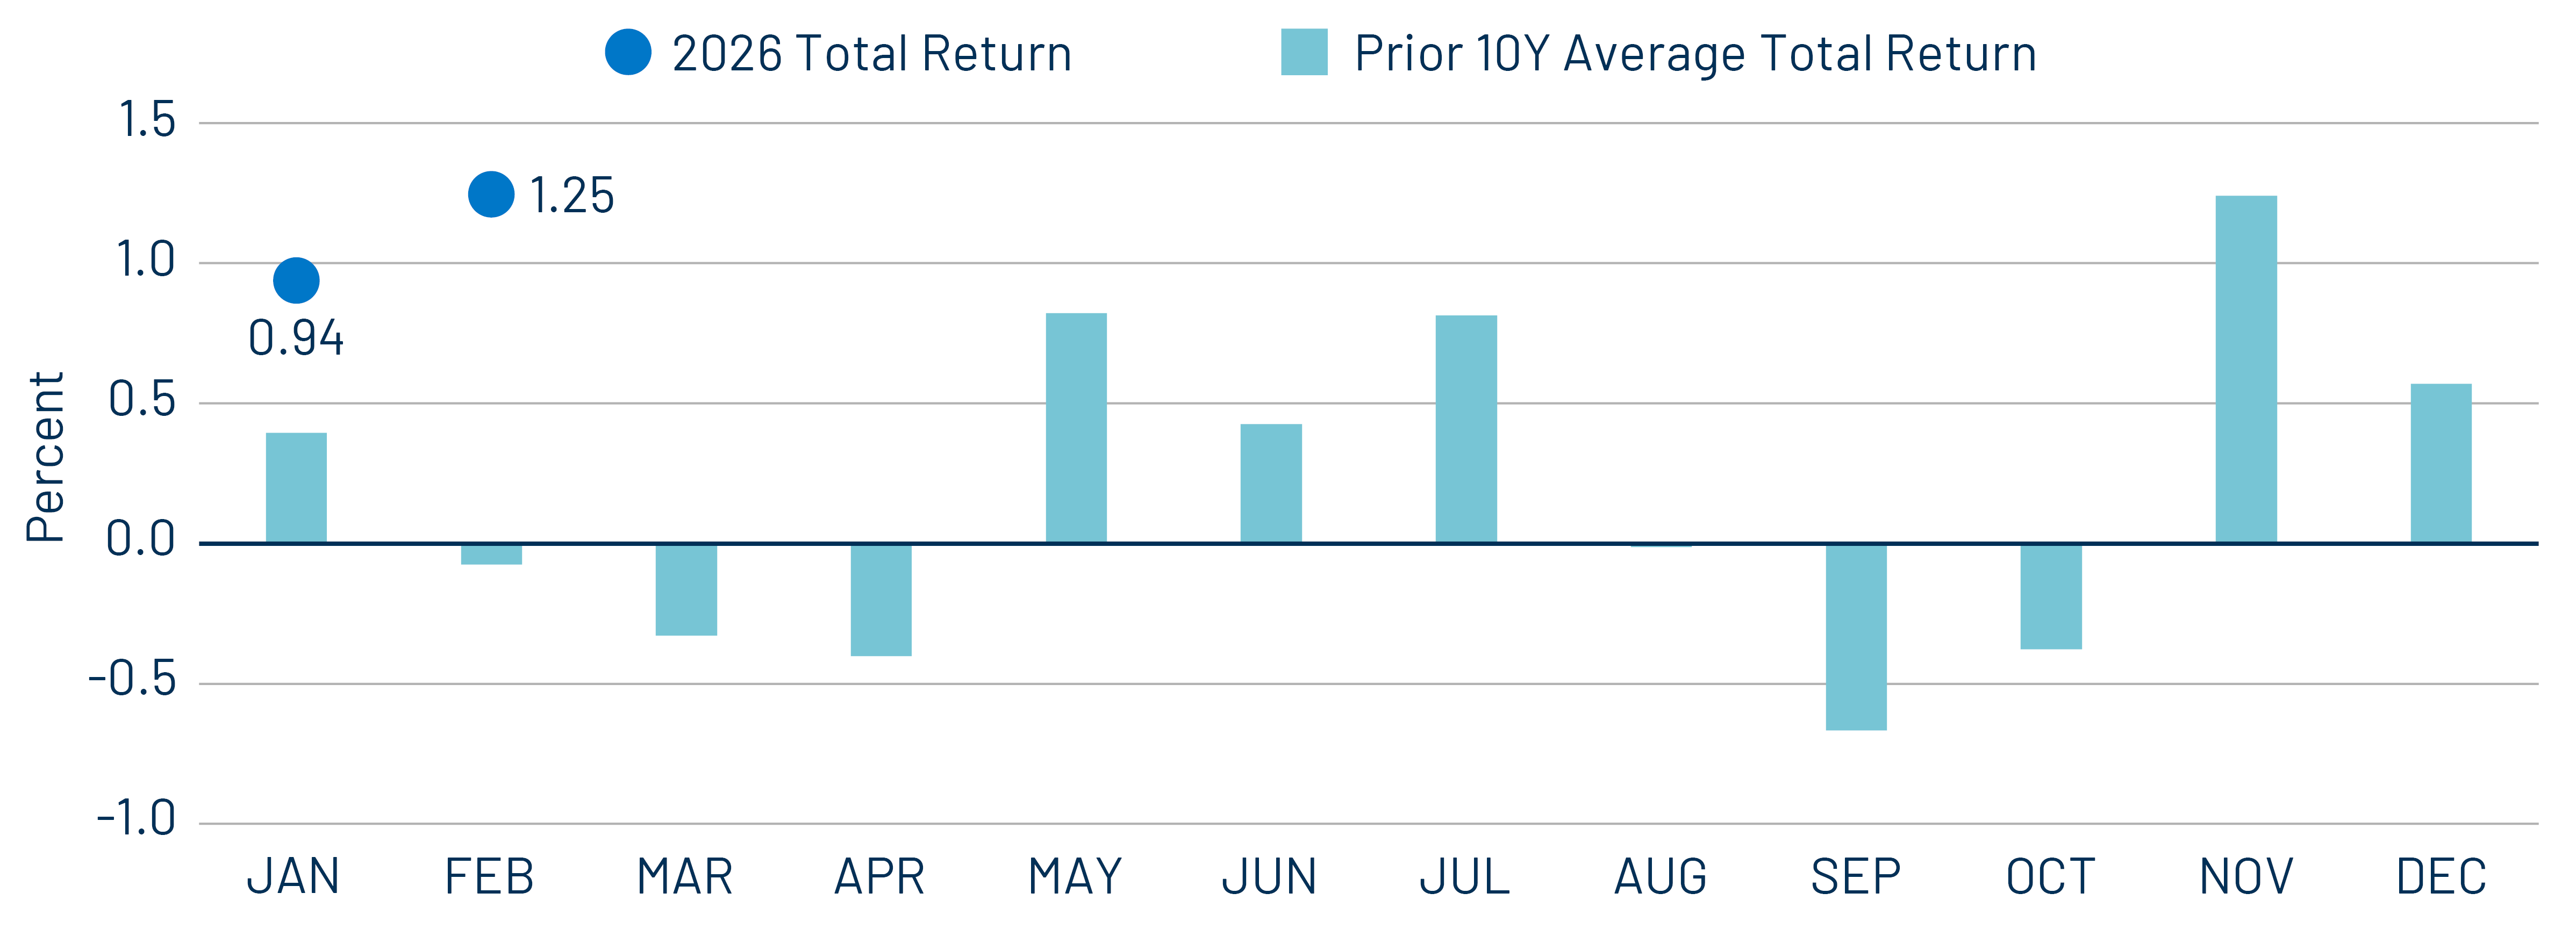
This Week in Munis: February Update

The municipal market posted strong returns in February, with the Bloomberg Municipal Bond Index gaining 1.25% and leading YTD returns higher to 2.20%. Longer-duration and lower-credit-quality municipals generally outperformed during the month. February’s strong performance counters the recent historical weakness with the index averaging negative returns in February, largely driven by softening demand ahead of tax season and limited new issuance.

Exhibit 1: 2026 Monthly Performance vs. 10-Year Average
2026 Monthly Performance vs. 10-Year Average
Source: Western Asset, Bloomberg. As of 27 Feb 26. Select the image to expand the view.

The strong start of the year has been supported by renewed investor demand, as capital has moved decisively back into municipal mutual funds. Investors appear to show an increasing willingness to capitalize on relatively attractive municipal valuations during periods of elevated market volatility, particularly in longer maturities as the yield curve steepened. According to weekly and monthly Lipper and ICI data, municipal mutual funds recorded over $10 billion of net inflows in February. Notably, Lipper estimates that approximately 86% of the $18 billion in YTD inflows has been concentrated in intermediate and long duration fund categories. Since January 2024, cumulative net inflows of over $126 billion on top of strong SMA demand, have fully offset the $122 billion of net outflows experienced in 2022 and 2023.

Exhibit 2: ICI Municipal Mutual Fund and ETF Flows (Monthly)
ICI Municipal Mutual Fund and ETF Flows (Monthly)
Source: Western Asset, ICI. As of 25 Feb 26. Select the image to expand the view.

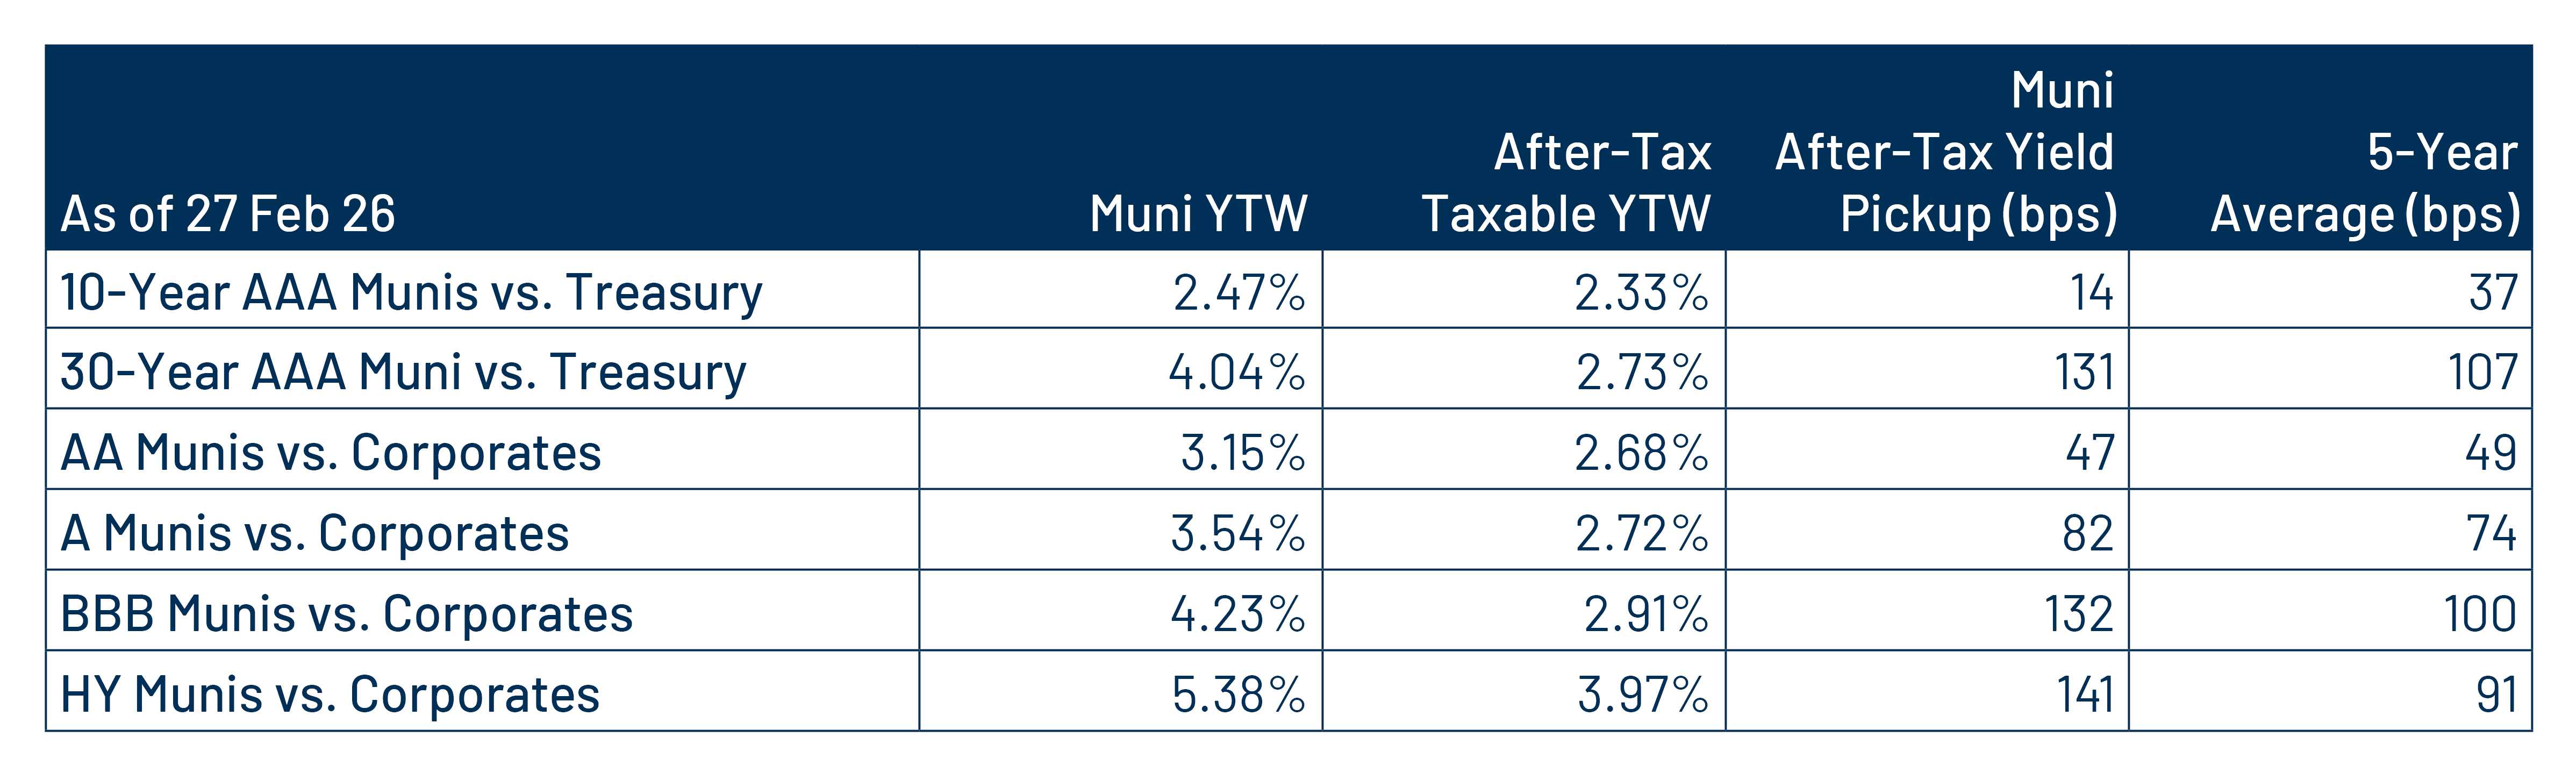
The strong YTD performance also represents a meaningful reversal of the underperformance the municipal market experienced in 2025, and muni supply and demand dynamics have shifted valuations in certain segments of the market. For example, AAA rated municipals maturing inside of 10 years now yield less than comparable Treasuries on an after-tax basis, assuming a 37% effective tax rate, largely attributable to high demand for SMA strategies concentrated in shorter maturities. In contrast, using the same tax rate, AAA municipals beyond 20 years offer more than 100 bps of after-tax yield advantage relative to Treasuries. We believe these valuation disparities create opportunities for active managers to deliver tax-efficient outcomes.

Exhibit 3: AAA Municipal Yield Curve
AAA Municipal Yield Curve
Source: Western Asset, Bloomberg. As of 27 Feb 26. After-tax yield assumes an effective tax rate of 37%. Select the image to expand the view.

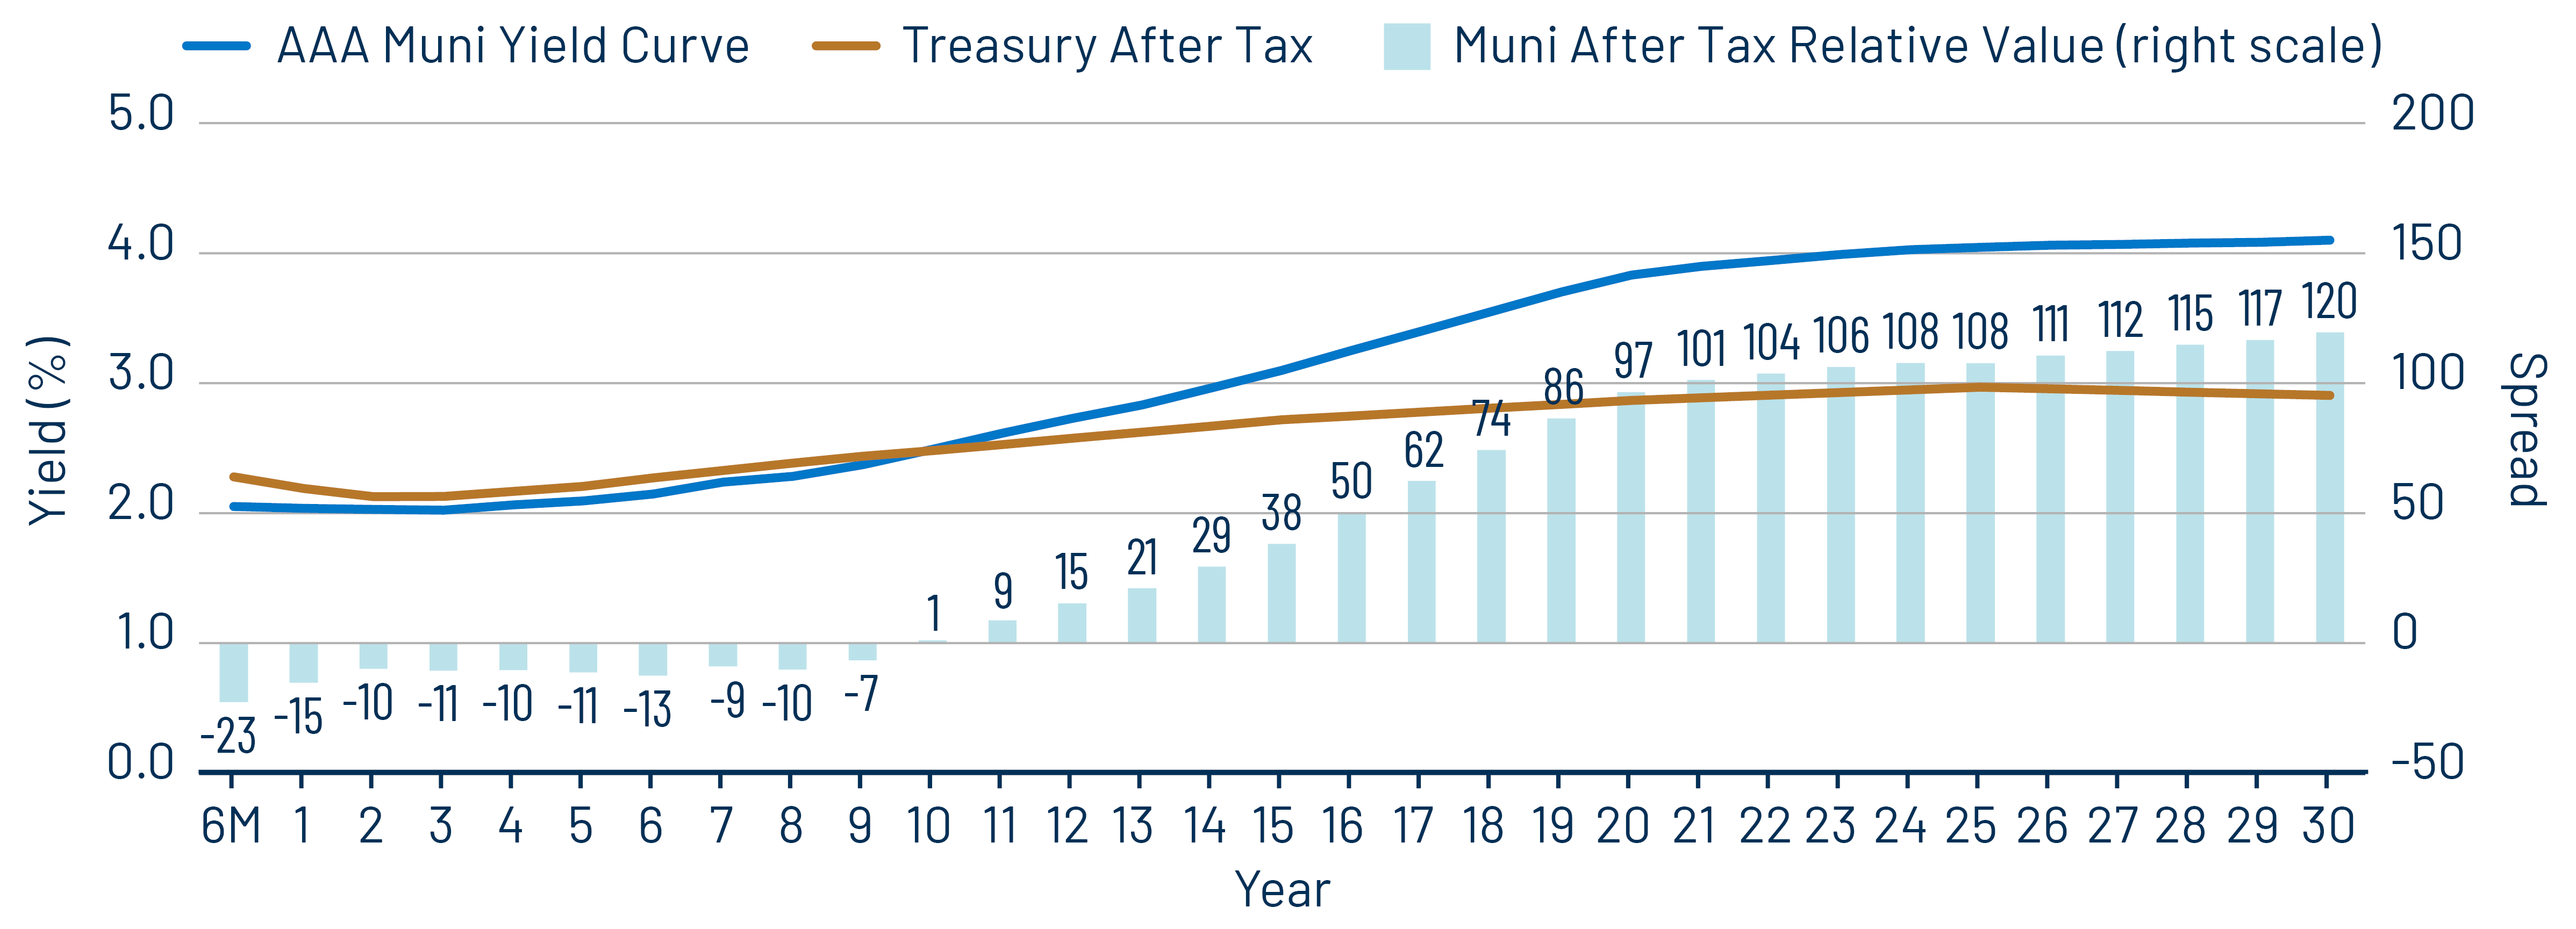
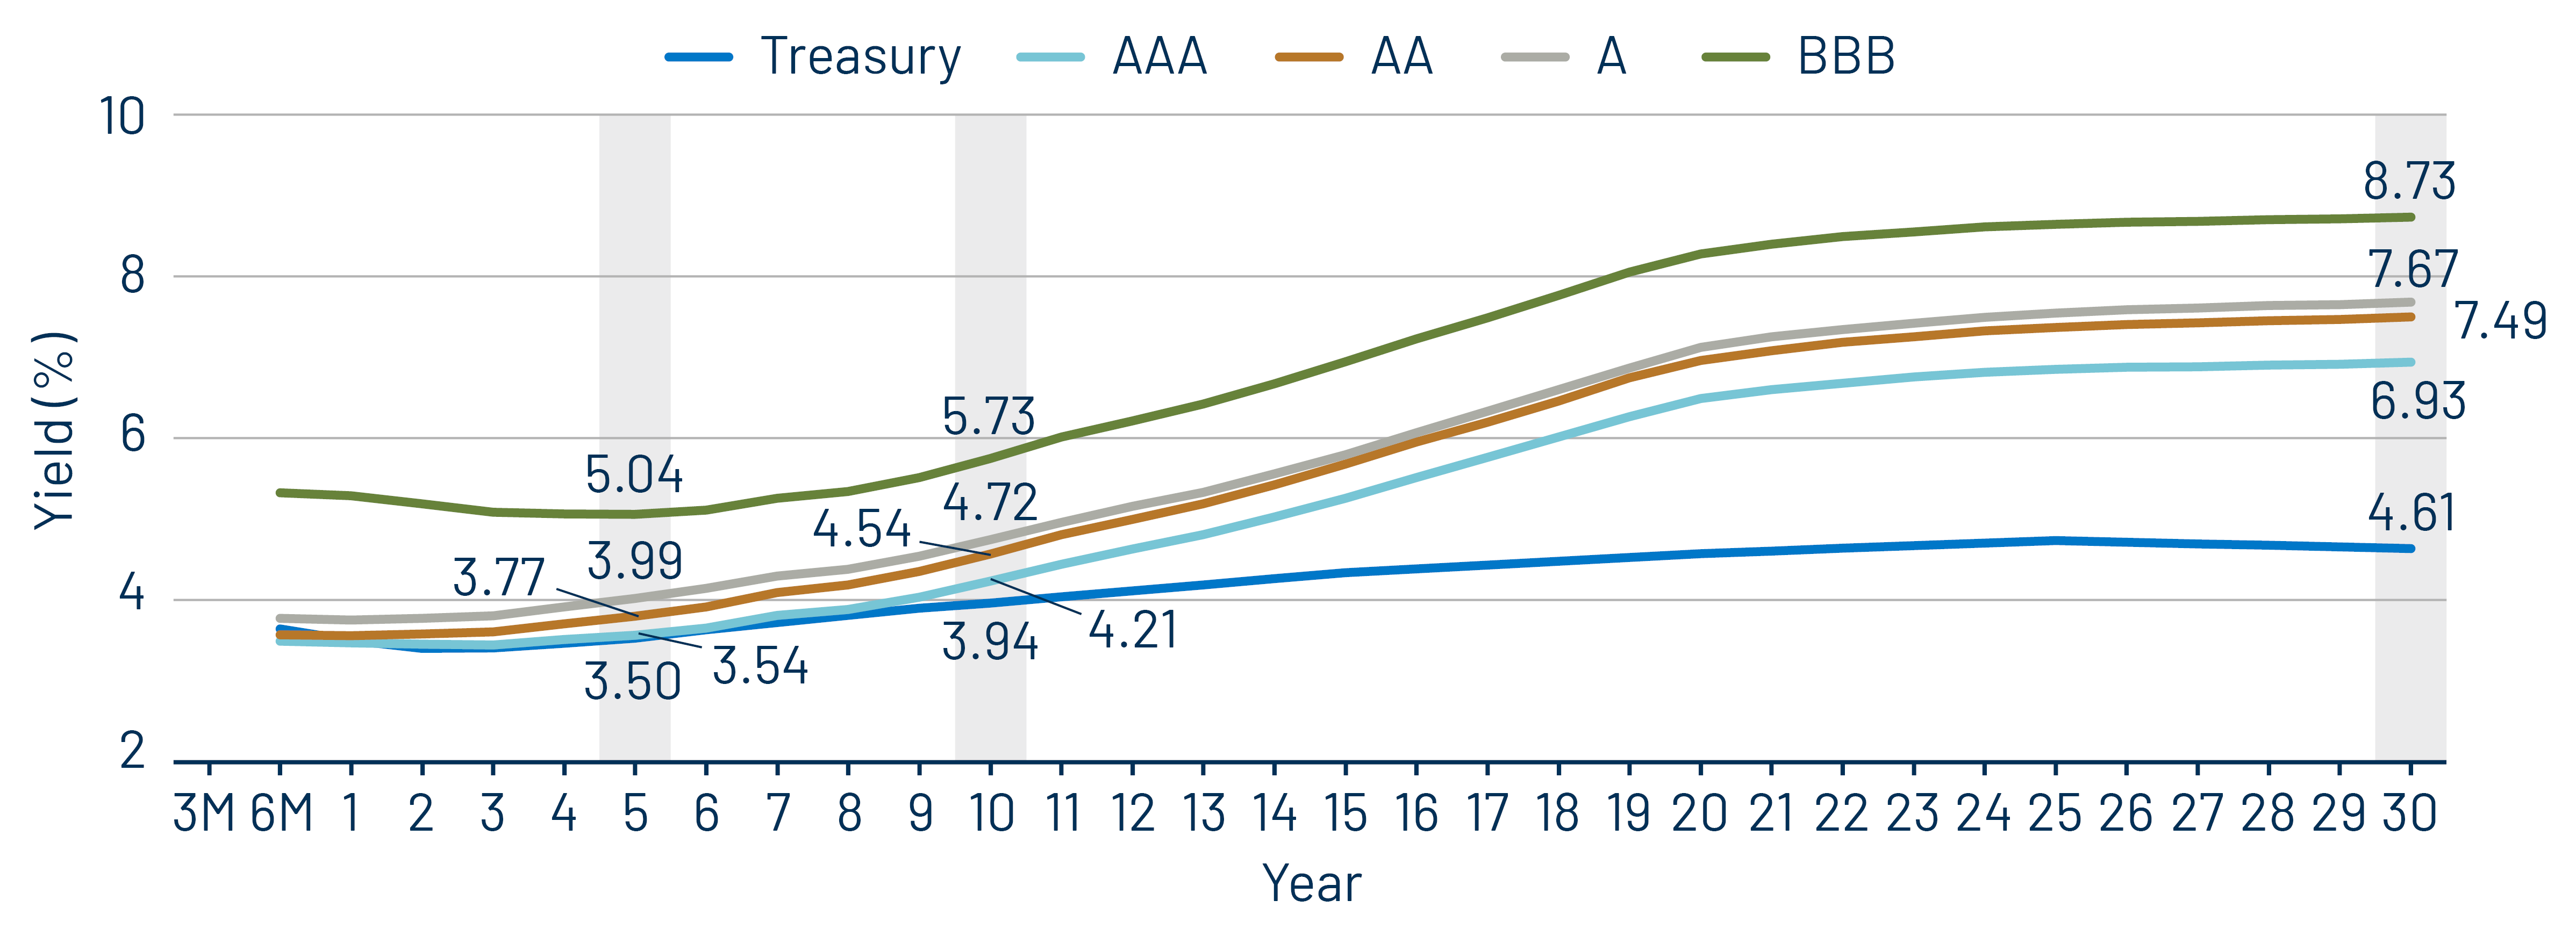
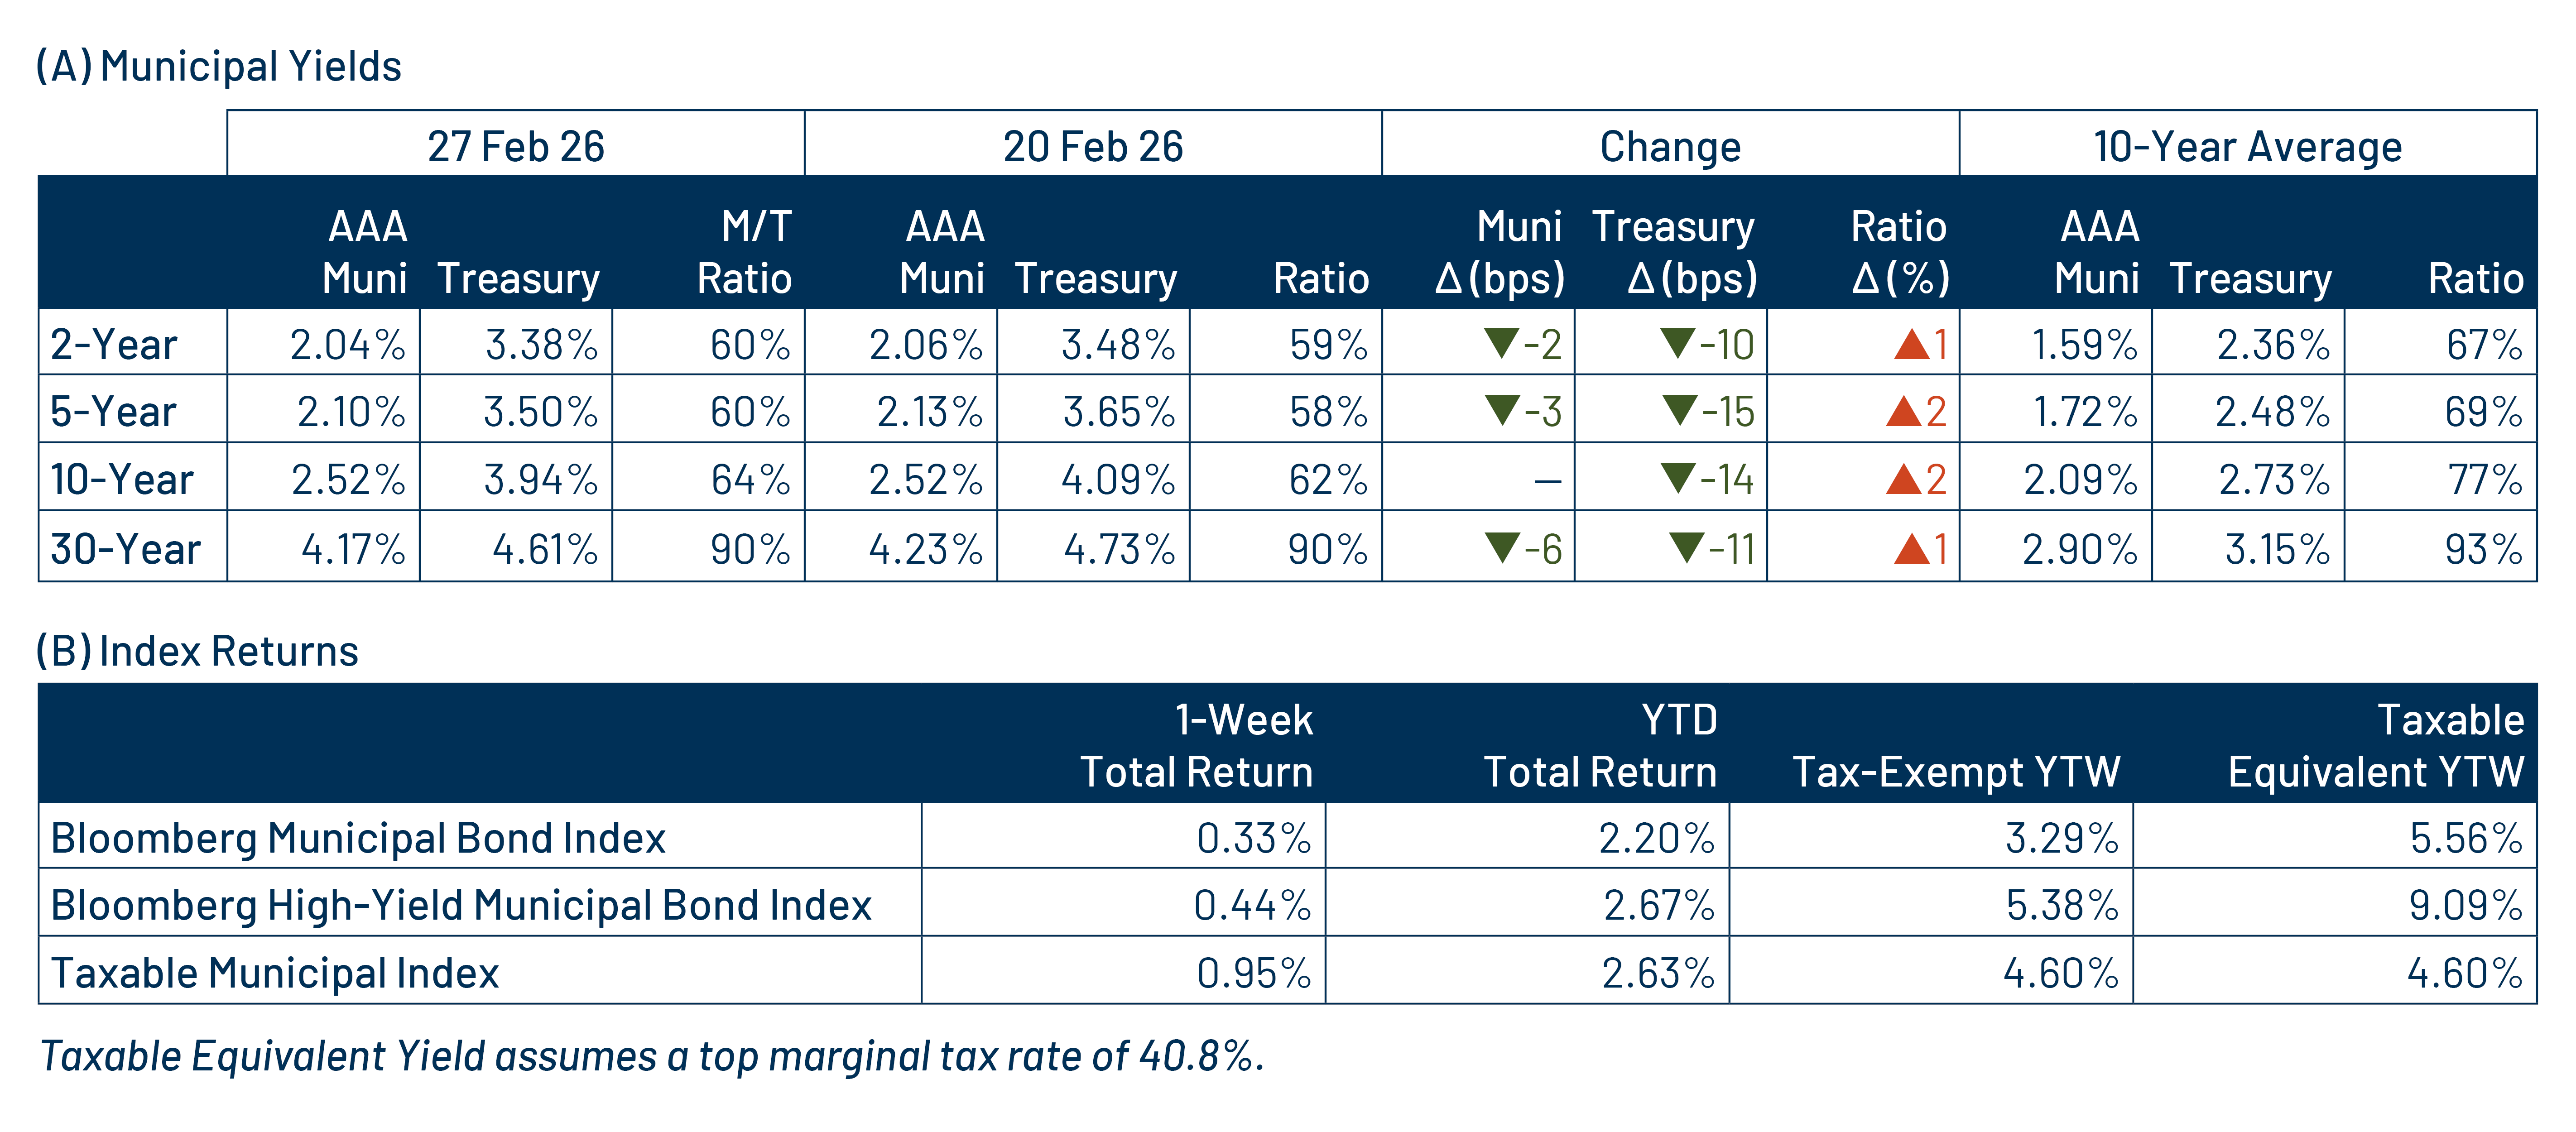
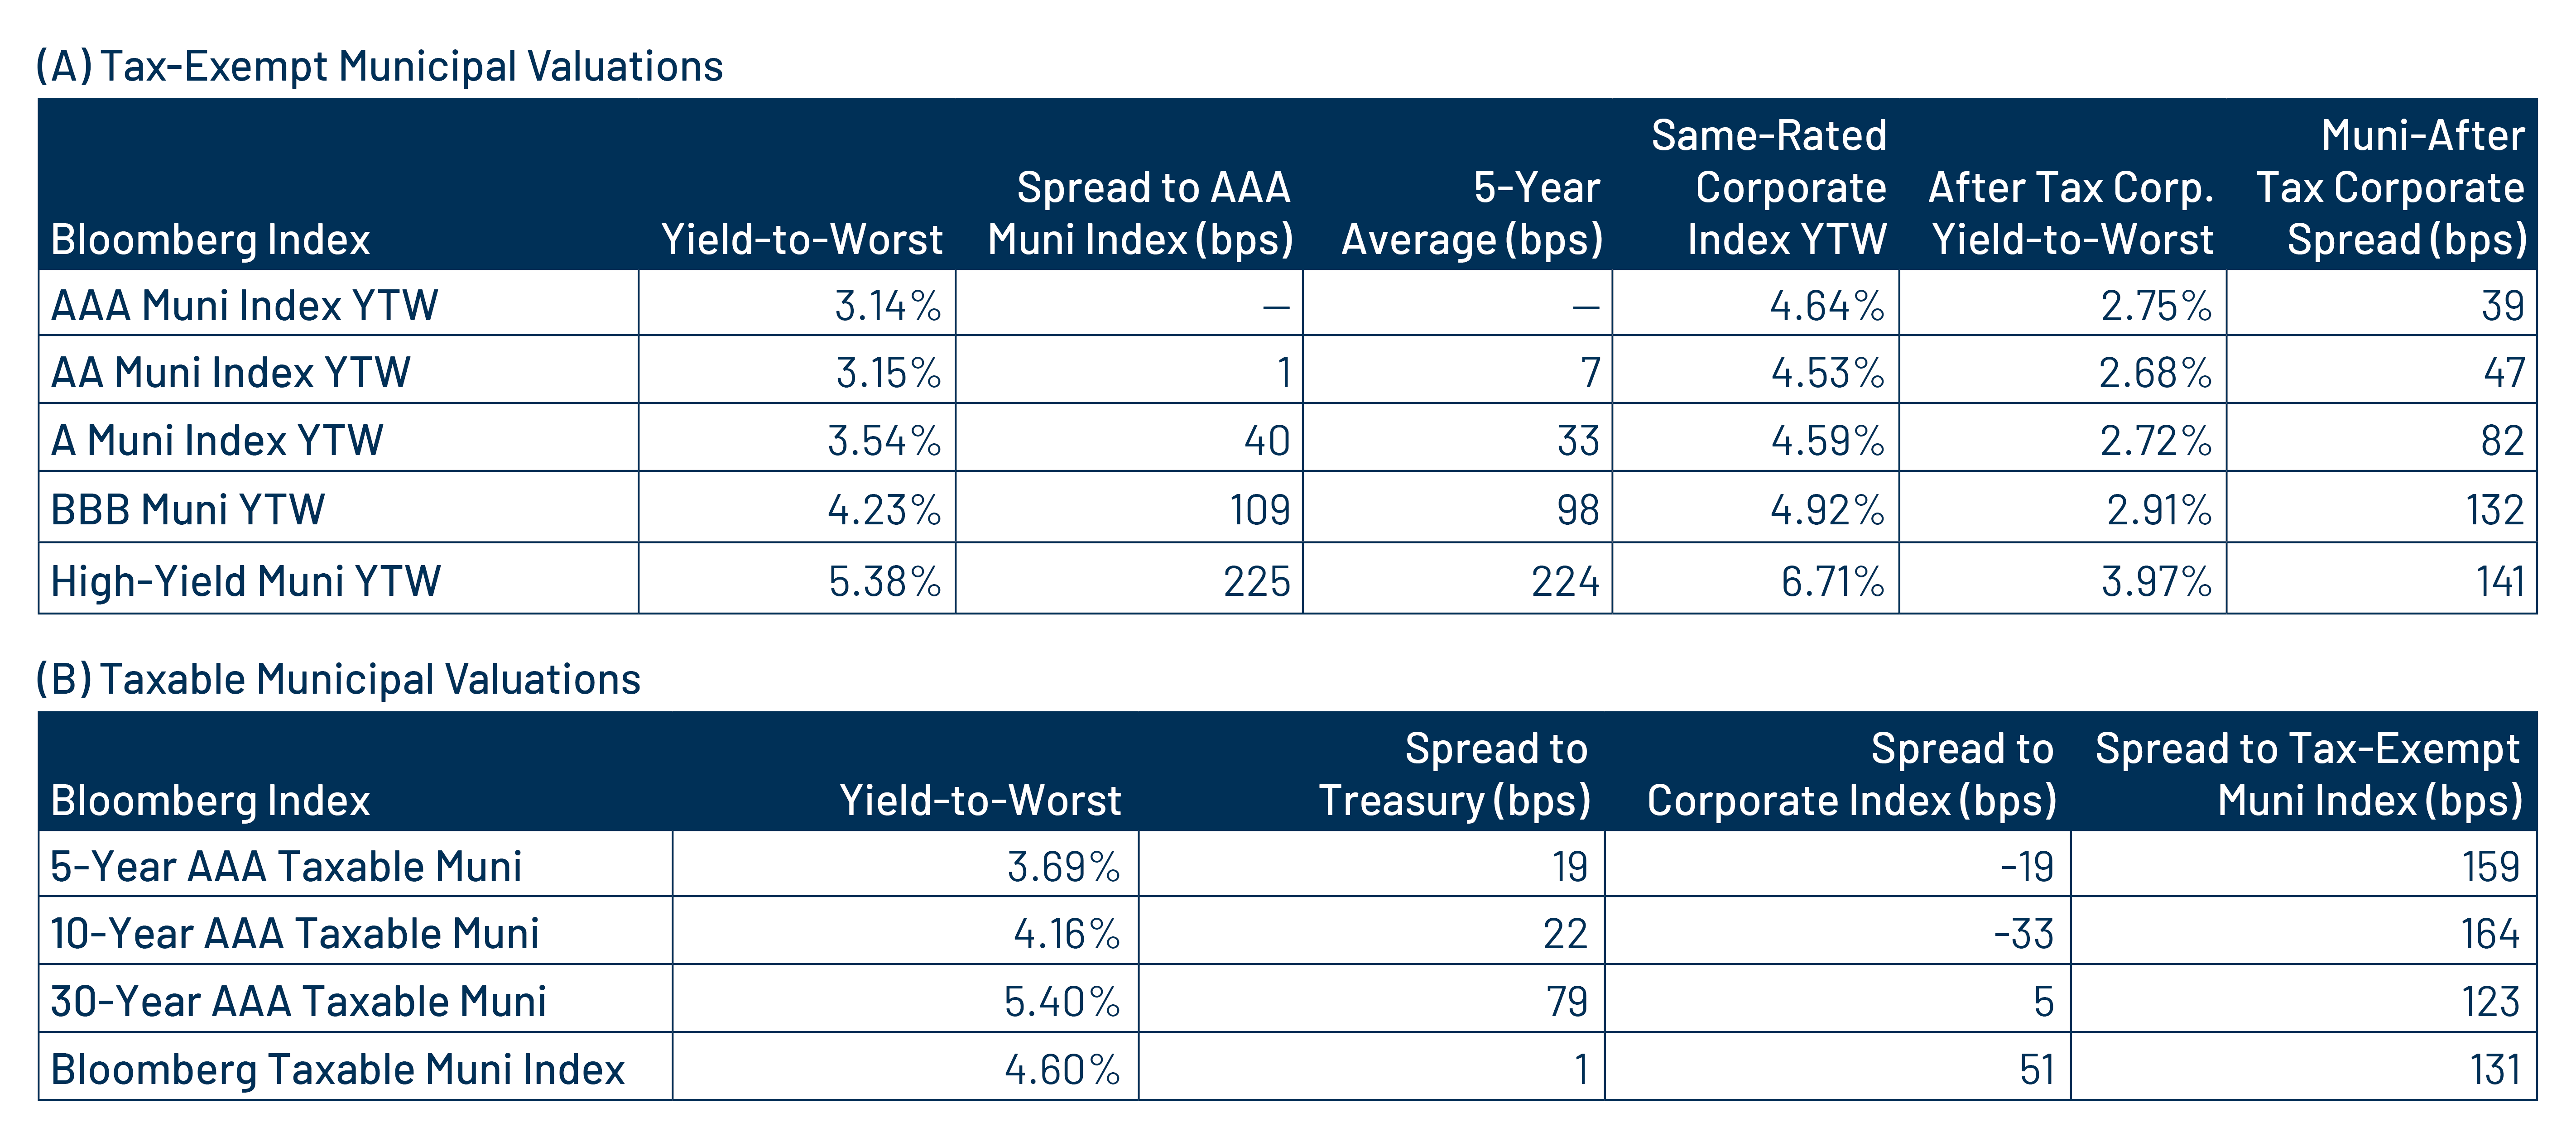
Municipal Credit Curves and Relative Value

Exhibit 4: Muni Credit Curves
Muni Credit Curves
Source: Bloomberg, Western Asset. As of 27 Feb 26. Bloomberg Valuation Service (BVAL) Municipal Credit Indices (AAA, AA, A, BBB, respectively) and US Sovereign Curves. Taxable-Equivalent Muni Credit Curves consider the top marginal effective tax rate of 40.8%. AA Muni is represented by the US General Obligation AA Muni BVAL Yield Curve. The BVAL curve is populated with pricing from uninsured AA General Obligation bonds. A Muni is represented by the US General Obligation A Muni BVAL Yield Curve. The BVAL curve is populated with pricing from uninsured A General Obligation bonds. BBB Muni is represented by the US General Obligation BBB Muni BVAL Yield Curve. The BVAL curve is populated with pricing from uninsured BBB General Obligation bonds. Indices are unmanaged and one cannot directly invest in them. They do not include fees, expenses or sales charges. Past performance is not an indicator or a guarantee of future results. Select the image to expand the view.
Exhibit 5: Taxable-Equivalent Muni Credit Curves
Taxable-Equivalent Muni Credit Curves
Source: Bloomberg, Western Asset. As of 27 Feb 26. Bloomberg Valuation Service (BVAL) Municipal Credit Indices (AAA, AA, A, BBB, respectively) and US Sovereign Curves. Taxable-Equivalent Muni Credit Curves consider the top marginal effective tax rate of 40.8%. AA Muni is represented by the US General Obligation AA Muni BVAL Yield Curve. The BVAL curve is populated with pricing from uninsured AA General Obligation bonds. A Muni is represented by the US General Obligation A Muni BVAL Yield Curve. The BVAL curve is populated with pricing from uninsured A General Obligation bonds. BBB Muni is represented by the US General Obligation BBB Muni BVAL Yield Curve. The BVAL curve is populated with pricing from uninsured BBB General Obligation bonds. Indices are unmanaged and one cannot directly invest in them. They do not include fees, expenses or sales charges. Past performance is not an indicator or a guarantee of future results. Select the image to expand the view.
Exhibit 6: AAA Munis vs. Treasuries
AAA Munis vs. Treasuries
Source: Muni Yields: Thomson Reuters MMD, Treasury Yields: Bloomberg. As of 27 Feb 26. Past performance is not a guarantee of future results. It is not possible to invest directly in an index. Select the image to expand the view.
Exhibit 7: Tax-Exempt and Taxable Muni Valuations
Tax-Exempt and Taxable Muni Valuations
Source: Bloomberg, Western Asset. As of 27 Feb 26. Yield-to-worst (YTW) is the lowest potential yield that can be received on a bond without the issuer actually defaulting. AAA, AA, A, BBB Corporate Indices; After-Tax Yield assumes a top effective tax rate of 40.8%. Taxable Muni Index Corporate comparable used is the Global Corporate Aggregate (ex. BBB) to better align credit quality and duration. Select the image to expand the view.

Western Asset Key Themes for Muni Investors

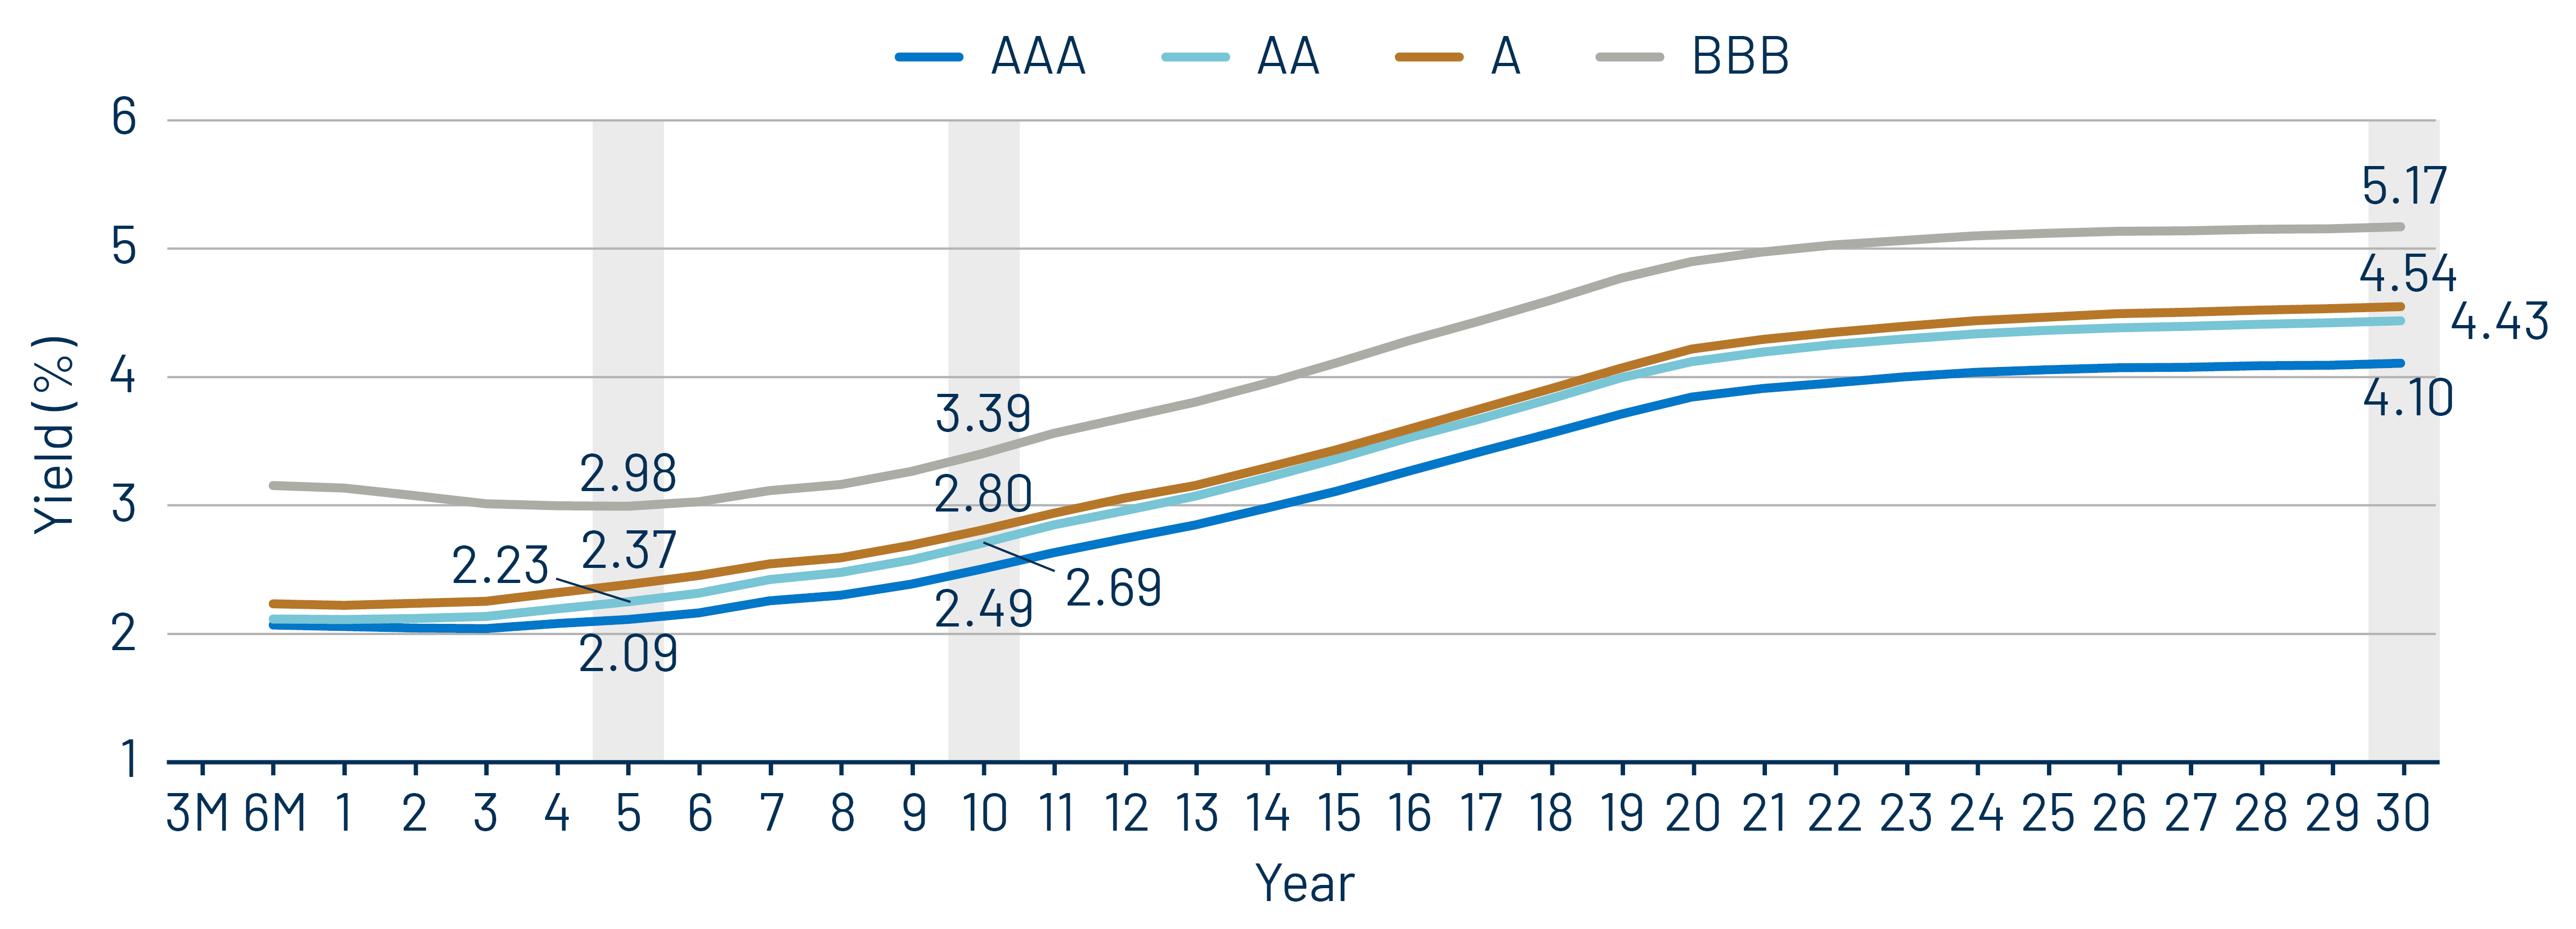
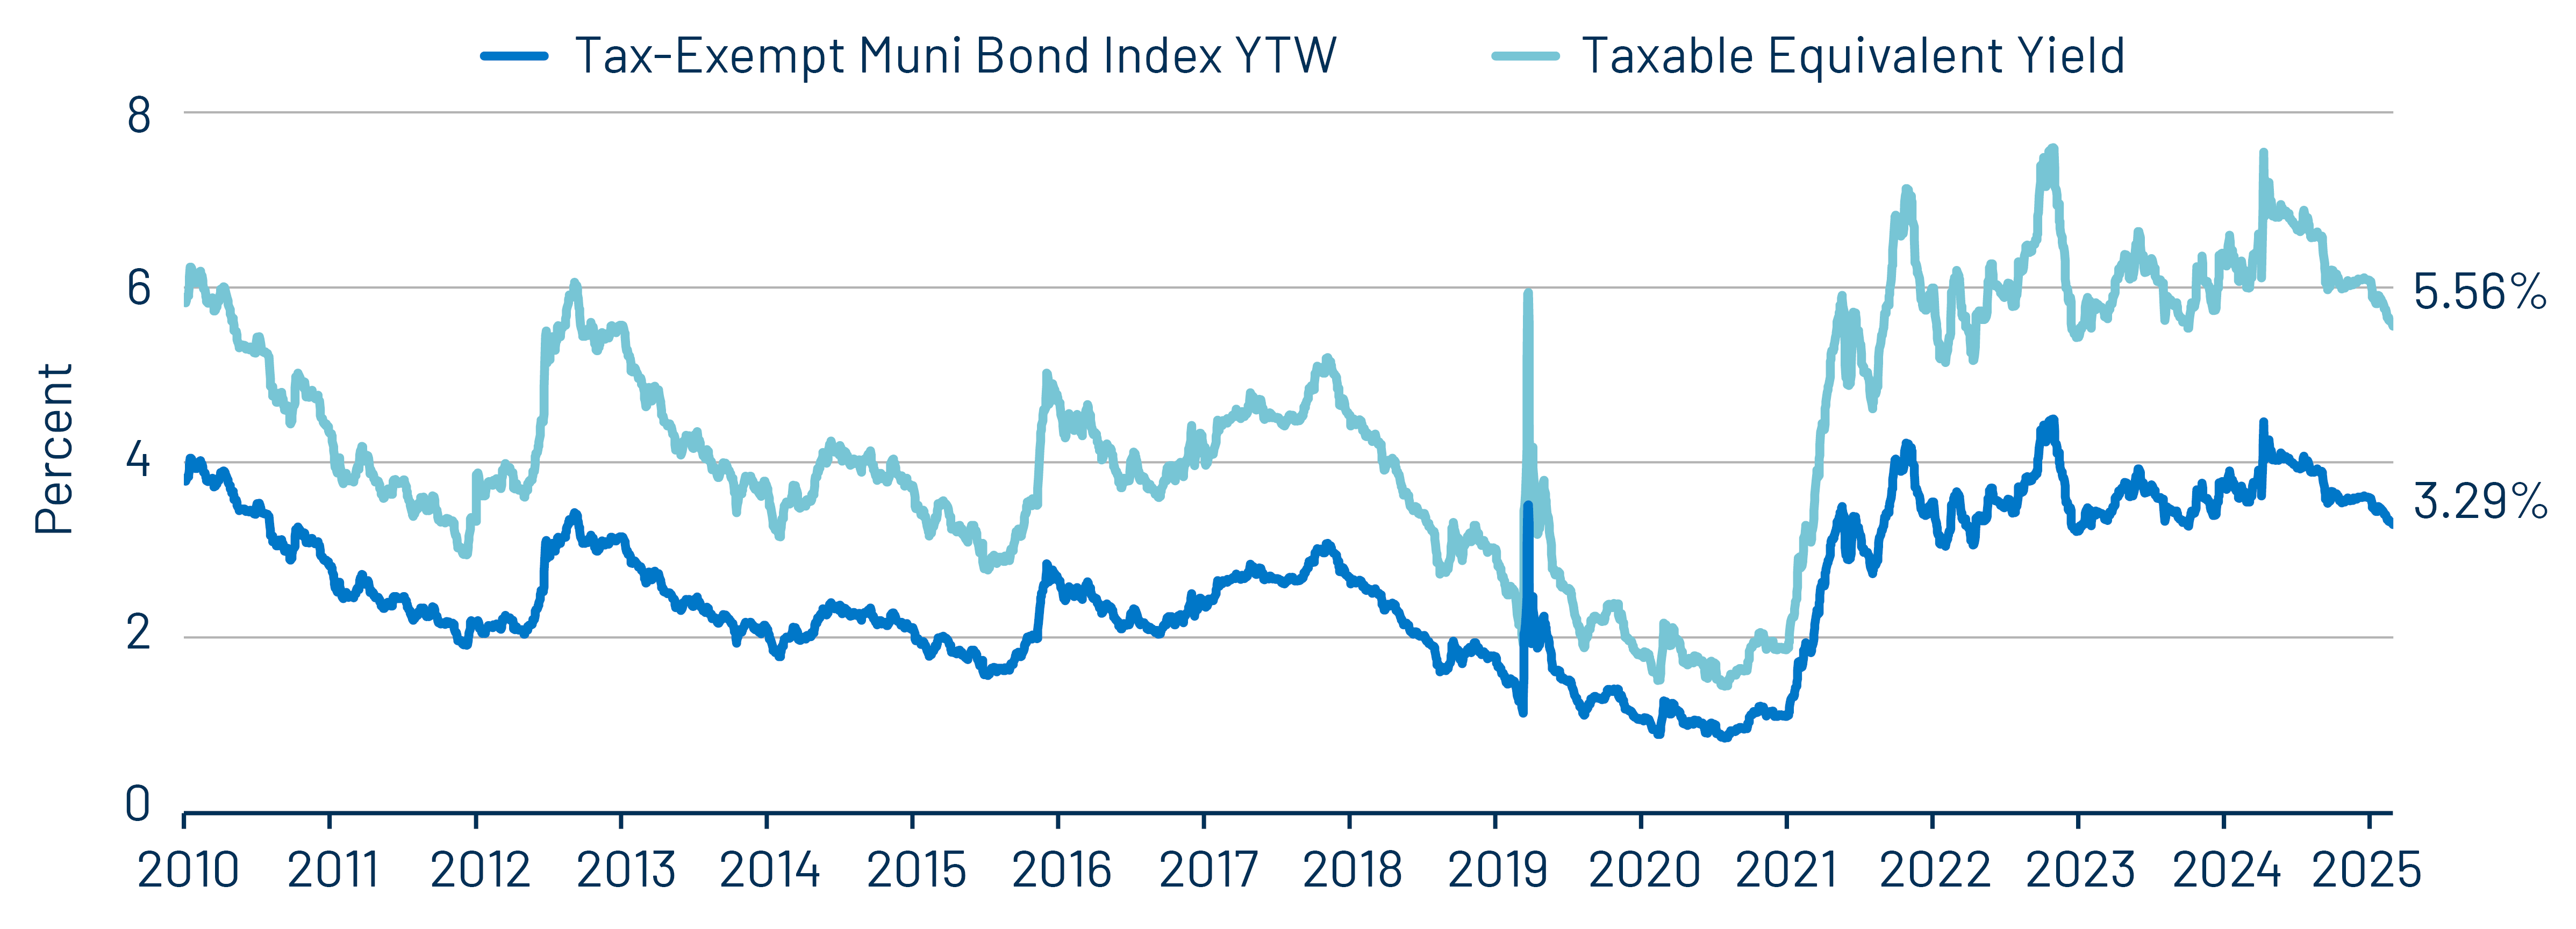
Theme 1: Municipal taxable-equivalent yields moved lower but remain above historical averages.

Exhibit 8: Muni and Taxable-Equivalent Muni Yield-to-Worst
Muni and Taxable-Equivalent Muni Yield-to-Worst
Source: Bloomberg, Western Asset. As of 27 Feb 26. Bloomberg Municipal Bond Index yield considering highest marginal tax rate of 40.8%. Indexes are unmanaged and one cannot directly invest in them. They do not include fees, expenses or sales charges. Past performance is not an indicator or a guarantee of future results. Select the image to expand the view.

Theme 2: Munis offer attractive after-tax yield pickup vs. longer-duration and lower-quality taxable alternatives.

Exhibit 9: AAA Municipal vs. Treasury Yield Curves
AAA Municipal vs. Treasury Yield Curves
Source: Bloomberg, Western Asset. As of 27 Feb 26. Bloomberg Valuation Service (BVAL) AAA Muni Curve and US On-/Off-the-Run Sovereign Curve. Indexes are unmanaged and one cannot directly invest in them. They do not include fees, expenses or sales charges. Past performance is not an indicator or a guarantee of future results. Select the image to expand the view.

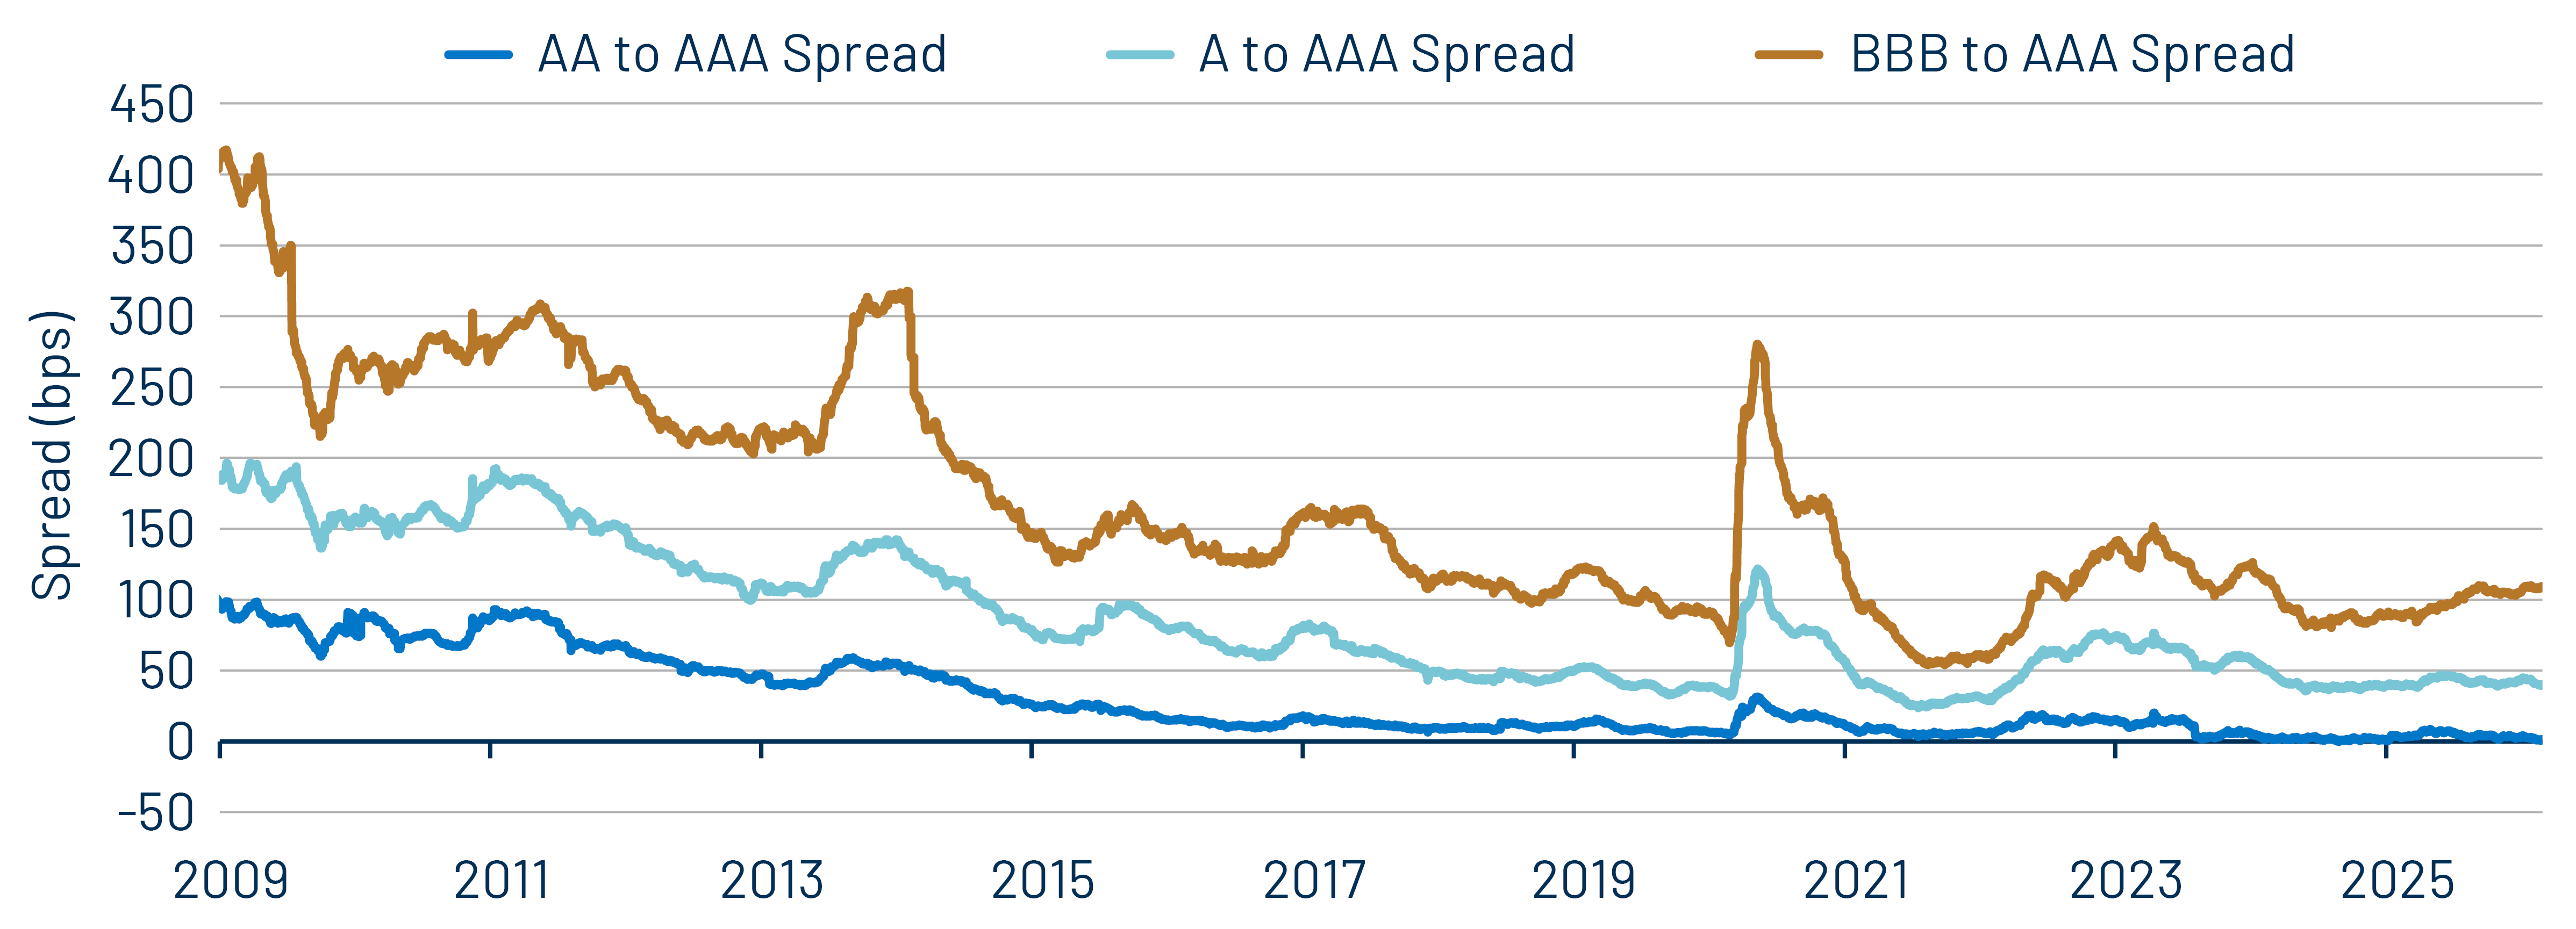
Theme 3: Tight municipal credit spreads underscore the importance of credit selection.

Exhibit 10: Municipal vs. Taxable Fixed-Income Yields by Quality
Municipal vs. Taxable Fixed-Income Yields by Quality
Source: Western Asset, Bloomberg. As of 27 Feb 26. 10- and 30-Year comparison reflects Bloomberg Valuation Service (BVAL) AAA Muni Curve and US On-/Off-the-Run Sovereign Curve. AA Muni reflects the Bloomberg AA Muni Bond Index. A Muni reflects the Bloomberg A Muni Bond Index. BBB Muni reflects the Bloomberg BBB Muni Bond Index. HY Muni reflects the Bloomberg High Yield Muni Bond Index. AA Corp reflects the Bloomberg AA Corporate Bond Index. A Corp reflects the Bloomberg A Corporate Bond Index. BBB Corp reflects the Bloomberg BBB Corporate Bond Index. After-tax yield considers the top marginal tax rate of 40.8%. Indexes are unmanaged and one cannot directly invest in them. They do not include fees, expenses or sales charges. Past performance is not an indicator or a guarantee of future results. Select the image to expand the view.

© Western Asset Management Company, LLC 2026. The information contained in these materials ("the materials") is intended for the exclusive use of the designated recipient ("the recipient"). This information is proprietary and confidential and may contain commercially sensitive information, and may not be copied, reproduced or republished, in whole or in part, without the prior written consent of Western Asset Management Company ("Western Asset").
Past performance does not predict future returns. These materials should not be deemed to be a prediction or projection of future performance. These materials are intended for investment professionals including professional clients, eligible counterparties, and qualified investors only.
For the Franklin Templeton global-non product disclosures, please click here.
These materials have been produced for illustrative and informational purposes only. These materials contain Western Asset's opinions and beliefs as of the date designated on the materials; these views are subject to change and may not reflect real-time market developments and investment views.
Third party data may be used throughout the materials, and this data is believed to be accurate to the best of Western Asset's knowledge at the time of publication, but cannot be guaranteed. These materials may also contain strategy or product awards or rankings from independent third parties or industry publications which are based on unbiased quantitative and/or qualitative information determined independently by each third party or publication. In some cases, Western Asset may subscribe to these third party's standard industry services or publications. These standard subscriptions and services are available to all asset managers and do not influence rankings or awards in any way.
Investment strategies or products discussed herein may involve a high degree of risk, including the loss of some or all capital. Investments in any products or strategies described in these materials may be volatile, and investors should have the financial ability and willingness to accept such risks.
Unless otherwise noted, investment performance contained in these materials is reflective of a strategy composite. All other strategy data and information included in these materials reflects a representative portfolio which is an account in the composite that Western Asset believes most closely reflects the current portfolio management style of the strategy. Performance is not a consideration in the selection of the representative portfolio. The characteristics of the representative portfolio shown may differ from other accounts in the composite. Information regarding the representative portfolio and the other accounts in the composite are available upon request. Statements in these materials should not be considered investment advice. References, either general or specific, to securities and/or issuers in the materials are for illustrative purposes only and are not intended to be, and should not be interpreted as, recommendation to purchase or sell such securities. Employees and/or clients of Western Asset may have a position in the securities or issuers mentioned.
These materials are not intended to provide, and should not be relied on for, accounting, legal, tax, investment or other advice. The recipient should consult its own counsel, accountant, investment, tax, and any other advisers for this advice, including economic risks and merits, related to making an investment with Western Asset. The recipient is responsible for observing the applicable laws and regulations of their country of residence.
Founded in 1971, Western Asset Management Company is a global fixed-income investment manager with offices in Pasadena, New York, London, Singapore, Tokyo, Melbourne, São Paulo, Hong Kong, and Zürich. Western Asset is a wholly owned subsidiary of Franklin Resources, Inc. but operates autonomously. Western Asset is comprised of six legal entities across the globe, each with distinct regional registrations: Western Asset Management Company, LLC, a registered Investment Adviser with the Securities and Exchange Commission; Western Asset Management Company Ltda. is regulated by Comissão de Valores Mobiliários; Western Asset Management Company Pty Ltd ABN 41 117 767 923 is the holder of the Australian Financial Services License 303160; Western Asset Management Company Pte. Ltd. Co. Reg. No. 200007692R is a holder of a Capital Markets Services License for fund management and regulated by the Monetary Authority of Singapore; Western Asset Management Company Ltd, a registered Financial Instruments Business Operator and regulated by the Financial Services Agency of Japan; and Western Asset Management Company Limited is authorised and regulated by the Financial Conduct Authority ("FCA") (FRN 145930). This communication is intended for distribution to Professional Clients only if deemed to be a financial promotion in the UK as defined by the FCA. This communication may also be intended for certain EEA countries where Western Asset has been granted permission to do so. For the current list of the approved EEA countries please contact Western Asset at +44 (0)20 7422 3000.