skip navigation
Western Asset Management Company
Blog

Stay up to date on timely topics and market events. Subscribe to our Blog now.

MARKETS
November 18, 2025

Weekly Municipal Monitor—Election Outcomes

By Sam Weitzman

Stay up to date on timely topics and market events. Subscribe to our Blog now.

Macros, Markets and Munis

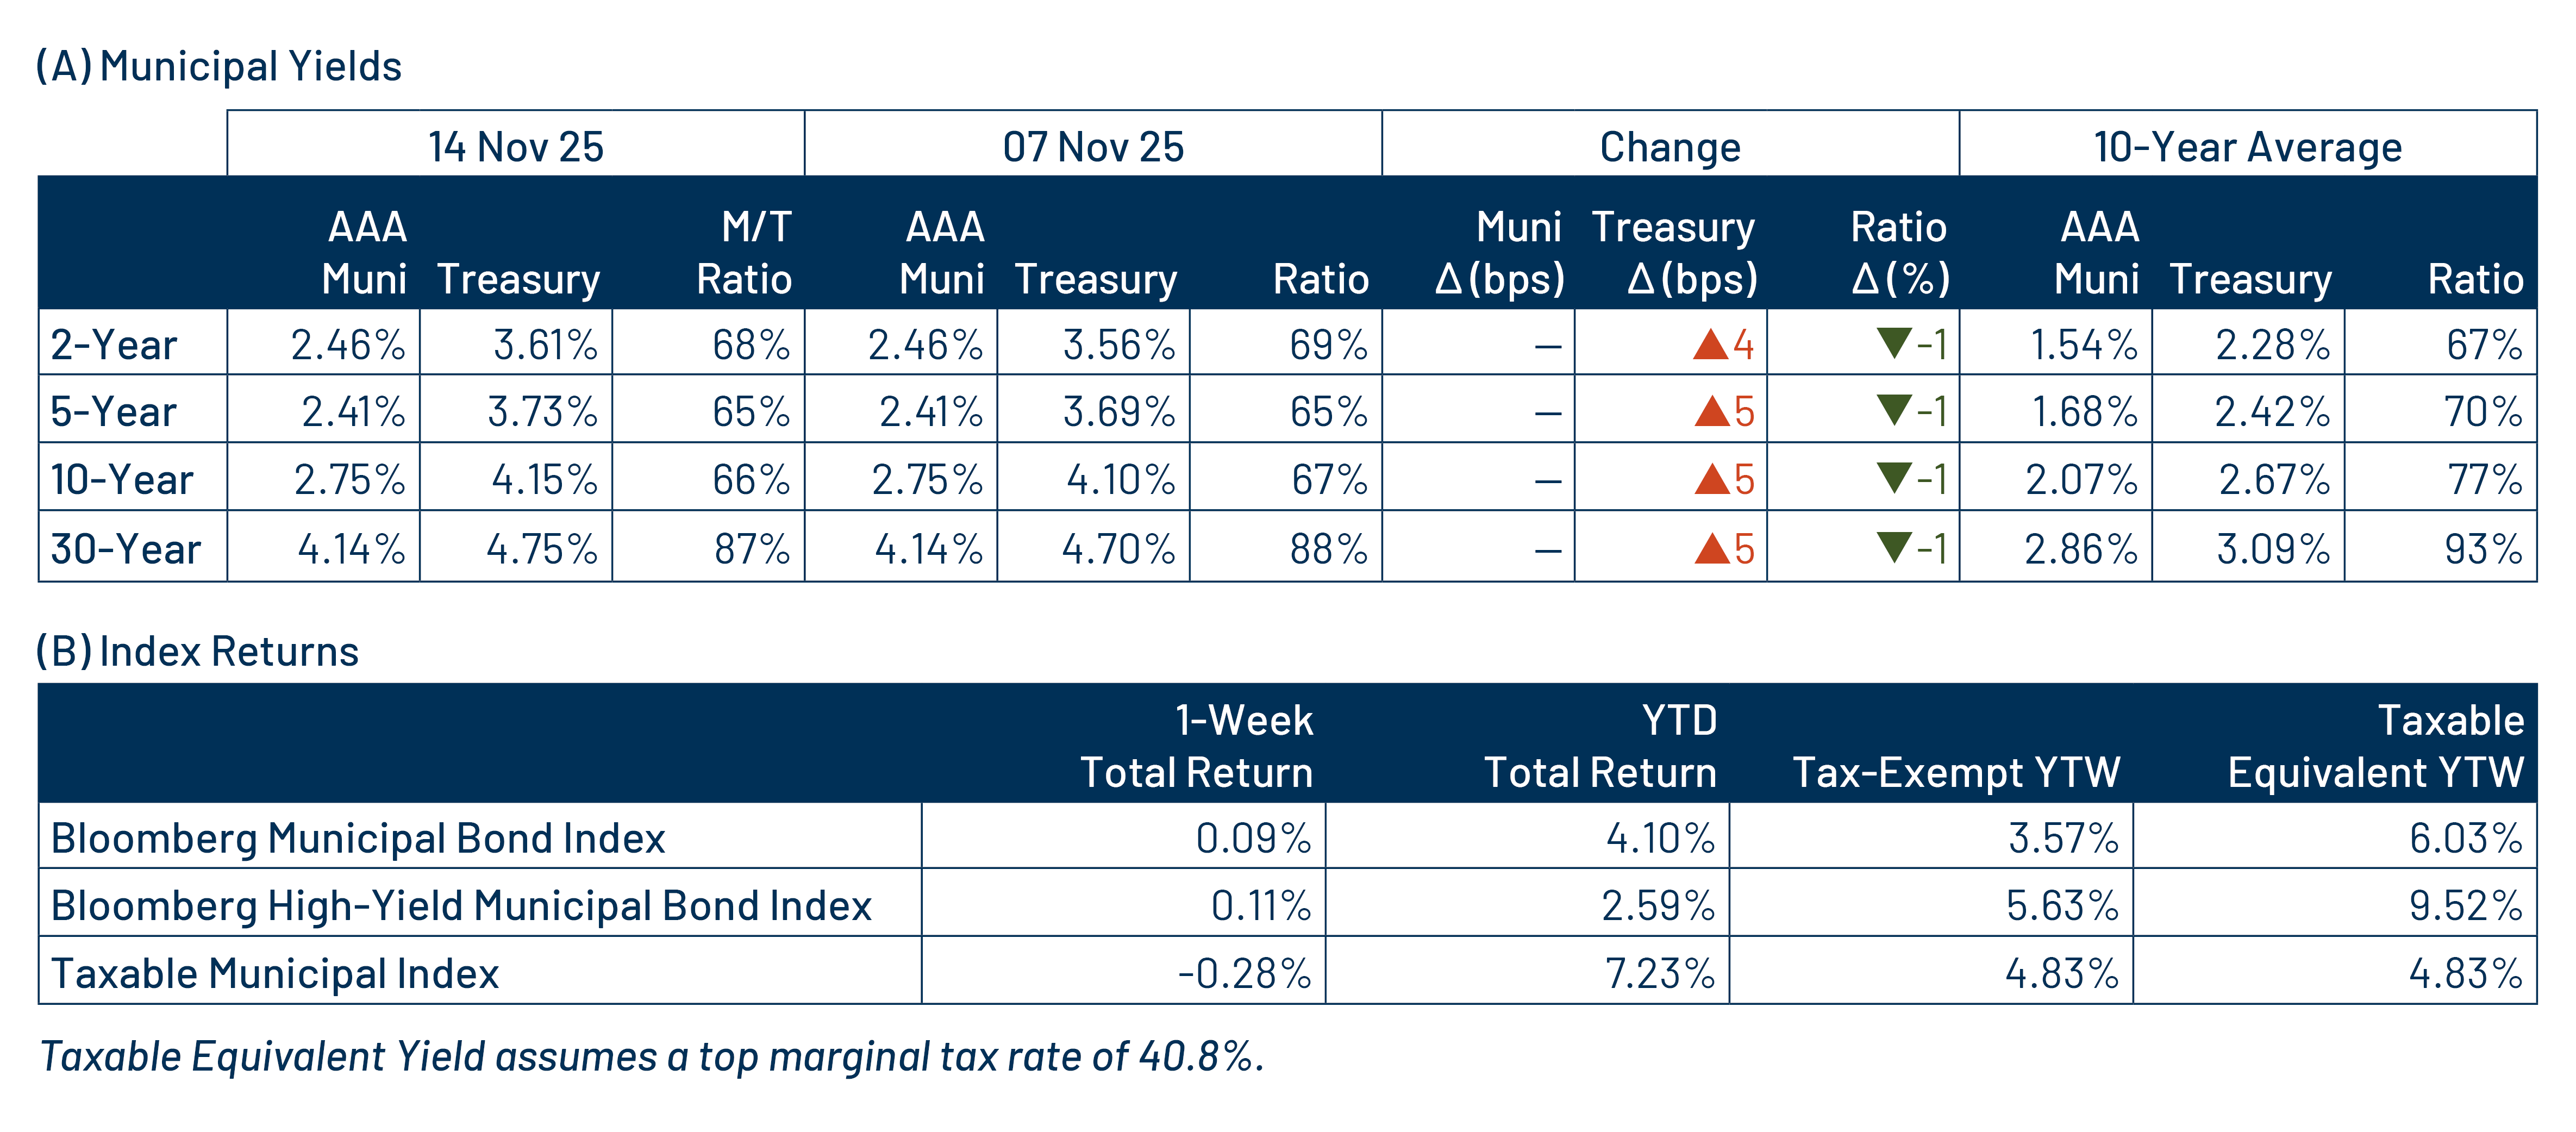
Munis posted positive returns last week and outperformed Treasuries. The Treasury curve sold off during the week, moving 4-5 basis points (bps) higher across the curve. The high-grade muni curve outperformed, with yields remaining unchanged across the curve. Muni technicals were supported by ongoing demand. Meanwhile, economic data releases remained limited through the tail end of the government shutdown. Markets were focused on hawkish commentary from the Federal Reserve (Fed), which contributed to fixed-income and equity market volatility. This week we touch on election outcomes and their impact on the municipal market.

Demand Remained Elevated as Supply Surpassed 2024 Record Levels

Fund Flows ($405 million of net inflows): During the week ending November 12, weekly reporting municipal mutual funds recorded $405 million of net inflows, according to Lipper. Long-term funds recorded $17 million of inflows, intermediate funds recorded $212 million of inflows and the short-term category recorded $158 million of inflows. Last week’s inflows led year-to-date (YTD) inflows higher to $44 billion.

Supply (YTD supply of $516 billion; up 16% YoY): The muni market recorded $10 billion of new-issue supply last week, down 33% from the prior week’s level. YTD new-issue supply of $516 billion is 16% higher than the prior year (surpassing 2024 calendar-year levels), with tax-exempt issuance up 17% year-over-year (YoY) and taxable issuance up 5% YoY. This week’s calendar is expected to increase to $11 billion. The largest deals include $960 million Black Belt Energy and $688 million Newton, MA transactions.

This Week in Munis: Election Outcomes

The November 2025 off-year elections carried several implications for the muni bond market, primarily through local and state races, ballot measures on taxes and bond issuance, and potential shifts in fiscal policy.

New York City Mayoral Election
Following his surprise Democratic primary victory in June, Zohran Mamdani won the New York City mayoral election. The democratic socialist has contributed to headline-driven credit concerns, given the aggressive spending and debt policies outlined in his agenda, which proposes tax increases on high earners and corporations, higher debt levels to support affordable housing initiatives, rent freezes and increased childcare spending. Despite the headline-generating rhetoric, the mayor’s tax and debt authority are constrained by state controls, and many New York City debt liens offer strong bondholder protections.

As highlighted in prior blog posts, since the pandemic-driven market drawdown, New York municipal yields have traded wider than comparable national counterparts, a reversal from pre-pandemic trends when the higher in-state tax rates kept New York yields below national averages. Western Asset believes that additional volatility stemming from these headlines could create opportunities for New York taxpayers who can benefit from the tax-exempt income offered by New York securities.

Gubernatorial Elections
Both New Jersey and Virginia gubernatorial candidates won their respective elections, resulting in unified governments in each state. A unified government can enable more decisive and predictable budgeting, including the ability to cut taxes or expenses, raise revenues to fund spending initiatives and develop consistent long-term plans. However, with fewer checks and balances, it will be important to monitor the long-term sustainability of any near-term policy changes.

Tax Policy
In Colorado, voters approved a 4% income tax increase on individuals earning $300,000 and above to generate an estimated $95 million in additional school funding, primarily to support free meals for all public school children. Meanwhile, Texas increased the homestead tax exemption from $100,000 to $140,000 of a property’s market value, reducing state property tax revenues.

Summary
Western Asset does not anticipate significant near-term credit implications resulting from the current election cycle. However, even if not implemented immediately, growing sentiment for higher tax rates remains worth monitoring. While the potential for out-migration and credit deterioration exists, the strength and diversity of metropolitan economies, along with balanced budget requirements, often provide greater credit stability than headlines suggest. Potential headline-driven volatility may create attractive near-term entry points for taxpayers seeking higher levels of long-term tax-exempt income, particularly for those in jurisdictions facing potentially higher tax rates, where the relative value of tax-exempt income would improve under a higher-rate regime.

Municipal Credit Curves and Relative Value

Exhibit 1: Muni Credit Curves
Muni Credit Curves
Source: Bloomberg, Western Asset. As of 14 Nov 25. Bloomberg Valuation Service (BVAL) Municipal Credit Indices (AAA, AA, A, BBB, respectively) and US Sovereign Curves. Taxable-Equivalent Muni Credit Curves consider the top marginal effective tax rate of 40.8%. AA Muni is represented by the US General Obligation AA Muni BVAL Yield Curve. The BVAL curve is populated with pricing from uninsured AA General Obligation bonds. A Muni is represented by the US General Obligation A Muni BVAL Yield Curve. The BVAL curve is populated with pricing from uninsured A General Obligation bonds. BBB Muni is represented by the US General Obligation BBB Muni BVAL Yield Curve. The BVAL curve is populated with pricing from uninsured BBB General Obligation bonds. Indices are unmanaged and one cannot directly invest in them. They do not include fees, expenses or sales charges. Past performance is not an indicator or a guarantee of future results. Select the image to expand the view.
Exhibit 2: Taxable-Equivalent Muni Credit Curves
Taxable-Equivalent Muni Credit Curves
Source: Bloomberg, Western Asset. As of 14 Nov 25. Bloomberg Valuation Service (BVAL) Municipal Credit Indices (AAA, AA, A, BBB, respectively) and US Sovereign Curves. Taxable-Equivalent Muni Credit Curves consider the top marginal effective tax rate of 40.8%. AA Muni is represented by the US General Obligation AA Muni BVAL Yield Curve. The BVAL curve is populated with pricing from uninsured AA General Obligation bonds. A Muni is represented by the US General Obligation A Muni BVAL Yield Curve. The BVAL curve is populated with pricing from uninsured A General Obligation bonds. BBB Muni is represented by the US General Obligation BBB Muni BVAL Yield Curve. The BVAL curve is populated with pricing from uninsured BBB General Obligation bonds. Indices are unmanaged and one cannot directly invest in them. They do not include fees, expenses or sales charges. Past performance is not an indicator or a guarantee of future results. Select the image to expand the view.
Exhibit 3: AAA Munis vs. Treasuries
AAA Munis vs. Treasuries
Source: Muni Yields: Thomson Reuters MMD, Treasury Yields: Bloomberg. As of 14 Nov 25. Past performance is not a guarantee of future results. It is not possible to invest directly in an index. Select the image to expand the view.
Exhibit 4: Tax-Exempt and Taxable Muni Valuations
Tax-Exempt and Taxable Muni Valuations
Source: Bloomberg, Western Asset. As of 14 Nov 25. Yield-to-worst (YTW) is the lowest potential yield that can be received on a bond without the issuer actually defaulting. AAA, AA, A, BBB Corporate Indices; After-Tax Yield assumes a top effective tax rate of 40.8%. Taxable Muni Index Corporate comparable used is the Global Corporate Aggregate (ex. BBB) to better align credit quality and duration. Select the image to expand the view.

Western Asset Key Themes for Muni Investors

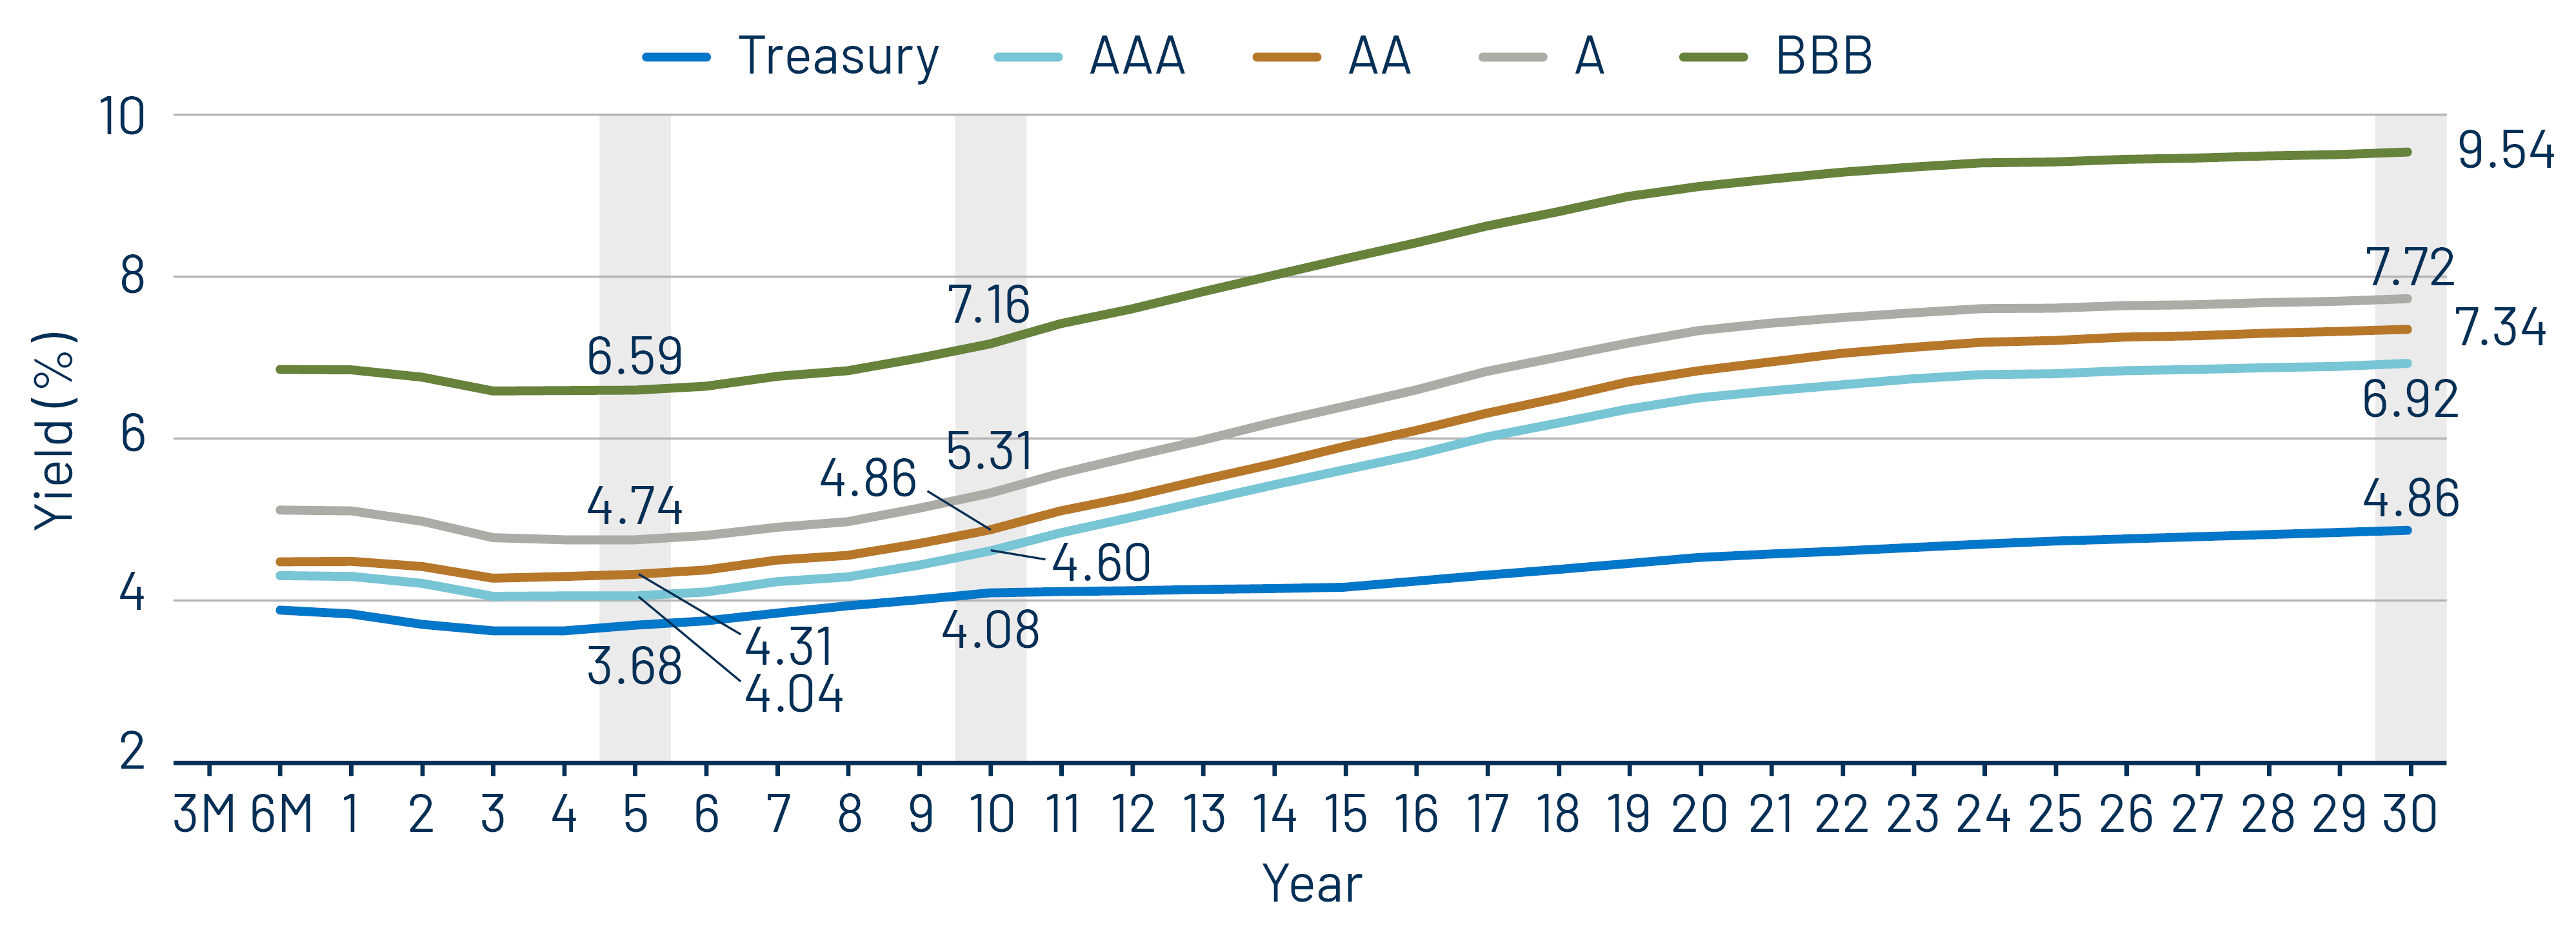
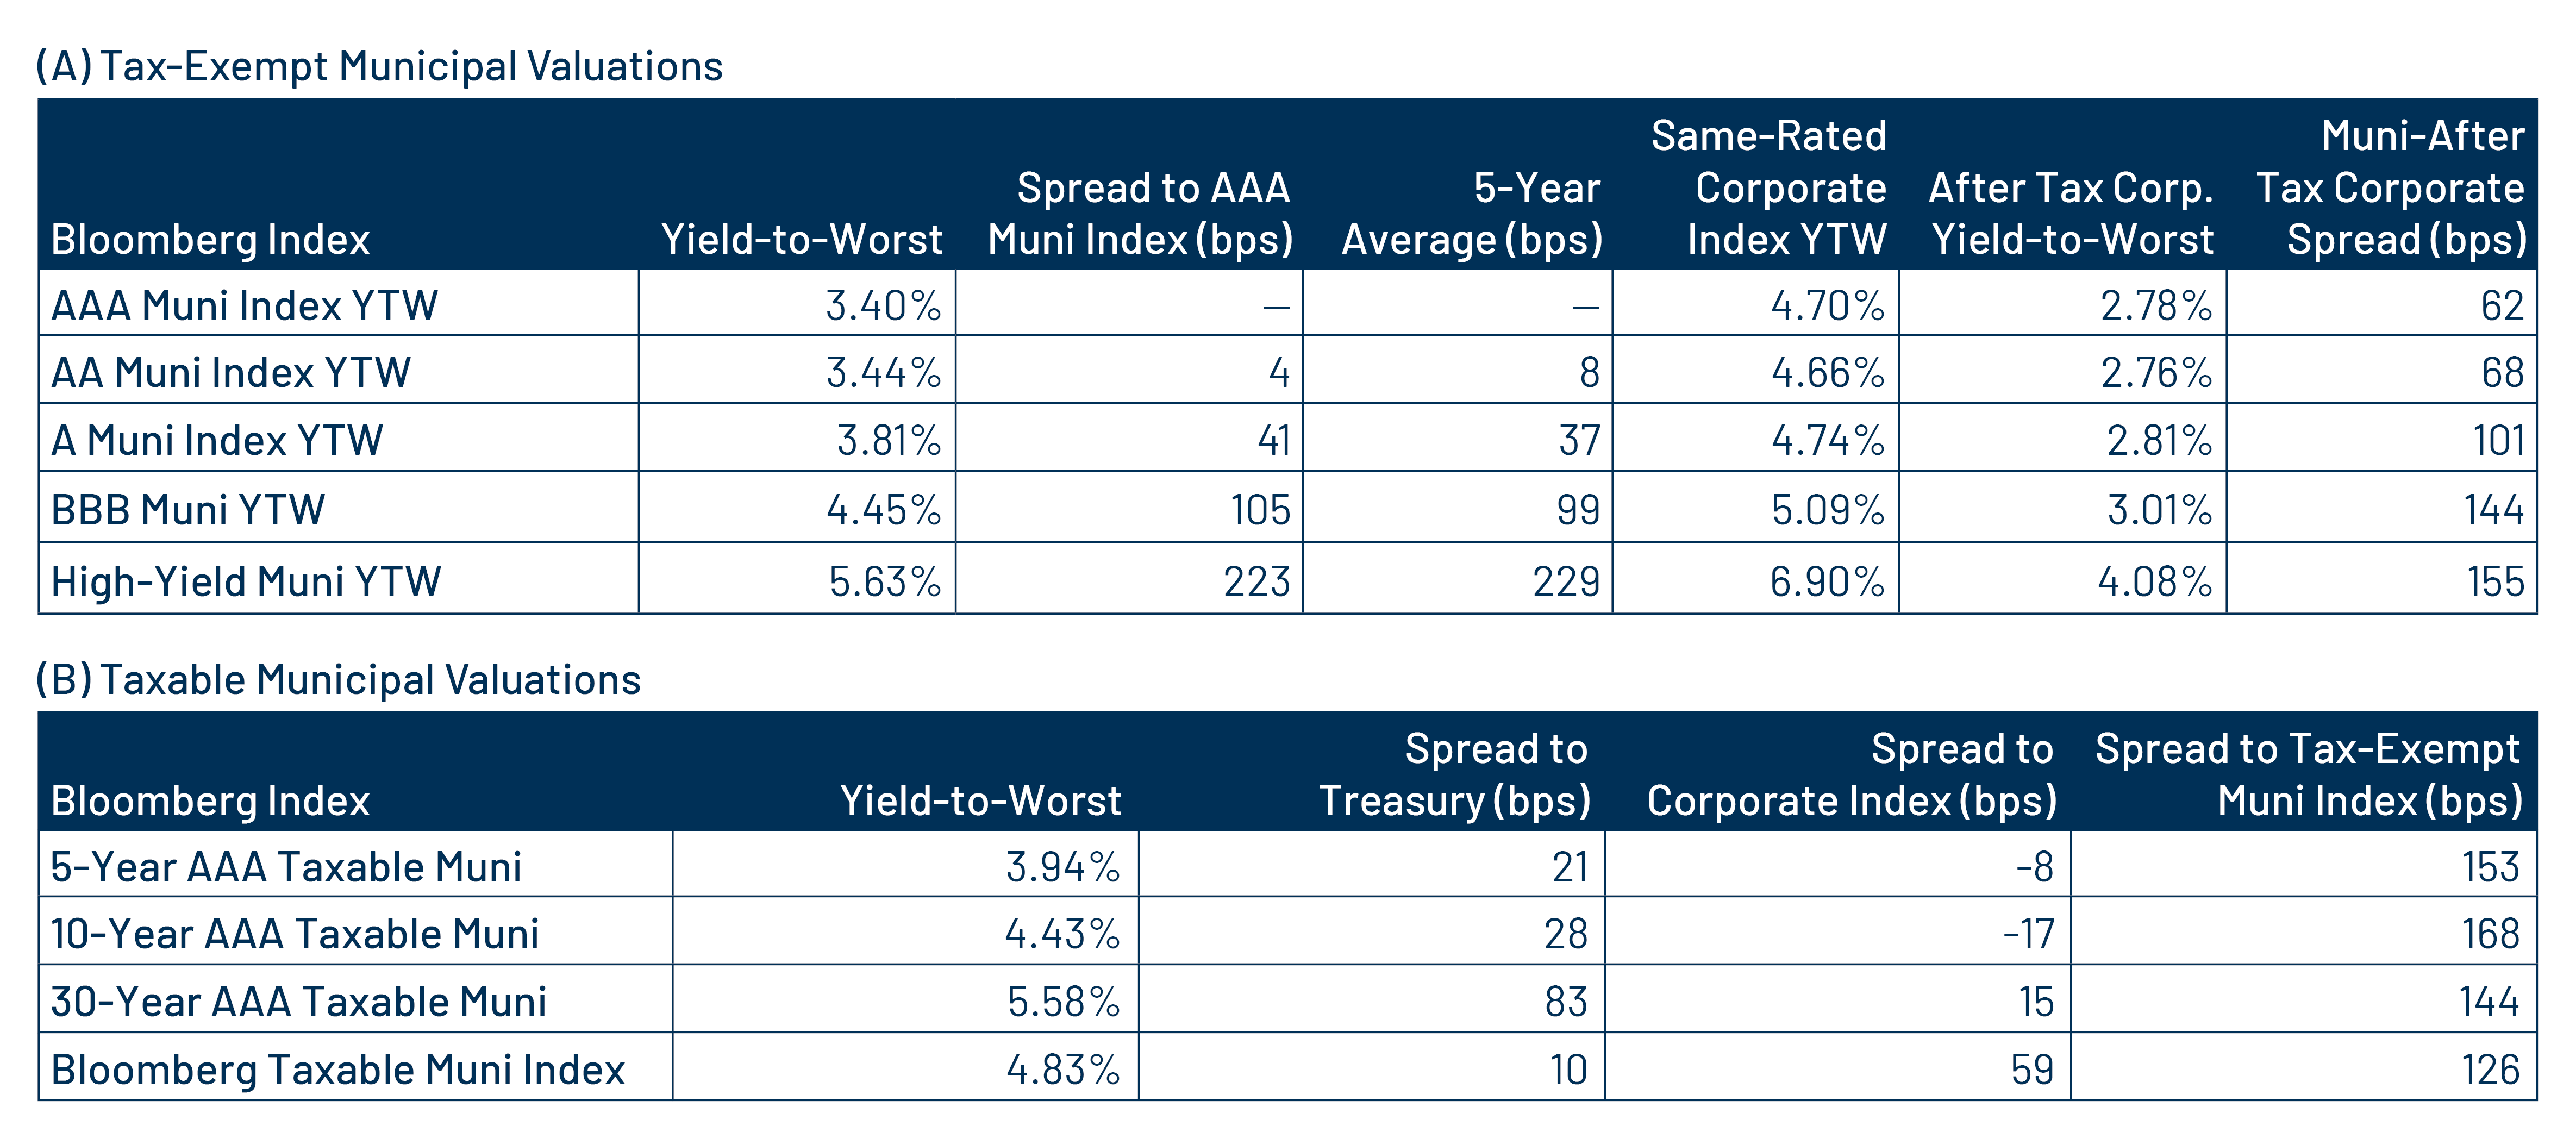
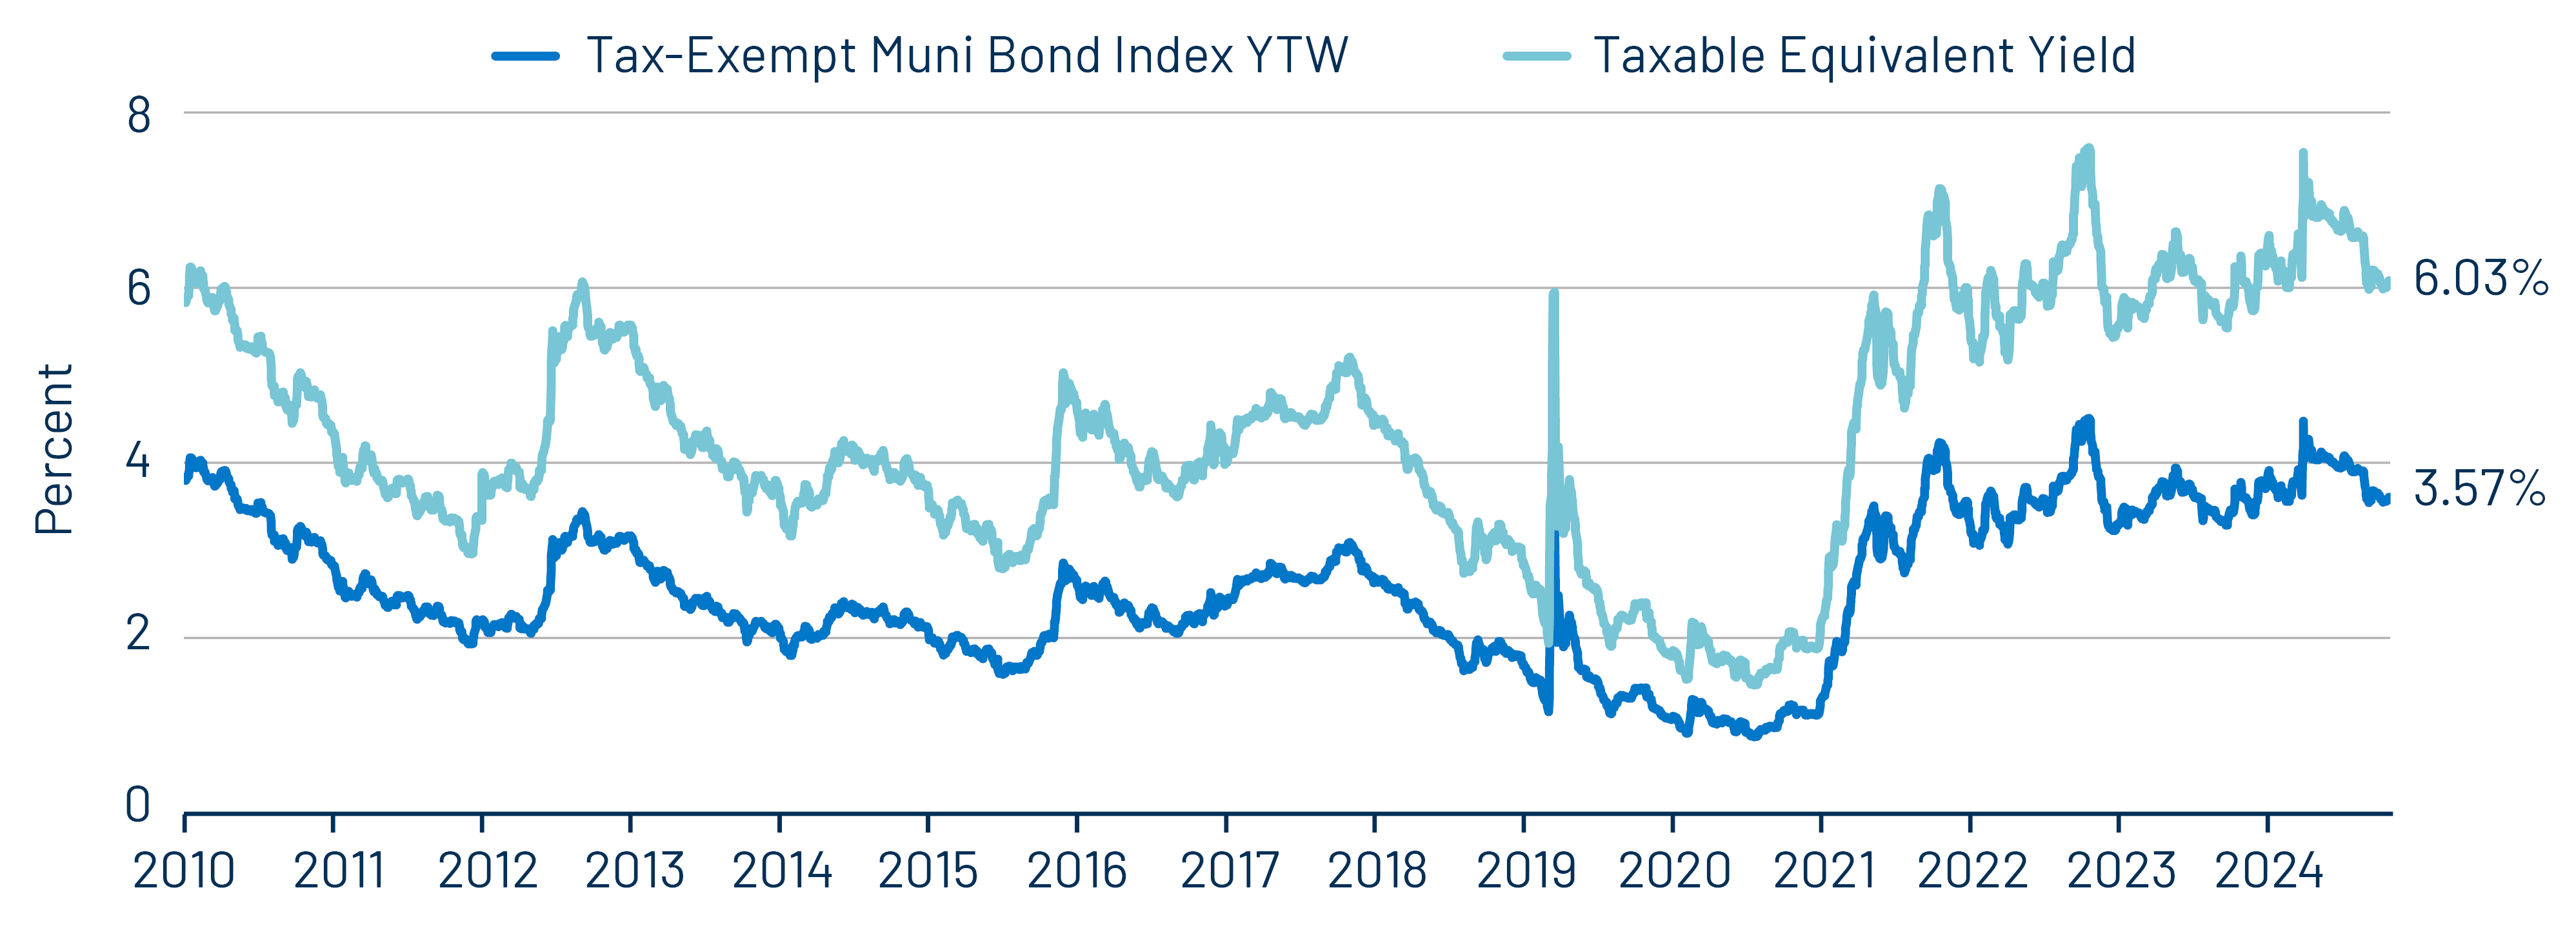
Theme #1: Municipal taxable-equivalent yields and income opportunities remain near decade-high levels.

Exhibit 5: Muni and Taxable-Equivalent Muni Yield-to-Worst
Muni and Taxable-Equivalent Muni Yield-to-Worst
Source: Bloomberg, Western Asset. As of 14 Nov 25. Bloomberg Municipal Bond Index yield considering highest marginal tax rate of 40.8%. Indexes are unmanaged and one cannot directly invest in them. They do not include fees, expenses or sales charges. Past performance is not an indicator or a guarantee of future results. Select the image to expand the view.

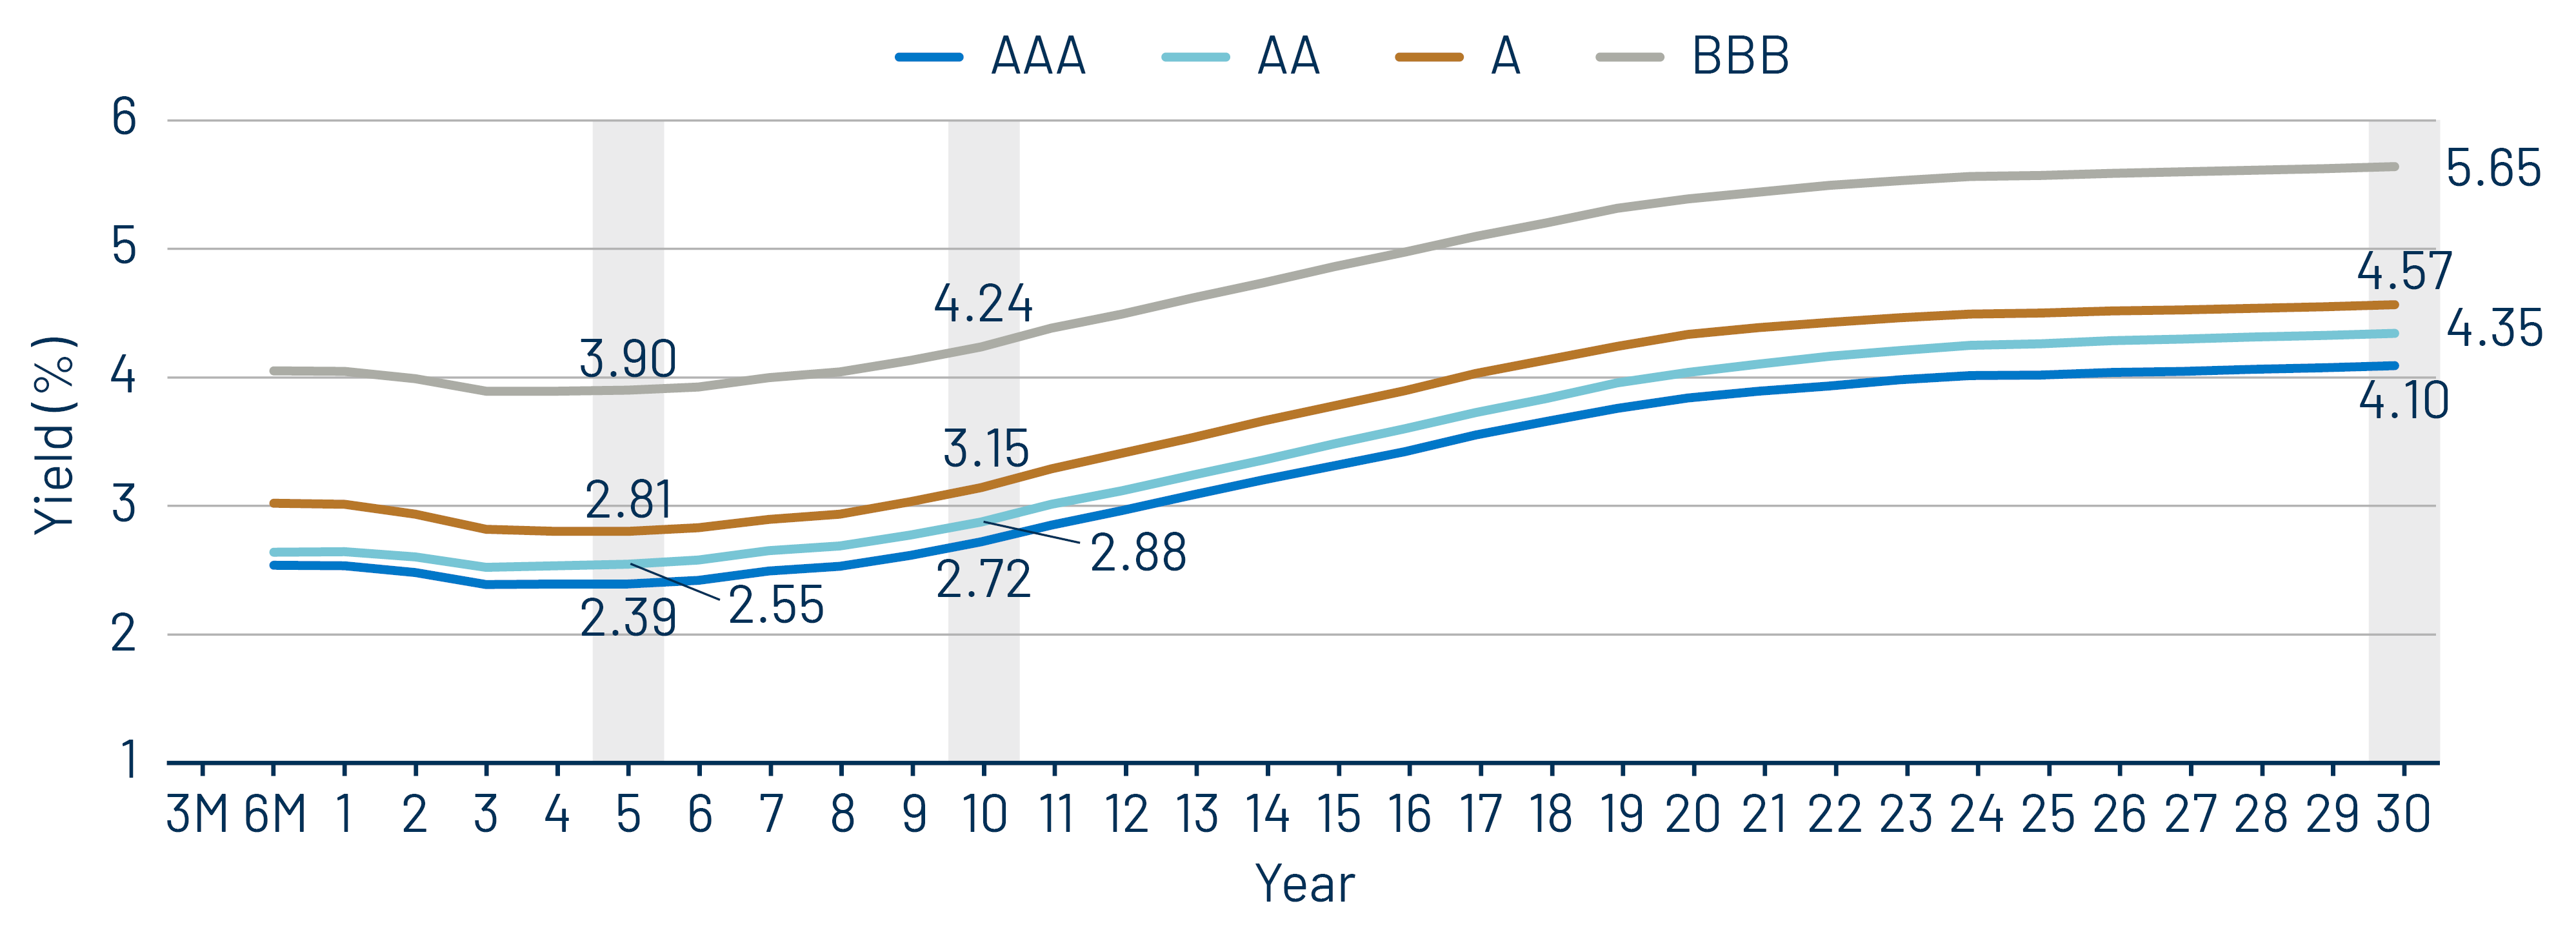
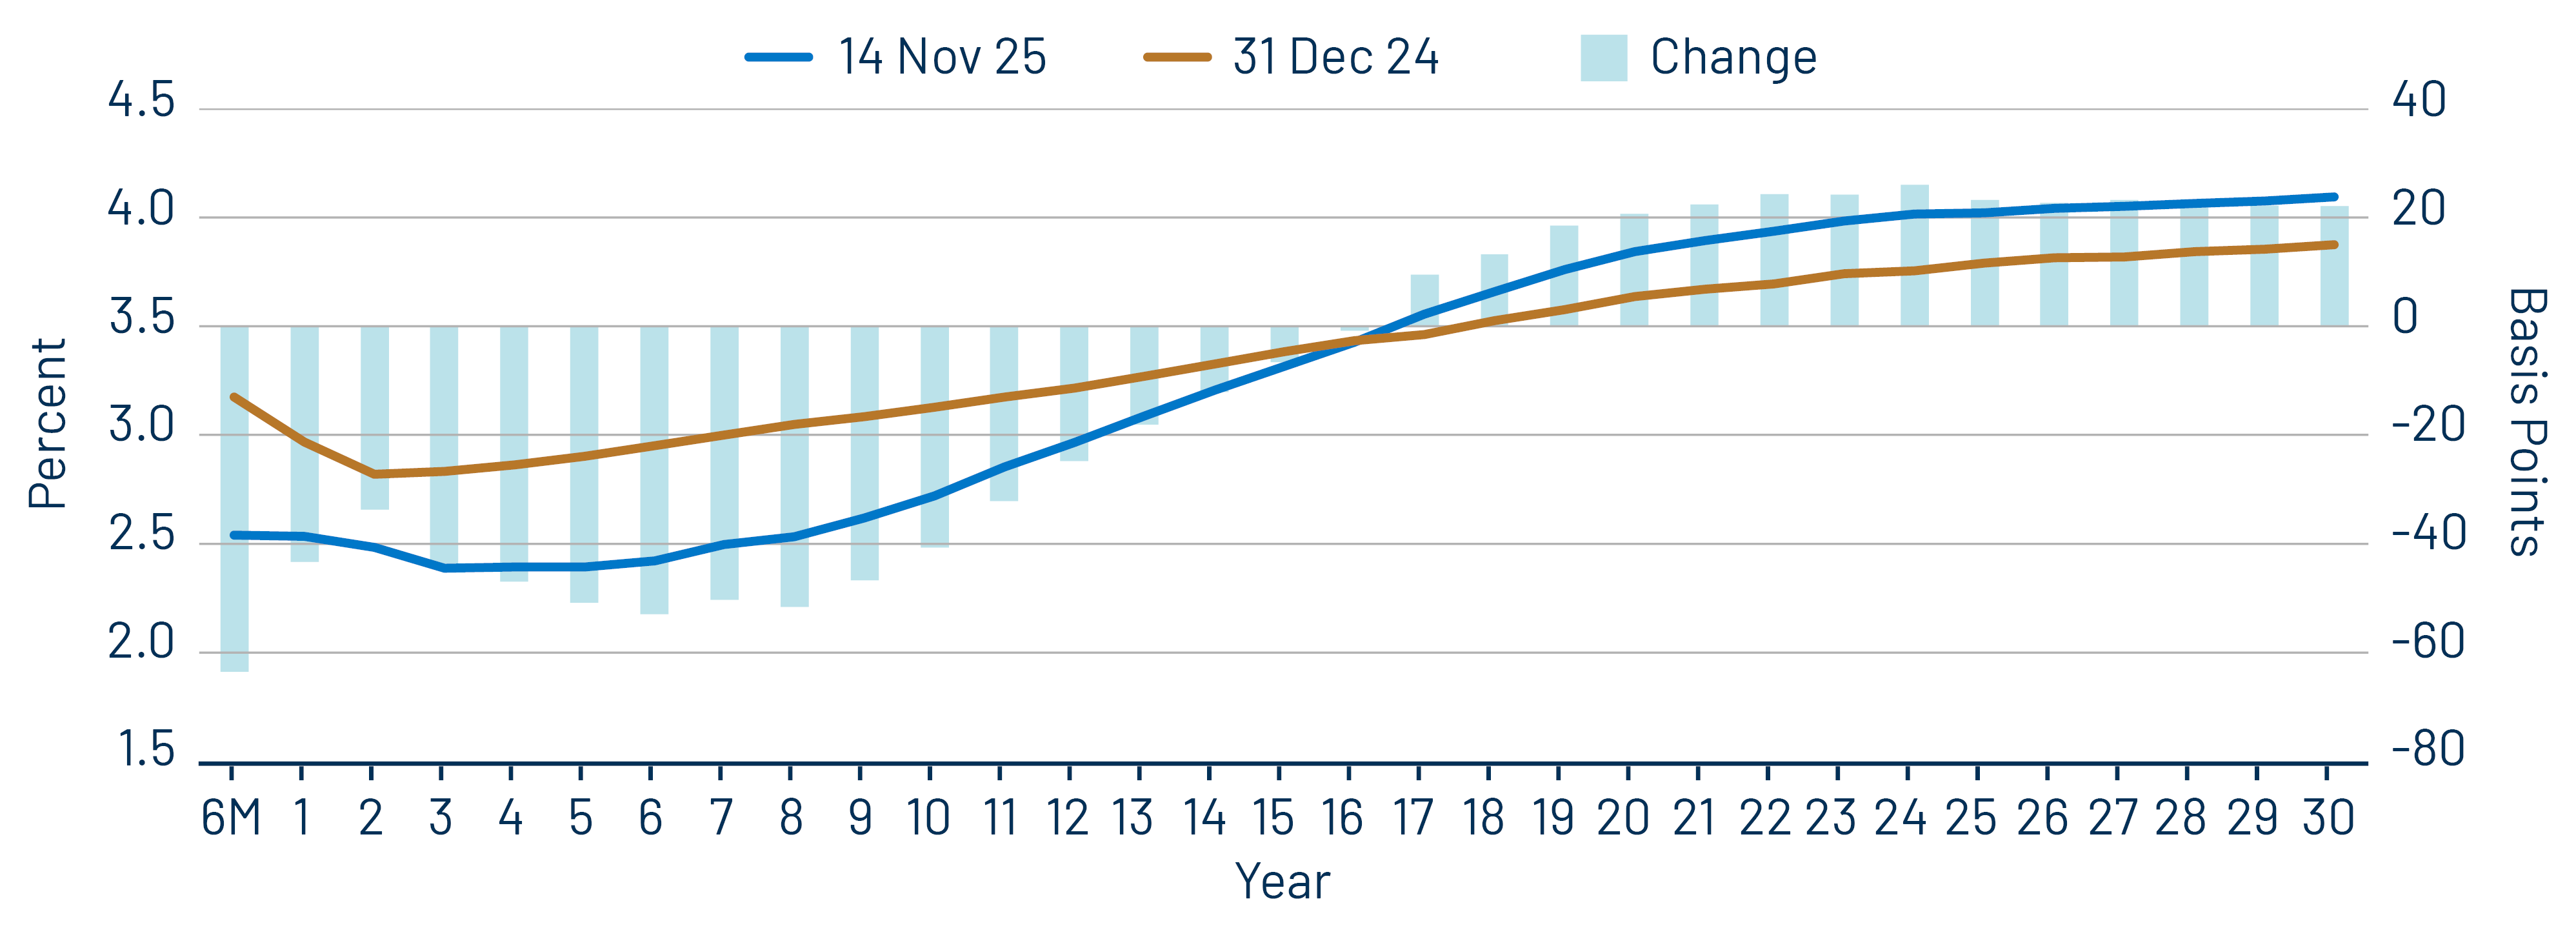
Theme #2: The AAA muni curve has steepened this year, offering better value in intermediate and longer maturities.

Exhibit 6: AAA Municipal vs. Treasury Yield Curves
AAA Municipal vs. Treasury Yield Curves
Source: Bloomberg, Western Asset. As of 14 Nov 25. Bloomberg Valuation Service (BVAL) AAA Muni Curve and US On-/Off-the-Run Sovereign Curve. Indexes are unmanaged and one cannot directly invest in them. They do not include fees, expenses or sales charges. Past performance is not an indicator or a guarantee of future results. Select the image to expand the view.

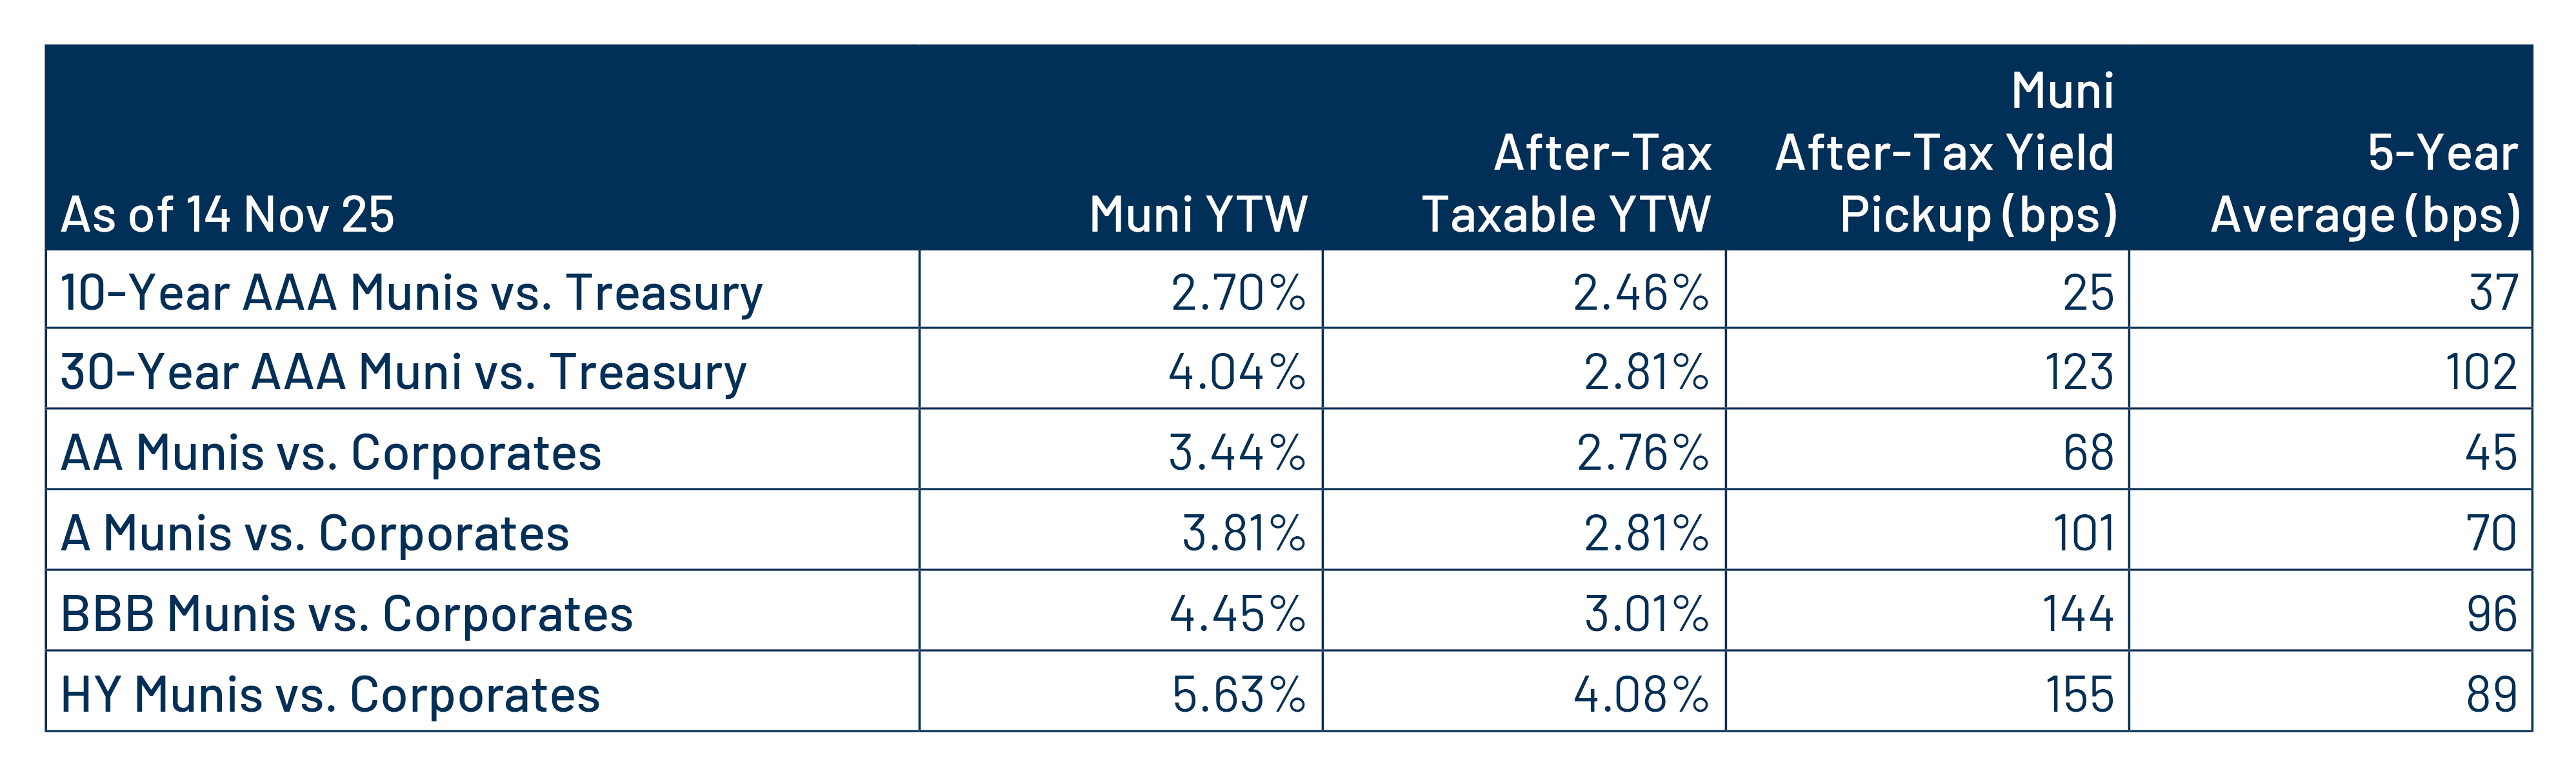
Theme #3: Munis offer attractive after-tax yield compared to taxable alternatives.

Exhibit 7: Municipal vs. Taxable Fixed-Income Yields by Quality
Municipal vs. Taxable Fixed-Income Yields by Quality
Source: Western Asset, Bloomberg. As of 14 Nov 25. 10- and 30-Year comparison reflects Bloomberg Valuation Service (BVAL) AAA Muni Curve and US On-/Off-the-Run Sovereign Curve. AA Muni reflects the Bloomberg AA Muni Bond Index. A Muni reflects the Bloomberg A Muni Bond Index. BBB Muni reflects the Bloomberg BBB Muni Bond Index. HY Muni reflects the Bloomberg High Yield Muni Bond Index. AA Corp reflects the Bloomberg AA Corporate Bond Index. A Corp reflects the Bloomberg A Corporate Bond Index. BBB Corp reflects the Bloomberg BBB Corporate Bond Index. After-tax yield considers the top marginal tax rate of 40.8%. Indexes are unmanaged and one cannot directly invest in them. They do not include fees, expenses or sales charges. Past performance is not an indicator or a guarantee of future results. Select the image to expand the view.

© Western Asset Management Company, LLC 2025. The information contained in these materials ("the materials") is intended for the exclusive use of the designated recipient ("the recipient"). This information is proprietary and confidential and may contain commercially sensitive information, and may not be copied, reproduced or republished, in whole or in part, without the prior written consent of Western Asset Management Company ("Western Asset").
Past performance does not predict future returns. These materials should not be deemed to be a prediction or projection of future performance. These materials are intended for investment professionals including professional clients, eligible counterparties, and qualified investors only.
These materials have been produced for illustrative and informational purposes only. These materials contain Western Asset's opinions and beliefs as of the date designated on the materials; these views are subject to change and may not reflect real-time market developments and investment views.
Third party data may be used throughout the materials, and this data is believed to be accurate to the best of Western Asset's knowledge at the time of publication, but cannot be guaranteed. These materials may also contain strategy or product awards or rankings from independent third parties or industry publications which are based on unbiased quantitative and/or qualitative information determined independently by each third party or publication. In some cases, Western Asset may subscribe to these third party's standard industry services or publications. These standard subscriptions and services are available to all asset managers and do not influence rankings or awards in any way.
Investment strategies or products discussed herein may involve a high degree of risk, including the loss of some or all capital. Investments in any products or strategies described in these materials may be volatile, and investors should have the financial ability and willingness to accept such risks.
Unless otherwise noted, investment performance contained in these materials is reflective of a strategy composite. All other strategy data and information included in these materials reflects a representative portfolio which is an account in the composite that Western Asset believes most closely reflects the current portfolio management style of the strategy. Performance is not a consideration in the selection of the representative portfolio. The characteristics of the representative portfolio shown may differ from other accounts in the composite. Information regarding the representative portfolio and the other accounts in the composite are available upon request. Statements in these materials should not be considered investment advice. References, either general or specific, to securities and/or issuers in the materials are for illustrative purposes only and are not intended to be, and should not be interpreted as, recommendation to purchase or sell such securities. Employees and/or clients of Western Asset may have a position in the securities or issuers mentioned.
These materials are not intended to provide, and should not be relied on for, accounting, legal, tax, investment or other advice. The recipient should consult its own counsel, accountant, investment, tax, and any other advisers for this advice, including economic risks and merits, related to making an investment with Western Asset. The recipient is responsible for observing the applicable laws and regulations of their country of residence.
Founded in 1971, Western Asset Management Company is a global fixed-income investment manager with offices in Pasadena, New York, London, Singapore, Tokyo, Melbourne, São Paulo, Hong Kong, and Zürich. Western Asset is a wholly owned subsidiary of Franklin Resources, Inc. but operates autonomously. Western Asset is comprised of six legal entities across the globe, each with distinct regional registrations: Western Asset Management Company, LLC, a registered Investment Adviser with the Securities and Exchange Commission; Western Asset Management Company Ltda. is regulated by Comissão de Valores Mobiliários; Western Asset Management Company Pty Ltd ABN 41 117 767 923 is the holder of the Australian Financial Services License 303160; Western Asset Management Company Pte. Ltd. Co. Reg. No. 200007692R is a holder of a Capital Markets Services License for fund management and regulated by the Monetary Authority of Singapore; Western Asset Management Company Ltd, a registered Financial Instruments Business Operator and regulated by the Financial Services Agency of Japan; and Western Asset Management Company Limited is authorised and regulated by the Financial Conduct Authority ("FCA") (FRN 145930). This communication is intended for distribution to Professional Clients only if deemed to be a financial promotion in the UK as defined by the FCA. This communication may also be intended for certain EEA countries where Western Asset has been granted permission to do so. For the current list of the approved EEA countries please contact Western Asset at +44 (0)20 7422 3000.