skip navigation
Western Asset Management Company
Blog

Stay up to date on timely topics and market events. Subscribe to our Blog now.

MARKETS
December 16, 2025

Weekly Municipal Monitor—Demand Rebounds, with Positive Prospects Ahead

By Sam Weitzman

Stay up to date on timely topics and market events. Subscribe to our Blog now.

Macros, Markets and Munis

Municipals generally posted negative returns last week, in line with the performance of most US fixed-income sectors as markets were focused on the Federal Reserve (Fed) rate cut. While the Federal Open Market Committee’s decision to reduce the fed funds rate by 25 basis points was not a surprise, the number of dissents as well as the forward-looking dot plot signaled greater uncertainty ahead. While moving lower in the front end, Treasuries generally moved higher in intermediate and long maturities. Municipals outperformed, with yields moving higher in longer maturities to a lesser magnitude. This week we touch on the steady demand for munis, which has mostly rebounded from the prior outflow cycle.

Supply Remained Elevated Along with Persistent Demand

Fund Flows ($16 million of net inflows): During the week ending December 10, weekly reporting municipal mutual funds recorded $16 million of net inflows, according to Lipper. Long-term funds recorded $158 million of outflows, while intermediate funds recorded $5 million of inflows and the short-term and short/intermediate categories recorded $169 million of inflows. Last week’s inflows led year-to-date (YTD) inflows higher to $50 billion.

Supply (YTD supply of $564 billion; up 17% YoY): The muni market recorded $13 billion of new-issue supply last week, down 23% from the prior week’s level. YTD new-issue supply of $565 billion is 17% higher than the prior year, with tax-exempt issuance up 19% year-over-year (YoY) and taxable issuance in line with the prior year’s level. This week’s calendar is expected to decline to $4 billion. The largest deals include $2.0 billion New York Transitional Finance Authority and $750 million Kentucky Public Energy (Morgan Stanley Gas Prepay) transactions.

This Week in Munis: Demand Rebounds, with Positive Prospects Ahead

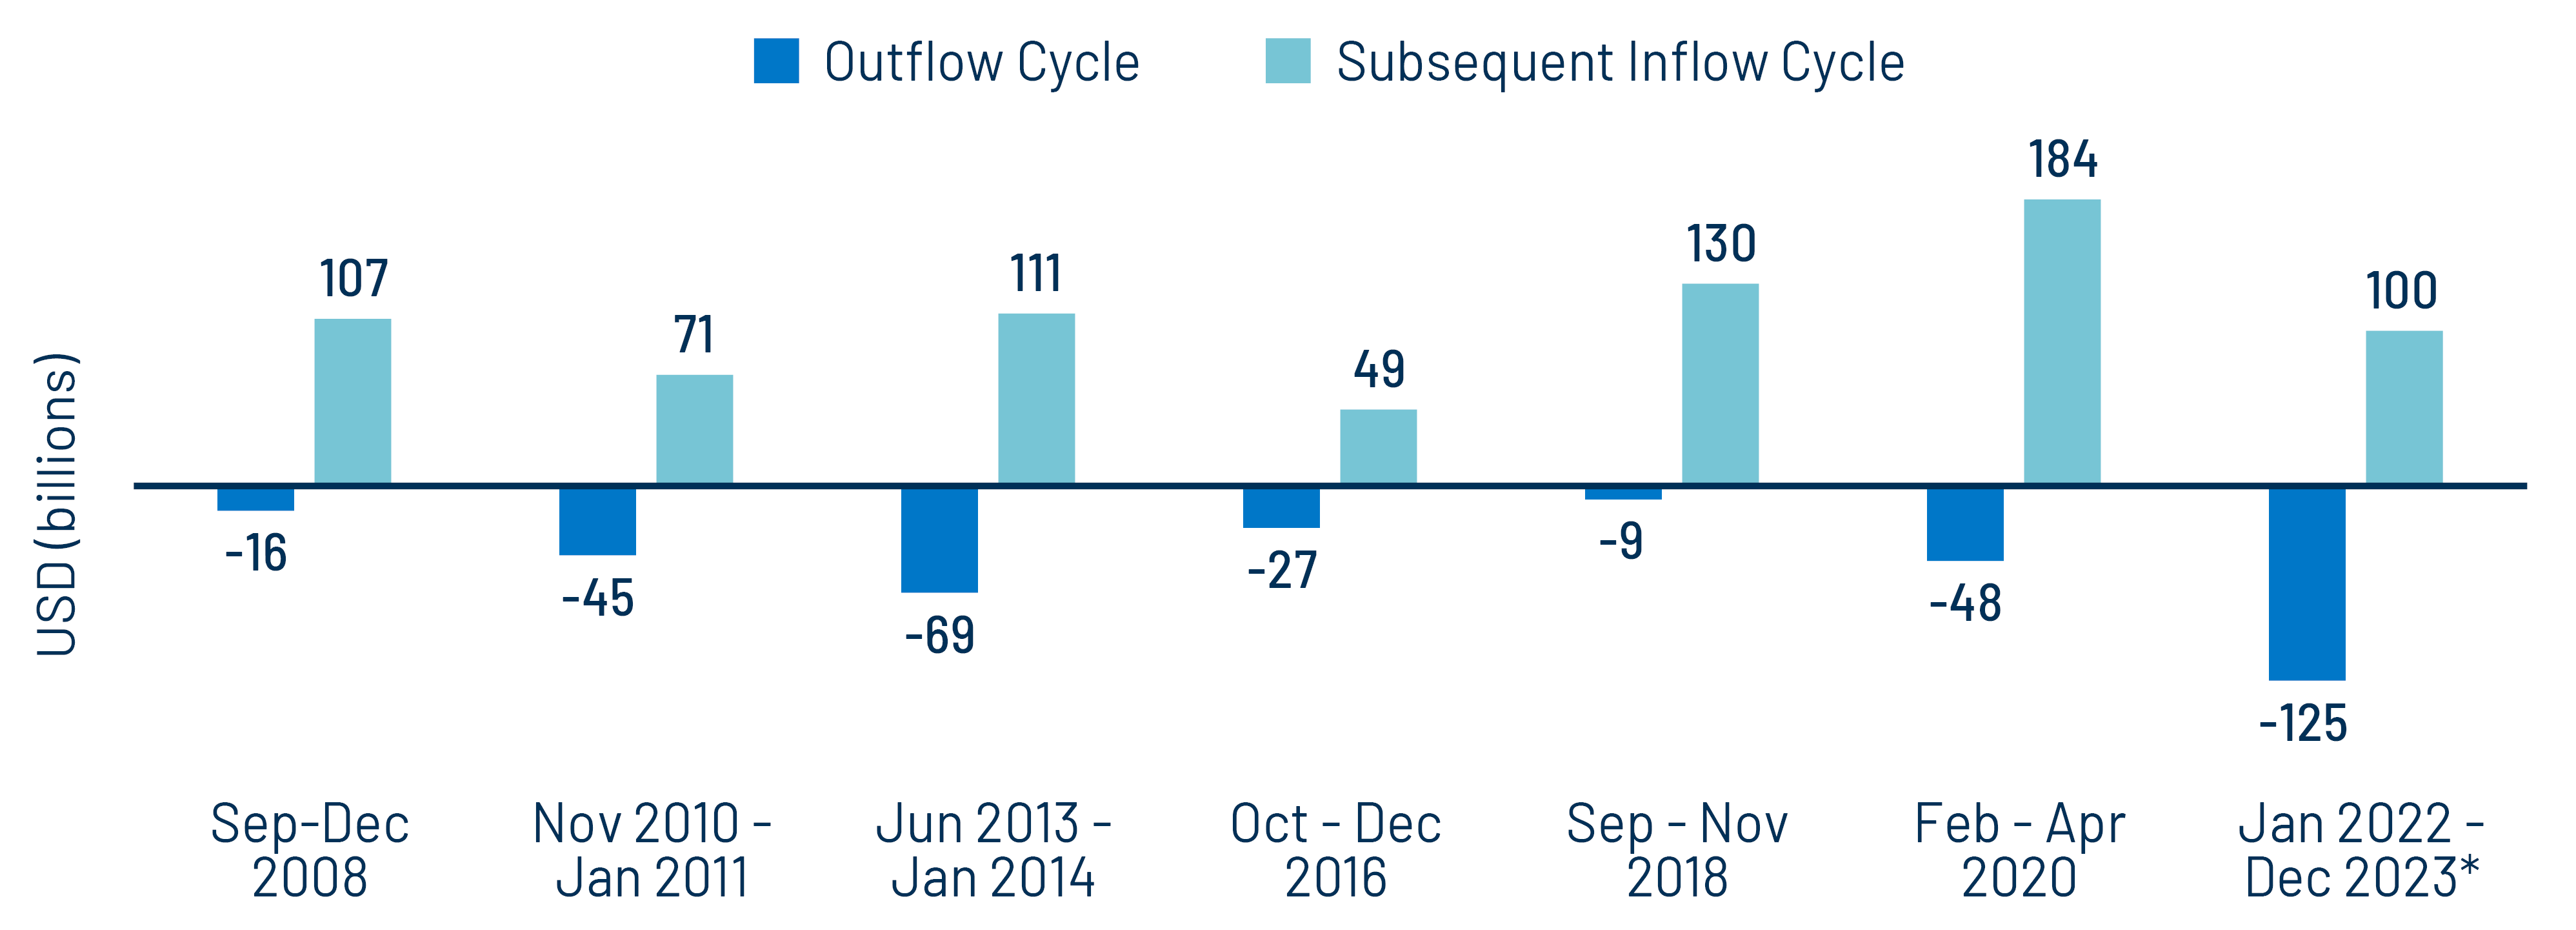
Muni mutual funds weathered a record outflow cycle in 2022 through 2023 as the Fed increased interest rates, with over $125 billion of cash divested from muni funds according to ICI. In 2024, demand slowly returned to the muni asset class, as funds recorded $46 billion of net inflows last year with the conclusion of the hiking cycle. This positive demand has extended into 2025, with muni funds recording $50 billion of net inflows YTD. The inflows recorded this year extend the net inflow streak to $100 billion, which still falls approximately 20% short of the outflows that left muni funds in 2022 and 2023. During the six prior muni fund outflow cycles since the global financial crisis, subsequent inflow cycles traditionally exceeded prior outflow cycles by an average of $73 billion. The fact that the current two-year inflow cycle has not yet surpassed the record outflow cycle observed in 2022-2023 is a positive signal for potential future demand.

Exhibit 1: Larger Inflow Cycles Historically Followed Outflow Cycles
Larger Inflow Cycles Historically Followed Outflow Cycles
Source: ICI, Western Asset. Outflow Cycles defined as 9/17/08-12/31/08; 11/3/10-01/14/11;03/07/13-01/08/14;10/26/16-12/01/16; 09/19/18-11/06/18; 02/26/20-04/08/20; 01/19/22-12/13/23. Subsequent inflow streak through 12/05/25. Select the image to expand the view.

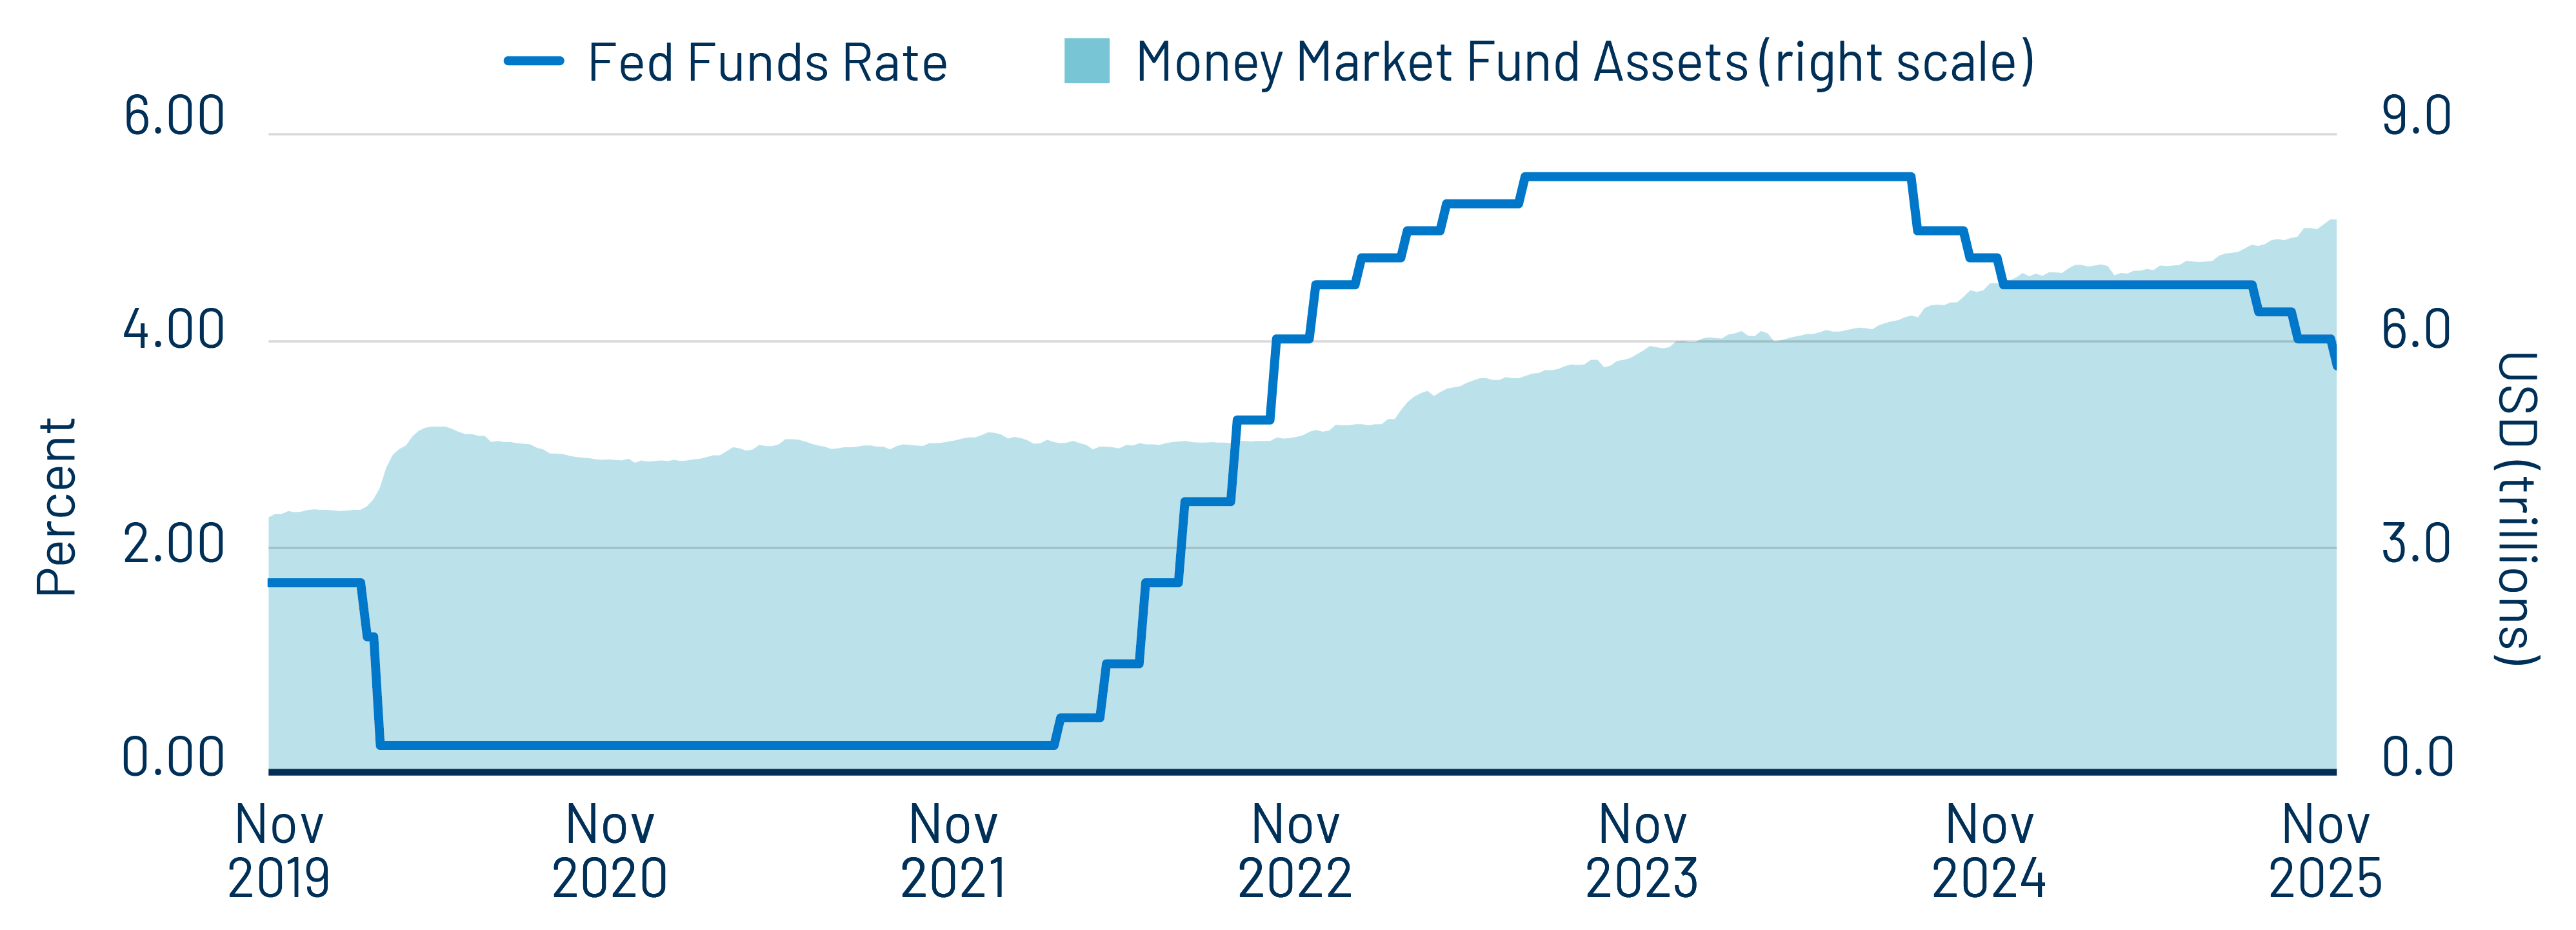
Looking ahead, we expect demand to remain supported by the Fed’s expectations that short-end rates will decline further. Money market assets have increased by $3.1 trillion to $7.7 trillion since the start of the Fed’s hiking cycle. Should those allocations reverse—or even slow—as front-end rates decline, Western Asset believes investors could seek higher income opportunities in other fixed-income asset classes. At current valuations, the after-tax income opportunities offered by the muni market are well positioned to attract such demand, which we expect would contribute to municipal market performance ahead.

Exhibit 2: Money Market Fund Assets vs. Fed Funds Rate
Money Market Fund Assets vs. Fed Funds Rate
Source: ICI, Bloomberg, Western Asset. As of 12 Dec 25. Select the image to expand the view.

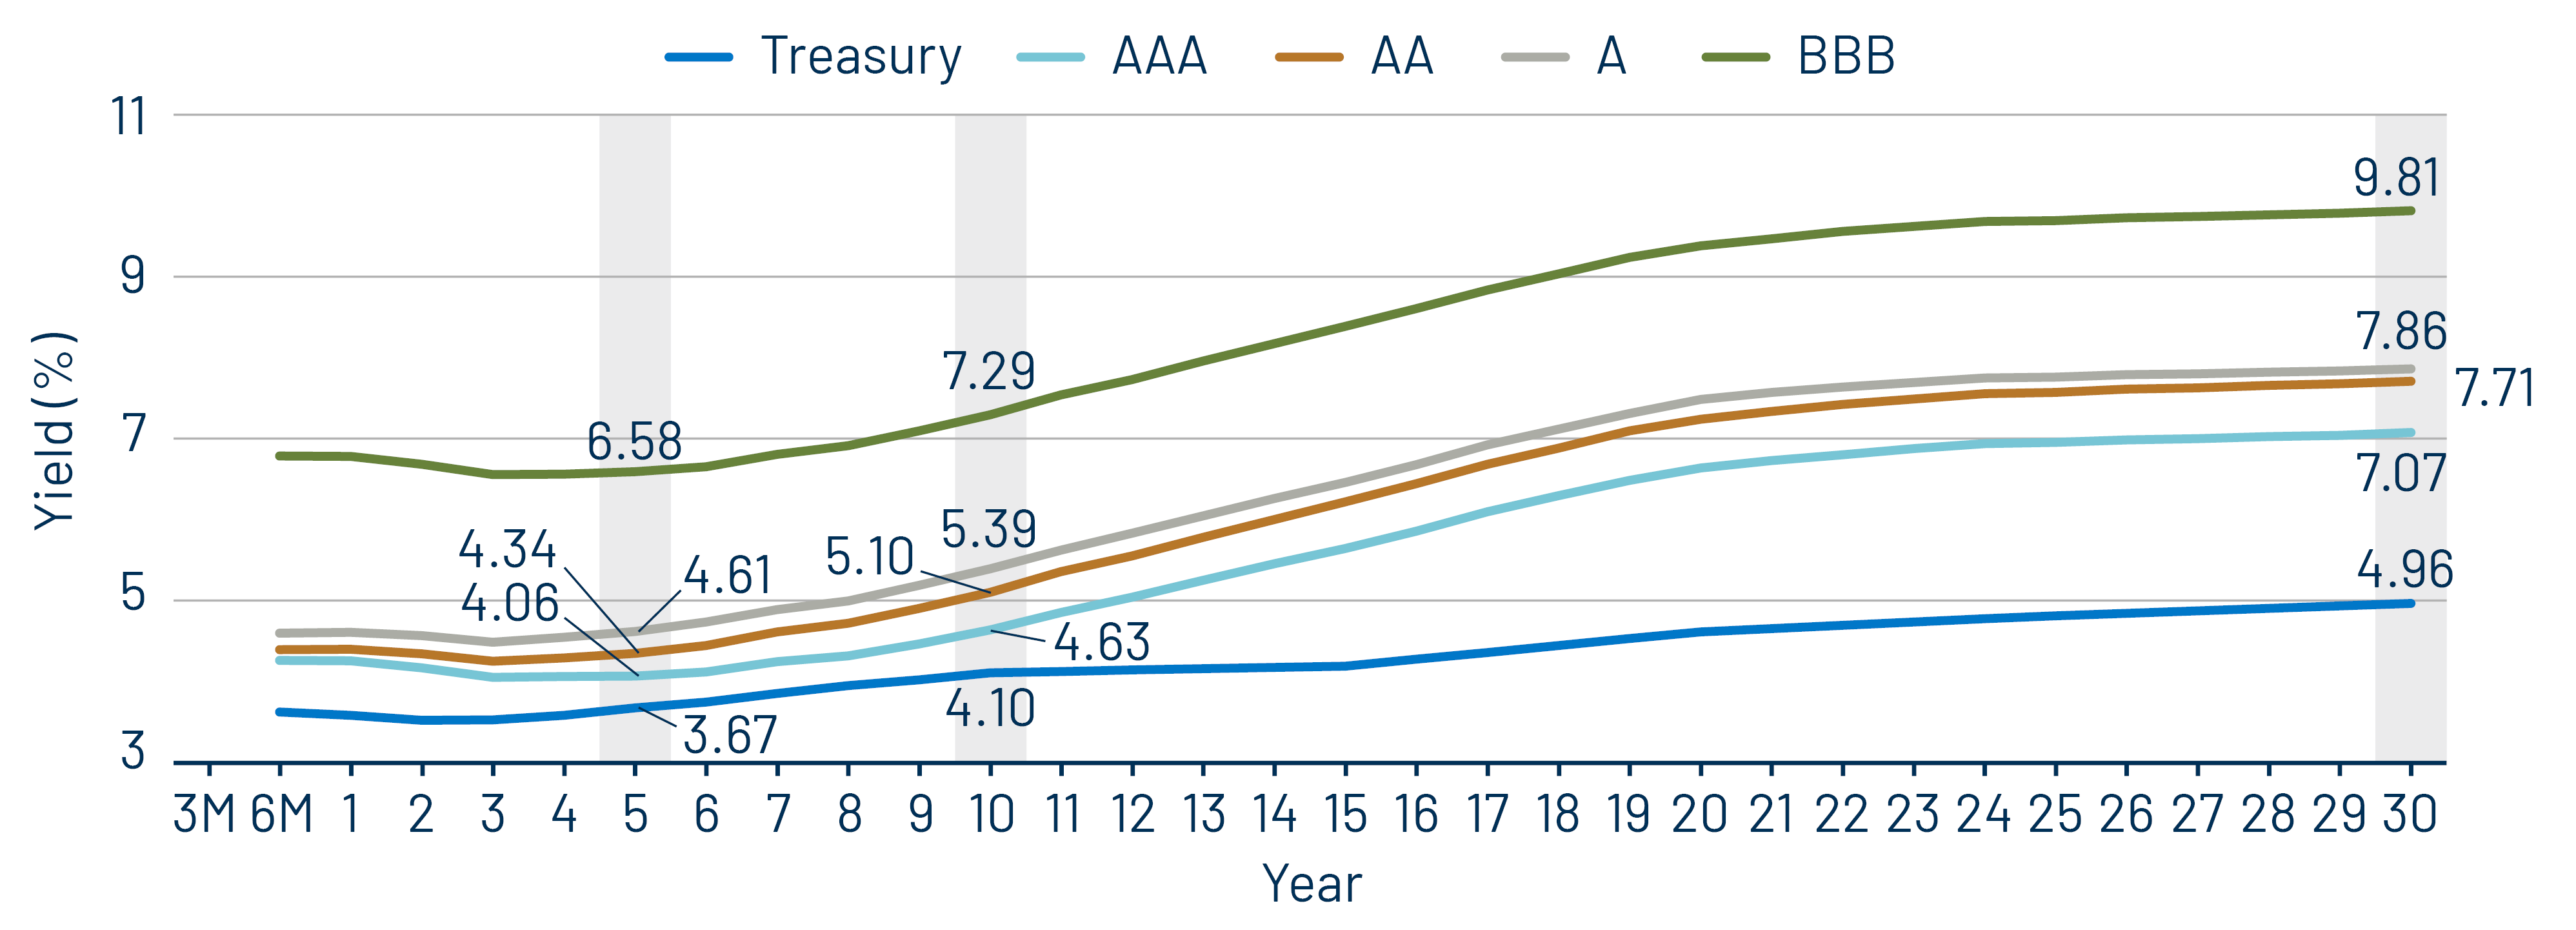
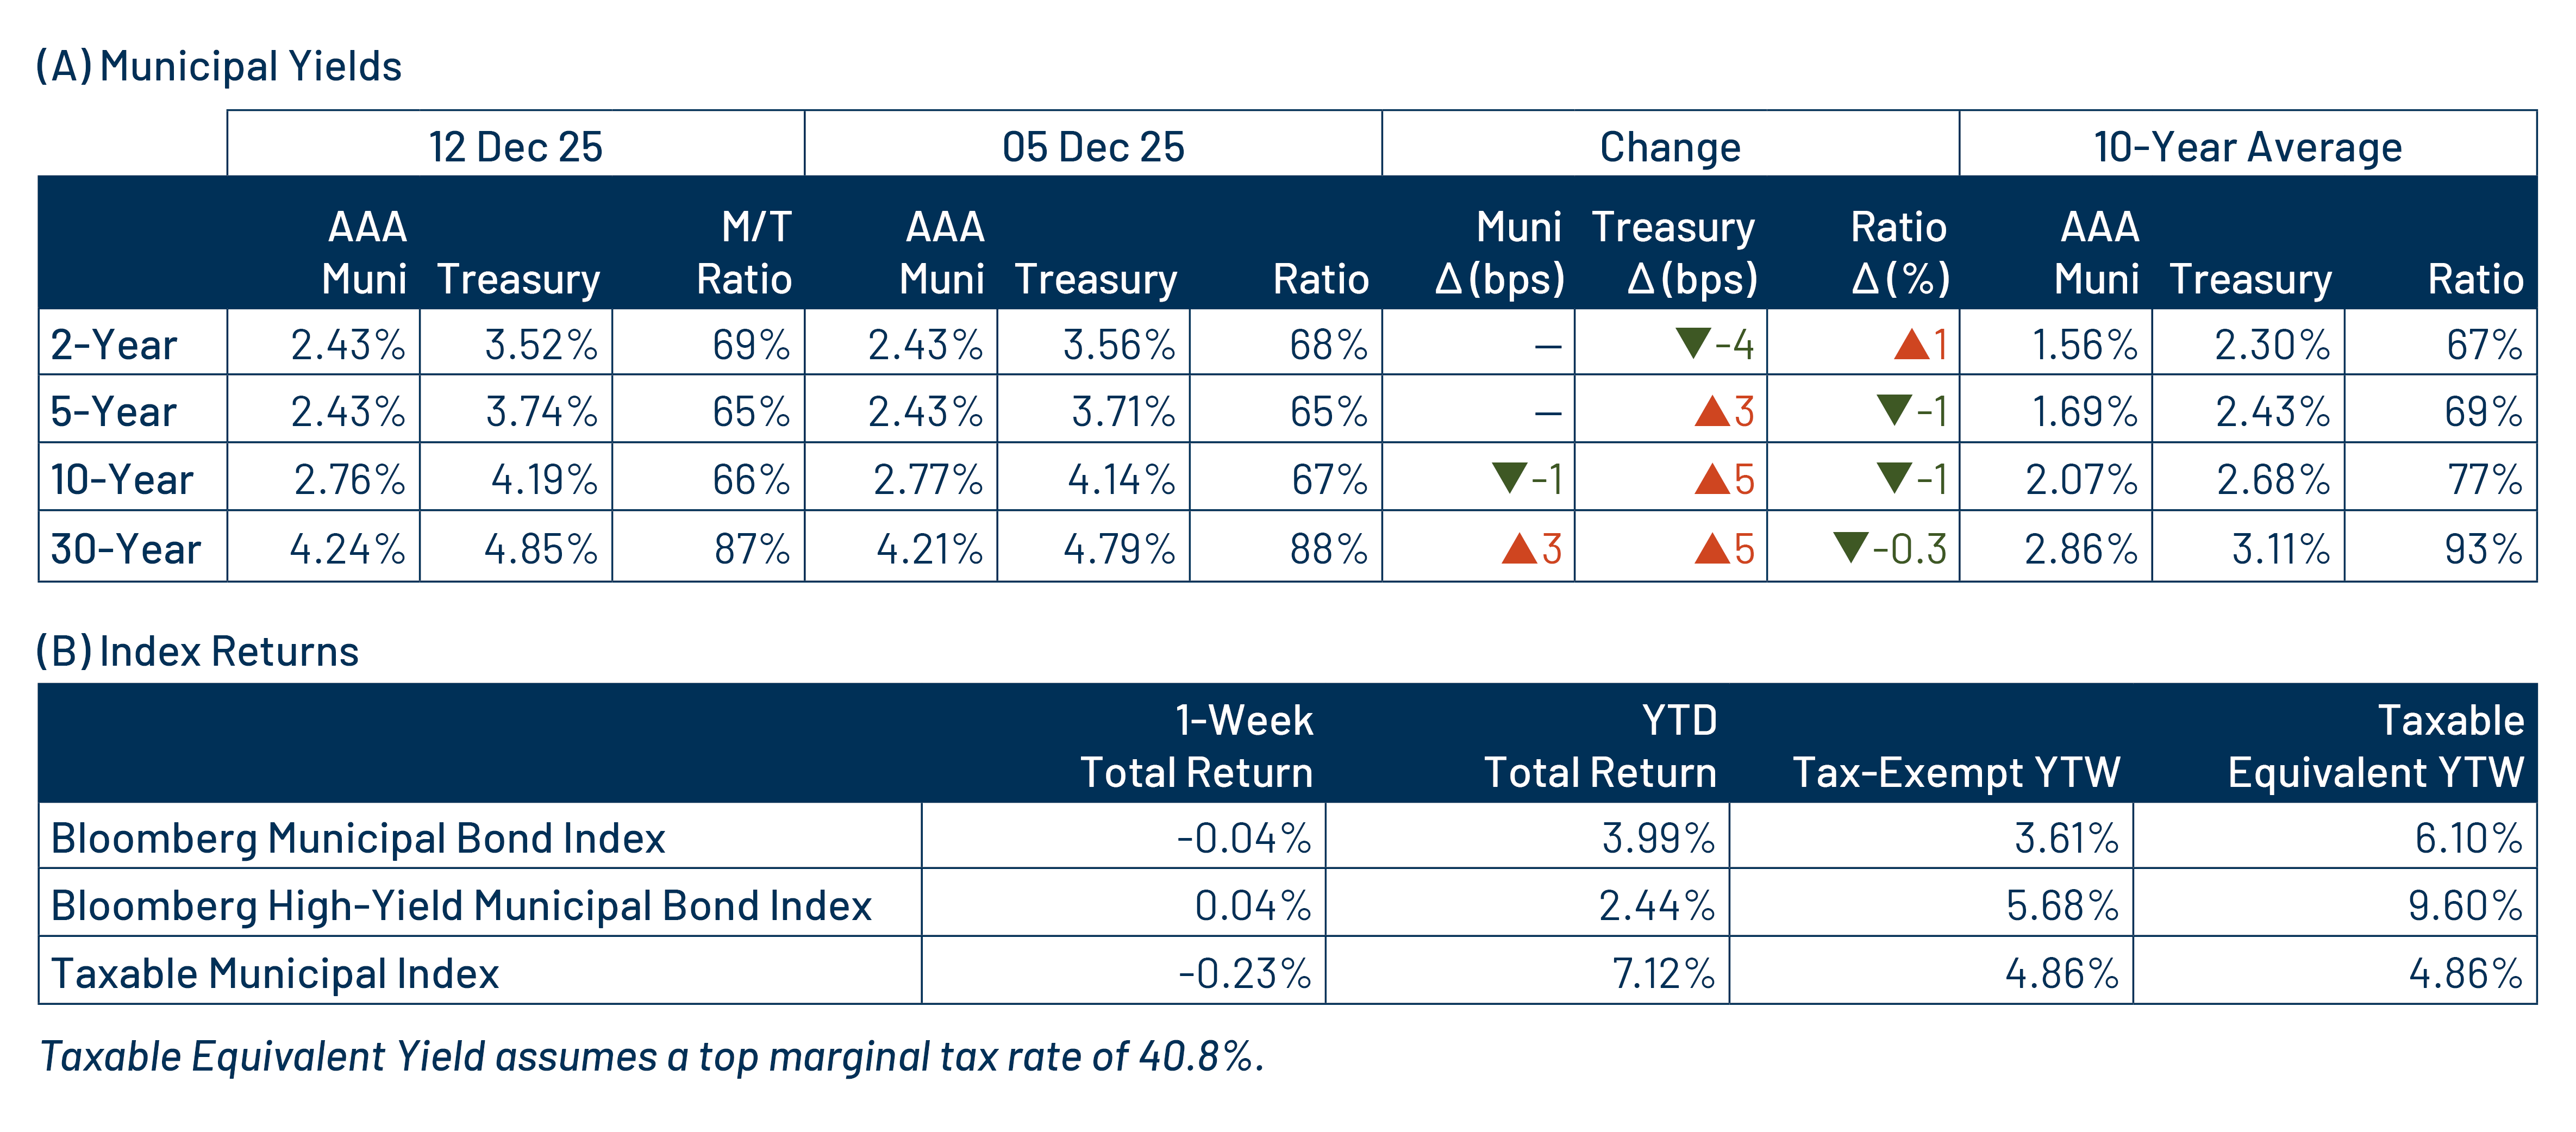
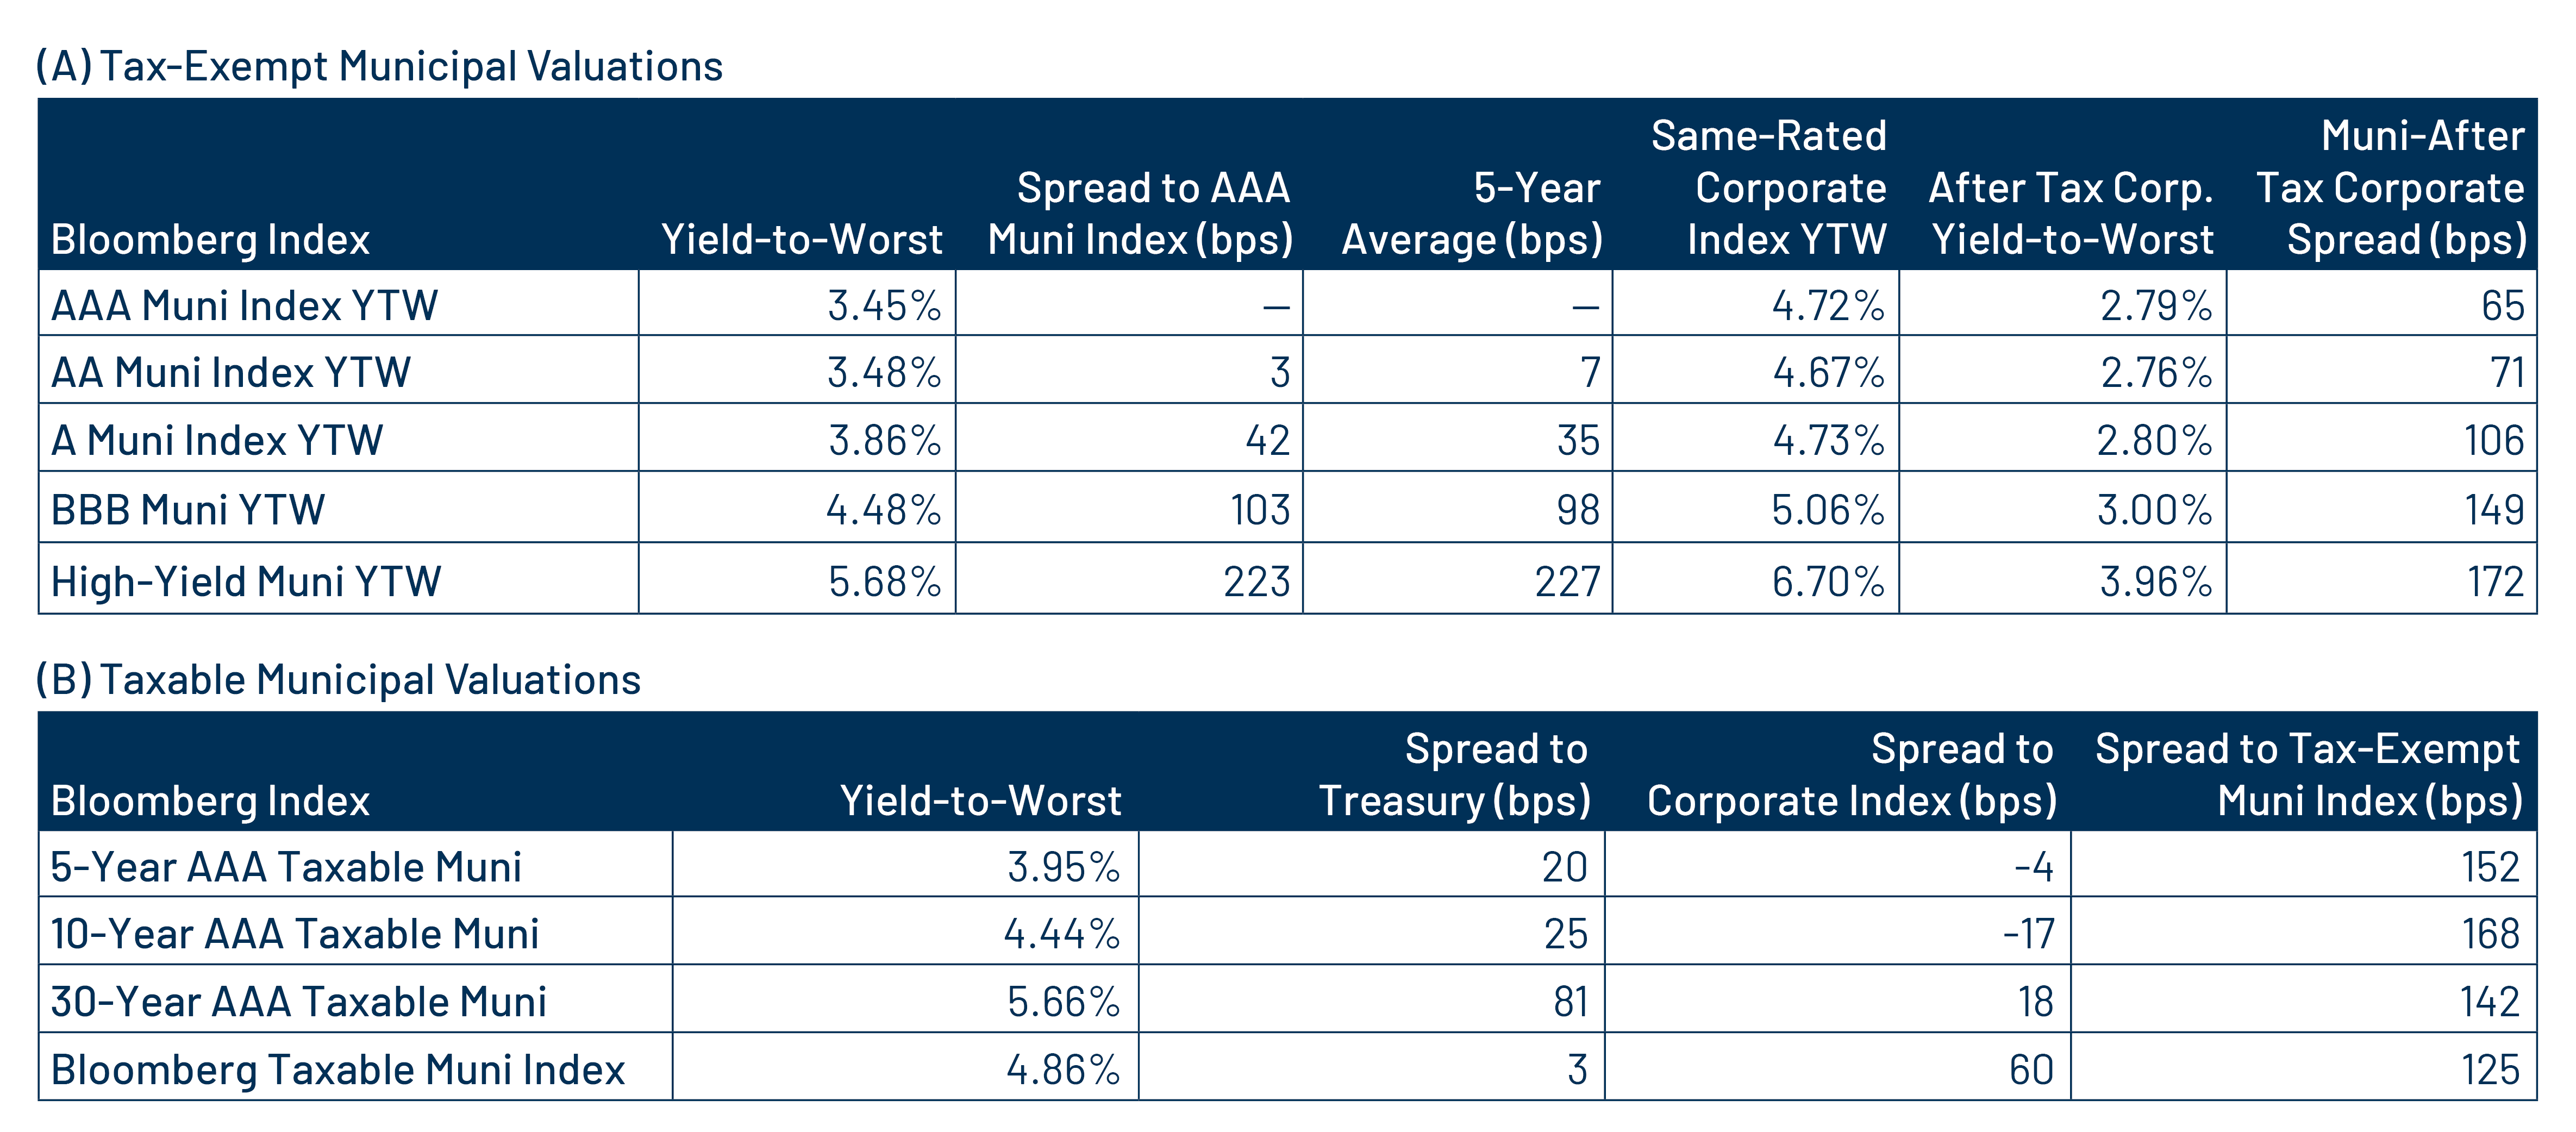
Municipal Credit Curves and Relative Value

Exhibit 3: Muni Credit Curves
Muni Credit Curves
Source: Bloomberg, Western Asset. As of 12 Dec 25. Bloomberg Valuation Service (BVAL) Municipal Credit Indices (AAA, AA, A, BBB, respectively) and US Sovereign Curves. Taxable-Equivalent Muni Credit Curves consider the top marginal effective tax rate of 40.8%. AA Muni is represented by the US General Obligation AA Muni BVAL Yield Curve. The BVAL curve is populated with pricing from uninsured AA General Obligation bonds. A Muni is represented by the US General Obligation A Muni BVAL Yield Curve. The BVAL curve is populated with pricing from uninsured A General Obligation bonds. BBB Muni is represented by the US General Obligation BBB Muni BVAL Yield Curve. The BVAL curve is populated with pricing from uninsured BBB General Obligation bonds. Indices are unmanaged and one cannot directly invest in them. They do not include fees, expenses or sales charges. Past performance is not an indicator or a guarantee of future results. Select the image to expand the view.
Exhibit 4: Taxable-Equivalent Muni Credit Curves
Taxable-Equivalent Muni Credit Curves
Source: Bloomberg, Western Asset. As of 12 Dec 25. Bloomberg Valuation Service (BVAL) Municipal Credit Indices (AAA, AA, A, BBB, respectively) and US Sovereign Curves. Taxable-Equivalent Muni Credit Curves consider the top marginal effective tax rate of 40.8%. AA Muni is represented by the US General Obligation AA Muni BVAL Yield Curve. The BVAL curve is populated with pricing from uninsured AA General Obligation bonds. A Muni is represented by the US General Obligation A Muni BVAL Yield Curve. The BVAL curve is populated with pricing from uninsured A General Obligation bonds. BBB Muni is represented by the US General Obligation BBB Muni BVAL Yield Curve. The BVAL curve is populated with pricing from uninsured BBB General Obligation bonds. Indices are unmanaged and one cannot directly invest in them. They do not include fees, expenses or sales charges. Past performance is not an indicator or a guarantee of future results. Select the image to expand the view.
Exhibit 5: AAA Munis vs. Treasuries
AAA Munis vs. Treasuries
Source: Muni Yields: Thomson Reuters MMD, Treasury Yields: Bloomberg. As of 12 Dec 25. Past performance is not a guarantee of future results. It is not possible to invest directly in an index. Select the image to expand the view.
Exhibit 6: Tax-Exempt and Taxable Muni Valuations
Tax-Exempt and Taxable Muni Valuations
Source: Bloomberg, Western Asset. As of 12 Dec 25. Yield-to-worst (YTW) is the lowest potential yield that can be received on a bond without the issuer actually defaulting. AAA, AA, A, BBB Corporate Indices; After-Tax Yield assumes a top effective tax rate of 40.8%. Taxable Muni Index Corporate comparable used is the Global Corporate Aggregate (ex. BBB) to better align credit quality and duration. Select the image to expand the view.

Western Asset Key Themes for Muni Investors

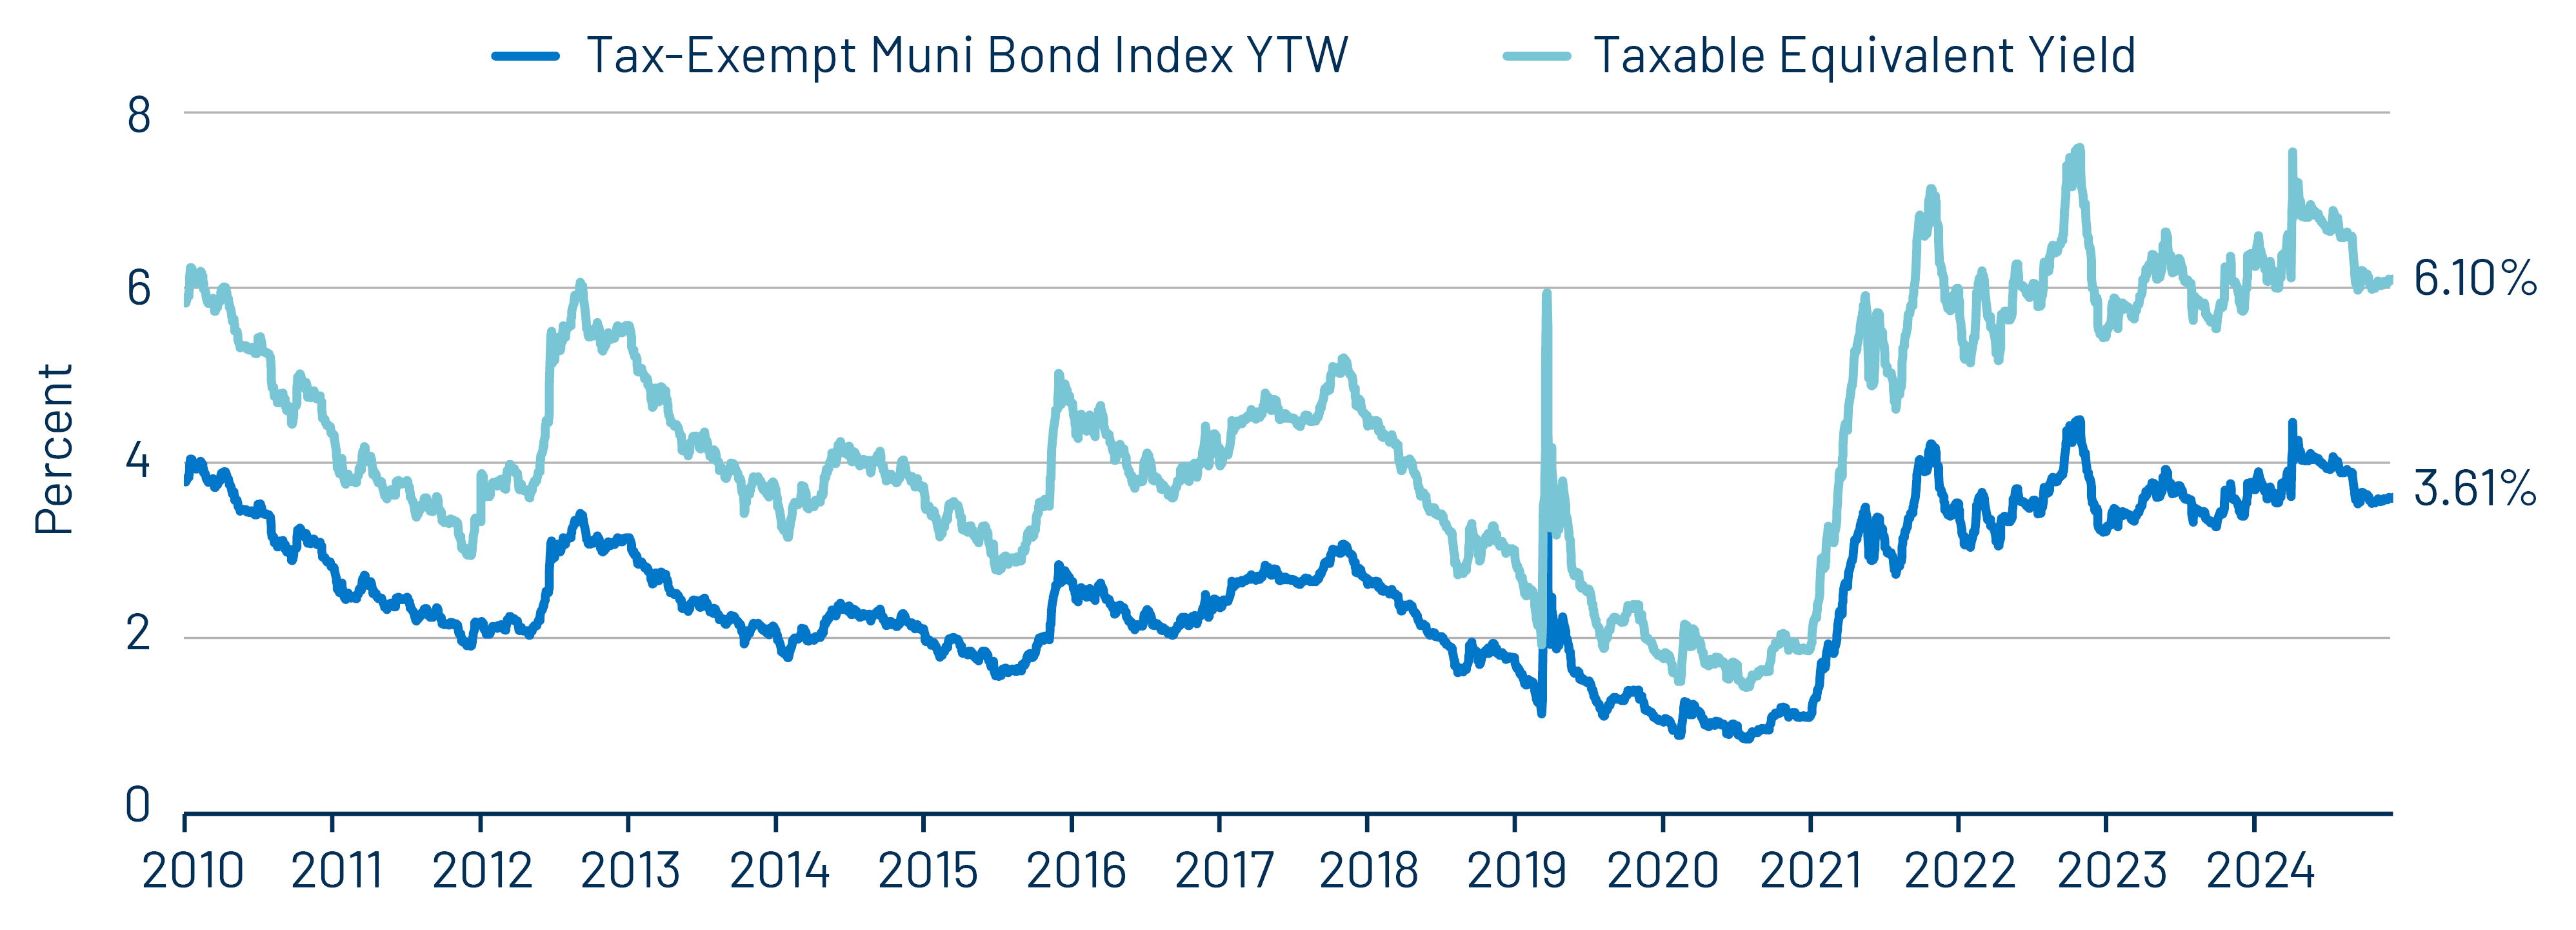
Theme #1: Municipal taxable-equivalent yields and income opportunities remain near decade-high levels.

Exhibit 7: Muni and Taxable-Equivalent Muni Yield-to-Worst
Muni and Taxable-Equivalent Muni Yield-to-Worst
Source: Bloomberg, Western Asset. As of 12 Dec 25. Bloomberg Municipal Bond Index yield considering highest marginal tax rate of 40.8%. Indexes are unmanaged and one cannot directly invest in them. They do not include fees, expenses or sales charges. Past performance is not an indicator or a guarantee of future results. Select the image to expand the view.

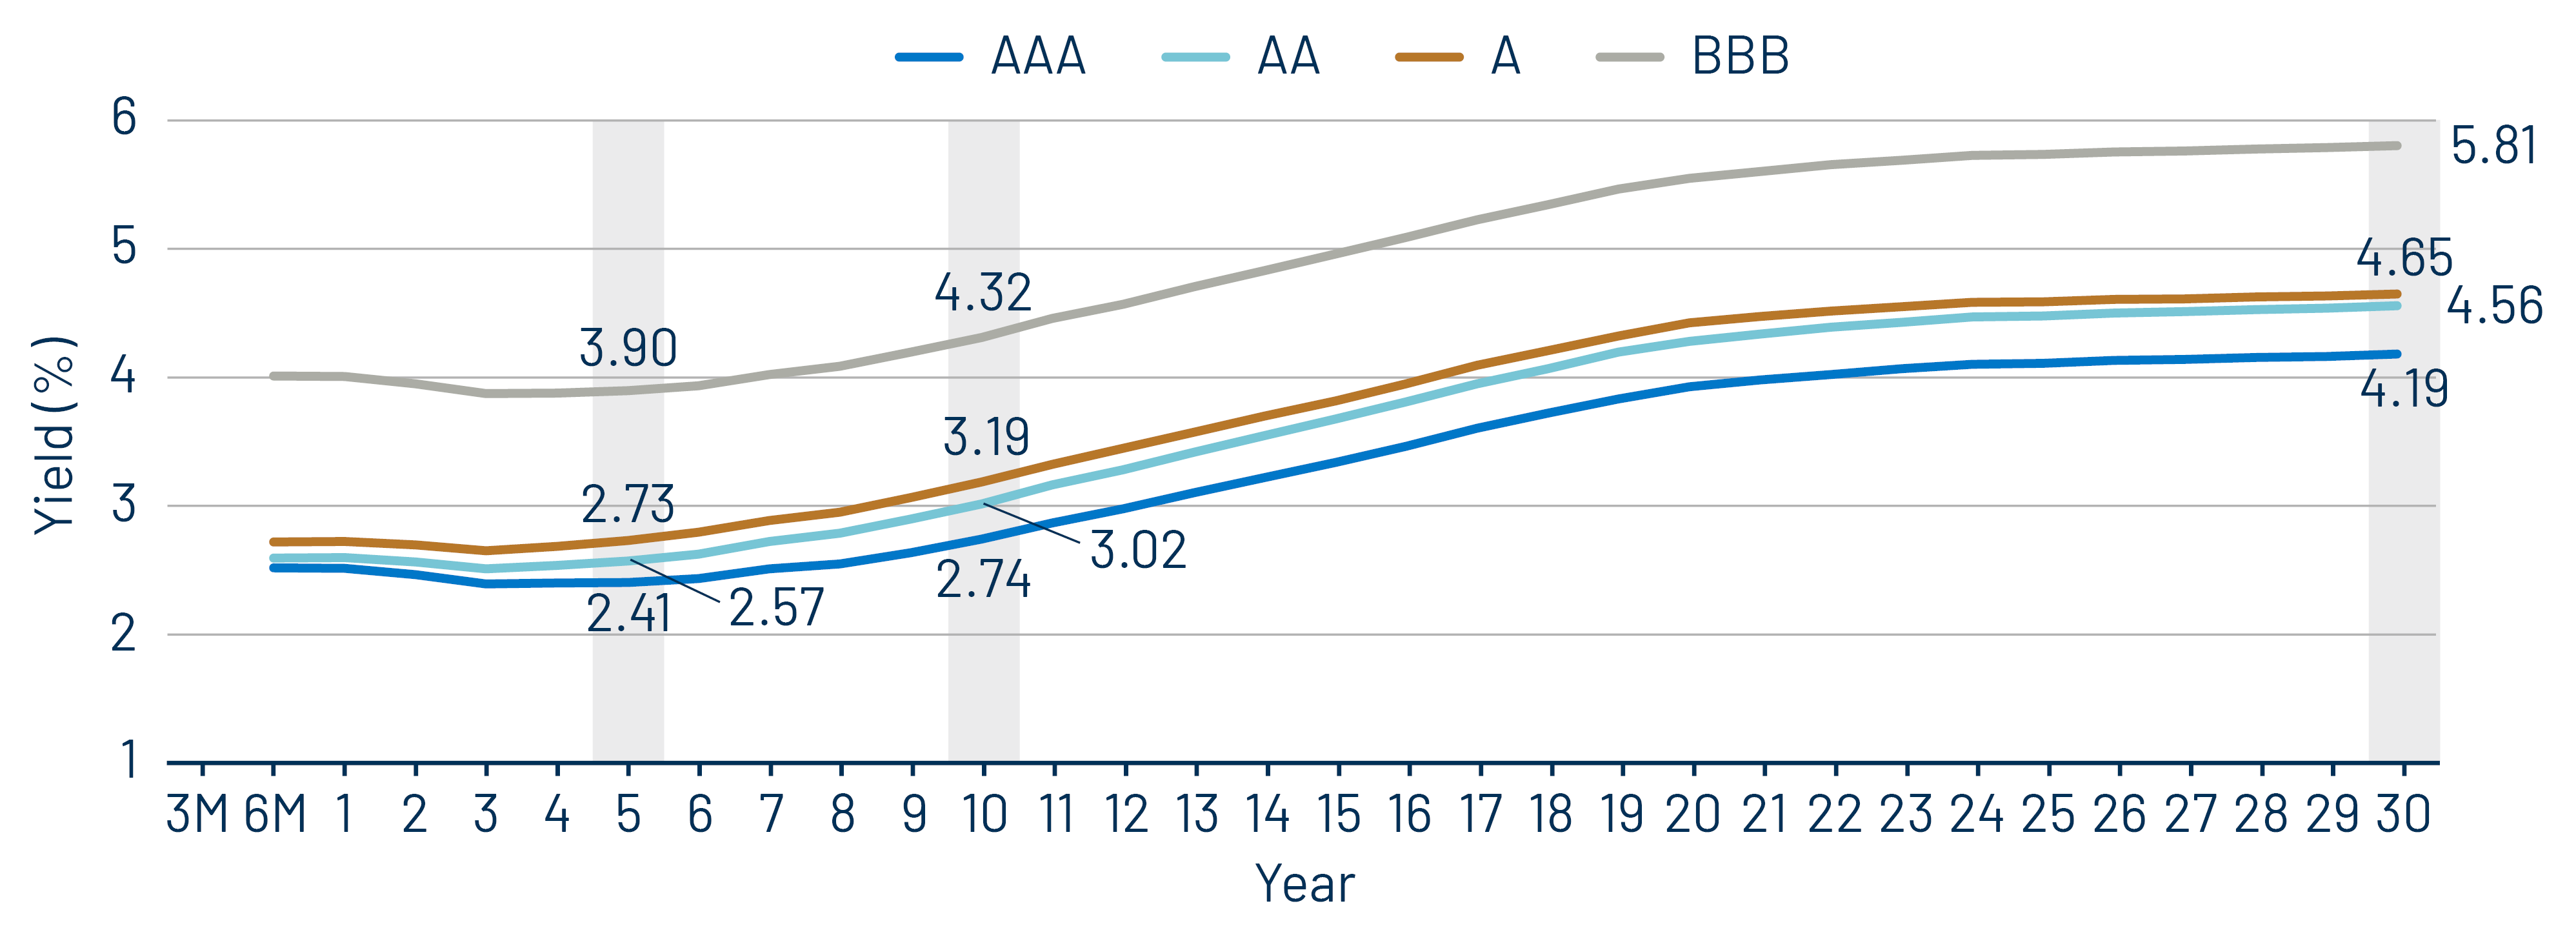
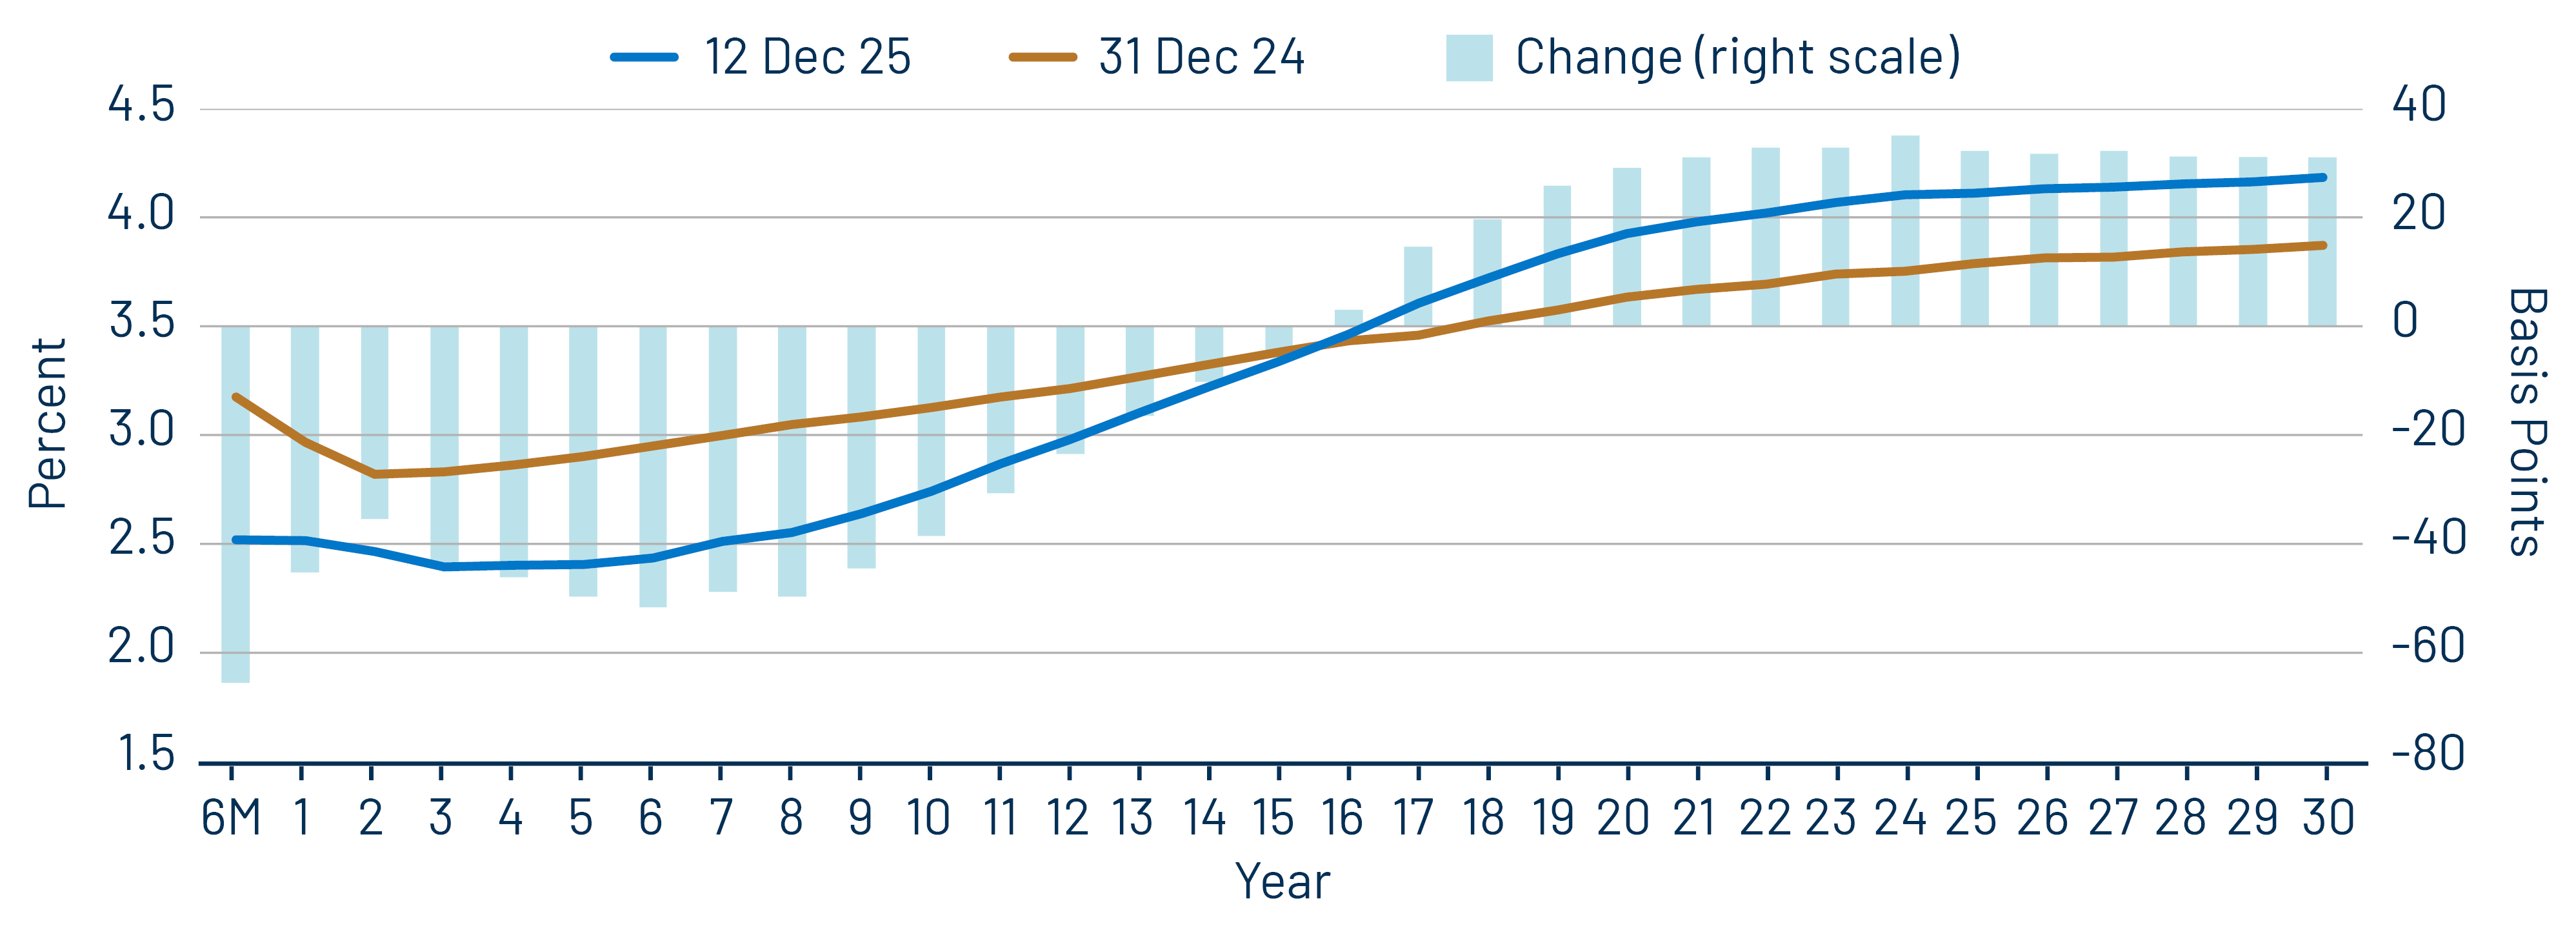
Theme #2: The AAA muni curve has steepened this year, offering better value in intermediate and longer maturities.

Exhibit 8: AAA Municipal vs. Treasury Yield Curves
 AAA Municipal vs. Treasury Yield Curves
Source: Bloomberg, Western Asset. As of 12 Dec 25. Bloomberg Valuation Service (BVAL) AAA Muni Curve and US On-/Off-the-Run Sovereign Curve. Indexes are unmanaged and one cannot directly invest in them. They do not include fees, expenses or sales charges. Past performance is not an indicator or a guarantee of future results. Select the image to expand the view.

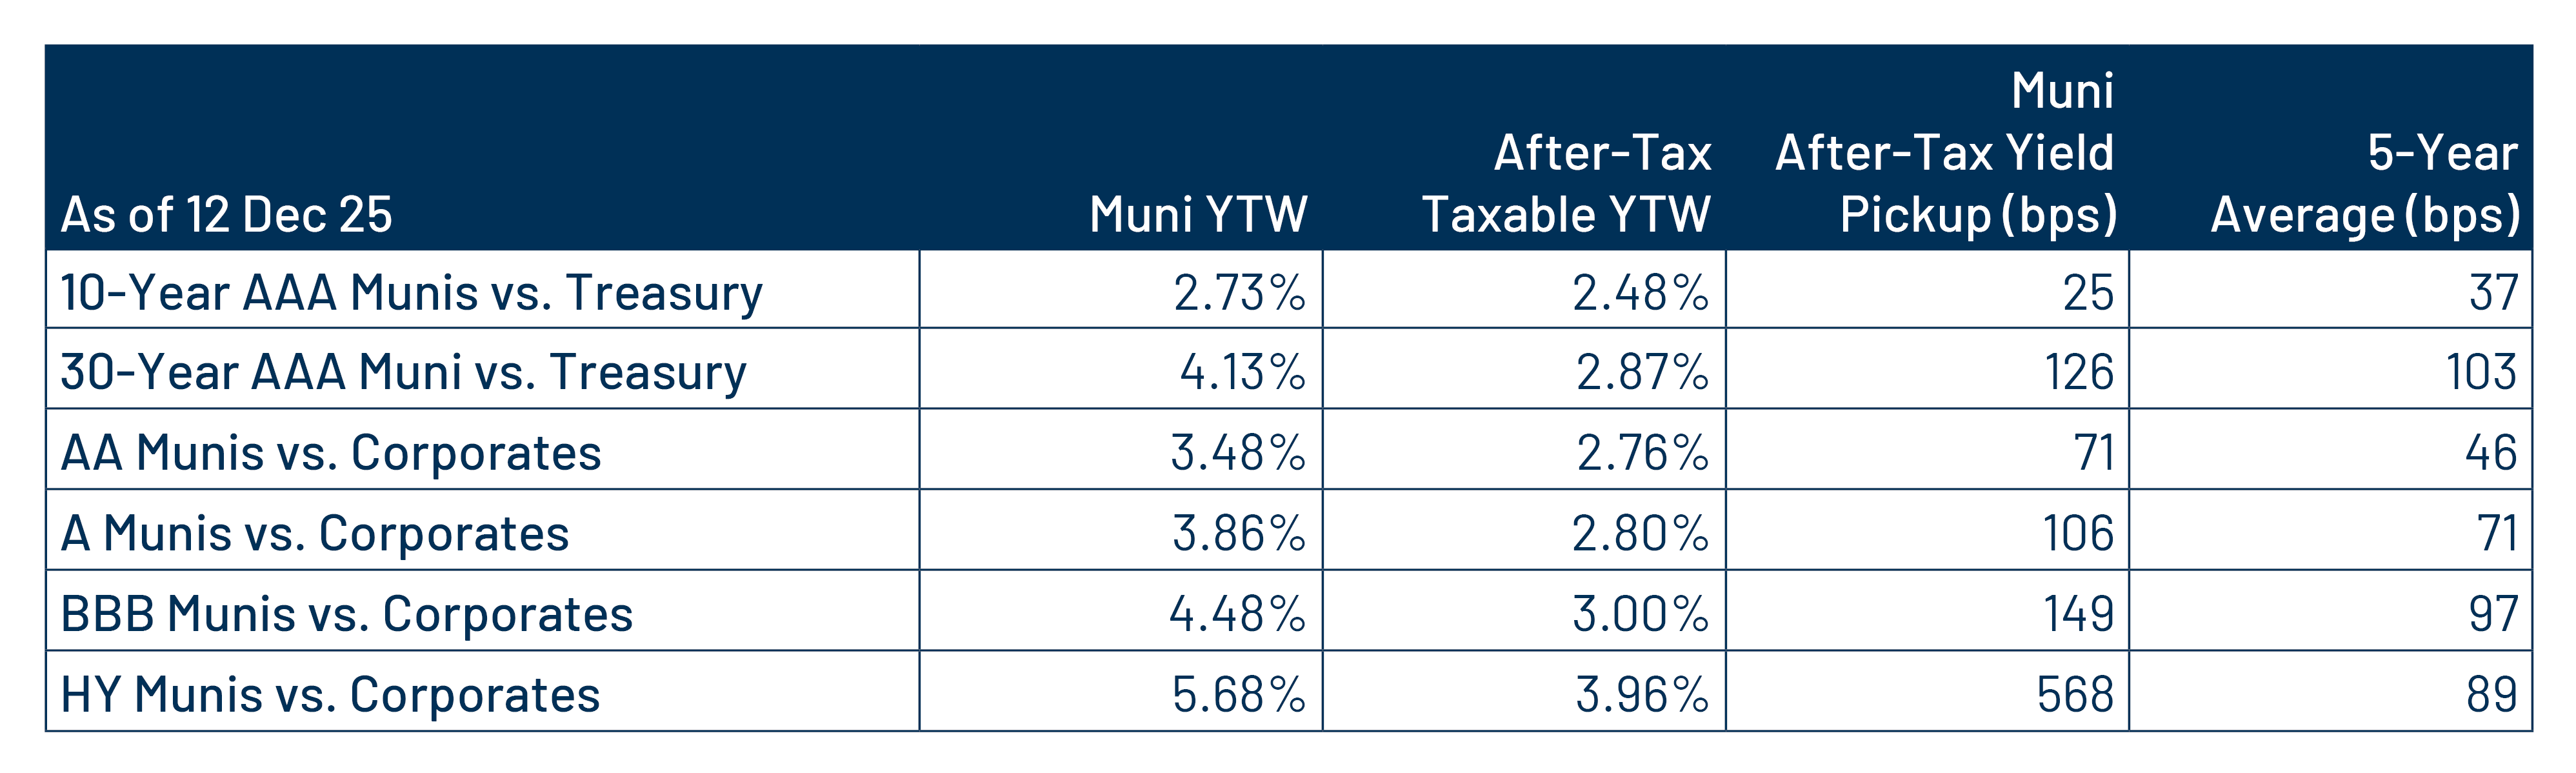
Theme #3: Munis offer attractive after-tax yield compared to taxable alternatives.

Exhibit 9: Municipal vs. Taxable Fixed-Income Yields by Quality
Municipal vs. Taxable Fixed-Income Yields by Quality
Source: Western Asset, Bloomberg. As of 12 Dec 25. 10- and 30-Year comparison reflects Bloomberg Valuation Service (BVAL) AAA Muni Curve and US On-/Off-the-Run Sovereign Curve. AA Muni reflects the Bloomberg AA Muni Bond Index. A Muni reflects the Bloomberg A Muni Bond Index. BBB Muni reflects the Bloomberg BBB Muni Bond Index. HY Muni reflects the Bloomberg High Yield Muni Bond Index. AA Corp reflects the Bloomberg AA Corporate Bond Index. A Corp reflects the Bloomberg A Corporate Bond Index. BBB Corp reflects the Bloomberg BBB Corporate Bond Index. After-tax yield considers the top marginal tax rate of 40.8%. Indexes are unmanaged and one cannot directly invest in them. They do not include fees, expenses or sales charges. Past performance is not an indicator or a guarantee of future results. Select the image to expand the view.

© Western Asset Management Company, LLC 2025. The information contained in these materials ("the materials") is intended for the exclusive use of the designated recipient ("the recipient"). This information is proprietary and confidential and may contain commercially sensitive information, and may not be copied, reproduced or republished, in whole or in part, without the prior written consent of Western Asset Management Company ("Western Asset").
Past performance does not predict future returns. These materials should not be deemed to be a prediction or projection of future performance. These materials are intended for investment professionals including professional clients, eligible counterparties, and qualified investors only.
These materials have been produced for illustrative and informational purposes only. These materials contain Western Asset's opinions and beliefs as of the date designated on the materials; these views are subject to change and may not reflect real-time market developments and investment views.
Third party data may be used throughout the materials, and this data is believed to be accurate to the best of Western Asset's knowledge at the time of publication, but cannot be guaranteed. These materials may also contain strategy or product awards or rankings from independent third parties or industry publications which are based on unbiased quantitative and/or qualitative information determined independently by each third party or publication. In some cases, Western Asset may subscribe to these third party's standard industry services or publications. These standard subscriptions and services are available to all asset managers and do not influence rankings or awards in any way.
Investment strategies or products discussed herein may involve a high degree of risk, including the loss of some or all capital. Investments in any products or strategies described in these materials may be volatile, and investors should have the financial ability and willingness to accept such risks.
Unless otherwise noted, investment performance contained in these materials is reflective of a strategy composite. All other strategy data and information included in these materials reflects a representative portfolio which is an account in the composite that Western Asset believes most closely reflects the current portfolio management style of the strategy. Performance is not a consideration in the selection of the representative portfolio. The characteristics of the representative portfolio shown may differ from other accounts in the composite. Information regarding the representative portfolio and the other accounts in the composite are available upon request. Statements in these materials should not be considered investment advice. References, either general or specific, to securities and/or issuers in the materials are for illustrative purposes only and are not intended to be, and should not be interpreted as, recommendation to purchase or sell such securities. Employees and/or clients of Western Asset may have a position in the securities or issuers mentioned.
These materials are not intended to provide, and should not be relied on for, accounting, legal, tax, investment or other advice. The recipient should consult its own counsel, accountant, investment, tax, and any other advisers for this advice, including economic risks and merits, related to making an investment with Western Asset. The recipient is responsible for observing the applicable laws and regulations of their country of residence.
Founded in 1971, Western Asset Management Company is a global fixed-income investment manager with offices in Pasadena, New York, London, Singapore, Tokyo, Melbourne, São Paulo, Hong Kong, and Zürich. Western Asset is a wholly owned subsidiary of Franklin Resources, Inc. but operates autonomously. Western Asset is comprised of six legal entities across the globe, each with distinct regional registrations: Western Asset Management Company, LLC, a registered Investment Adviser with the Securities and Exchange Commission; Western Asset Management Company Ltda. is regulated by Comissão de Valores Mobiliários; Western Asset Management Company Pty Ltd ABN 41 117 767 923 is the holder of the Australian Financial Services License 303160; Western Asset Management Company Pte. Ltd. Co. Reg. No. 200007692R is a holder of a Capital Markets Services License for fund management and regulated by the Monetary Authority of Singapore; Western Asset Management Company Ltd, a registered Financial Instruments Business Operator and regulated by the Financial Services Agency of Japan; and Western Asset Management Company Limited is authorised and regulated by the Financial Conduct Authority ("FCA") (FRN 145930). This communication is intended for distribution to Professional Clients only if deemed to be a financial promotion in the UK as defined by the FCA. This communication may also be intended for certain EEA countries where Western Asset has been granted permission to do so. For the current list of the approved EEA countries please contact Western Asset at +44 (0)20 7422 3000.